. 2022 Oct 18:2:kvac014.
doi: 10.1093/oons/kvac014. eCollection 2023.

Dynamics and Mechanisms of ERK Activation after Different Protocols that Induce Long-Term Synaptic Facilitation in Aplysia

Affiliations

Dynamics and Mechanisms of ERK Activation after Different Protocols that Induce Long-Term Synaptic Facilitation in Aplysia

Yili Zhang et al. Oxf Open Neurosci. .

Abstract

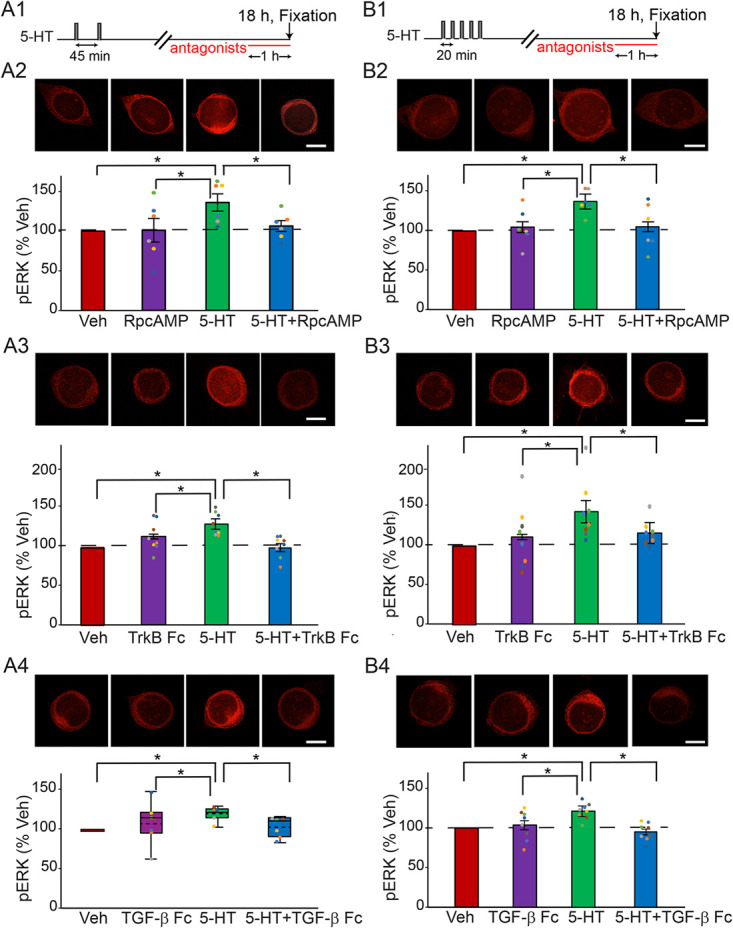
Phosphorylation of the MAPK family member extracellular signal-regulated kinase (ERK) is required to induce long-term synaptic plasticity, but little is known about its persistence. We examined ERK activation by three protocols that induce long-term synaptic facilitation (LTF) of the Aplysia sensorimotor synapse - the standard protocol (five 5-min pulses of 5-HT with interstimulus intervals (ISIs) of 20 min), the enhanced protocol (five pulses with irregular ISIs, which induces greater and longer-lasting LTF) and the two-pulse protocol (two pulses with ISI 45 min). Immunofluorescence revealed complex ERK activation. The standard and two-pulse protocols immediately increased active, phosphorylated ERK (pERK), which decayed within 5 h. A second wave of increased pERK was detected 18 h post-treatment for all protocols. This late phase was blocked by inhibitors of protein kinase A, TrkB and TGF-β. These results suggest that complex interactions among kinase pathways and growth factors contribute to the late increase of pERK. ERK activity returned to basal 24 h after the standard or two-pulse protocols, but remained elevated 24 h for the enhanced protocol. This 24-h elevation was also dependent on PKA and TGF-β, and partly on TrkB. These results begin to characterize long-lasting ERK activation, plausibly maintained by positive feedback involving growth factors and PKA, that appears essential to maintain LTF and LTM. Because many processes involved in LTF and late LTP are conserved among Aplysia and mammals, these findings highlight the importance of examining the dynamics of kinase cascades involved in vertebrate long-term memory.

Keywords: Aplysia; ERK; TGF-β; TrkB; computationally designed training protocol; long-term facilitation.


Conflict of interest statement

None declared.

Figures

Figure 1
Figure 1
Induction of LTF by the two-pulse protocol. (A) Protocol for two-pulse treatment with 5-HT (50 μM). (B) Representative EPSPs recorded from MNs in sensorimotor co-cultures before (pre) and 24 h after treatment. (C) Summary data. Two-pulse treatment with 5-HT induced significant increases in the amplitude of EPSPs. Bar height represents the mean, small bars represent standard error of the mean (SEM), and significant differences are indicated by * for P < 0.05. Gray circles indicate the results of individual experiments.
Figure 2
Figure 2
Dynamics of pERK induced by three LTF-inducing protocols. (A) Time course of ERK activation. The percent change was calculated as the change of pERK level after 5-HT compared to time-matched vehicle control. A late increase of pERK at ~18 h was induced by the two-pulse protocol (red), standard protocol (blue) and enhanced protocol (black), with no significant differences between protocols at this time point. At 24 h, however, pERK only remained elevated for the enhanced protocol. (B) Changes of pERK at 24 h after different 5-HT protocols. (B1) Representative confocal images of pERK immunostaining in SNs. (B2) Summary data. pERK induced by the enhanced protocol was significantly greater than pERK induced by the other two protocols. Scale bar in B1 is 40 μm. Bar heights in B2 represent the mean, small bars represent standard error of the mean (SEM). Gray circles indicate the results of individual experiments. * P < 0.05.
Figure 3
Figure 3
Late increase of pERK at 18 h after the two-pulse (A), or the standard protocol (B) was dependent on PKA, TrkB and TGF-β. (A1) Protocol for applying the antagonists after two-pulse protocol. (A2) Representative confocal images and summary data of pERK in SNs at 18 h after two pulses of 5-HT, in the absence or presence of PKA inhibitor RpcAMP. RpcAMP significantly decreased pERK induced by 5-HT (n = 6). (A3) Representative confocal images and summary data of pERK at 18 h after two pulses of 5-HT, in the absence or presence of TrkB inhibitor TrkB Fc. TrkB Fc significantly decreased pERK induced by 5-HT (n = 8). (A4) Representative confocal images and summary data of pERK at 18 h after two pulses of 5-HT, in the absence or presence of TGF-β inhibitor TGF-β RII Fc (TGF-β Fc). TGF-β RII Fc significantly decreased pERK induced by 5-HT (n = 7). (B1) Protocol for applying the antagonists after standard protocol. (B2) Representative confocal images and summary data of pERK in SNs at 18 h after five pulses of 5-HT, in the absence or presence of PKA inhibitor RpcAMP. RpcAMP significantly decreased pERK induced by 5-HT (n = 6). (B3) Representative confocal images and summary data of pERK at 18 h after five pulses of 5-HT, in the absence or presence of TrkB inhibitor TrkB Fc. TrkB Fc significantly decreased pERK induced by 5-HT (n = 8). (B4) Representative confocal images and summary data of pERK at 18 h after five pulses of 5-HT, in the absence or presence of TGF-β inhibitor TGF-β RII Fc. TGF-β RII Fc significantly decreased pERK induced by 5-HT (n = 8). All scale bars are 40 μm. Bar heights in A2–3, B2–B4 represent the mean, small bars represent standard error of the mean (SEM). Circles indicate the results of individual experiments. Circles with the same color indicate the results are from the same animal. Data in A4 are not normally distributed, thus presented by box-and-whisker plots. The median is indicated by the solid line in the interior of the box. The mean is indicated by the dashed line in the interior of the box. The lower end of the box is the first quartile (Q1). The upper end of the box is the third quartile (Q3). In this and the next figure, the ends of the vertical lines (whiskers) are the maximum and minimum values of all data points. * P < 0.05
Figure 4
Figure 4
Late increase of pERK at 24 h after the enhanced protocol was dependent on PKA and TGF-β, and partially dependent on TrkB. (A) Protocol for applying the antagonists after enhanced protocol. (B) Representative confocal images and summary data of pERK in SNs at 24 h after five pulses of 5-HT, in the absence or presence of PKA inhibitor RpcAMP. RpcAMP significantly decreased pERK induced by 5-HT (n = 6). (C) Representative confocal images and summary data of pERK at 24 h after five pulses of 5-HT, in the absence or presence of TrkB inhibitor TrkB Fc. TrkB Fc significantly decreased pERK induced by 5-HT (n = 9). (D) Representative confocal images and summary data of pERK at 24 h after five pulses of 5-HT, in the absence or presence of TGF-β inhibitor TGF-β RII Fc. TGF-β RII Fc significantly decreased pERK induced by 5-HT (n = 9). All scale bars are 40 μm. Bar heights in B represent the mean, small bars represent standard error of the mean (SEM). Circles with the same color indicate the results of individual experiments from the same animal. Data in C and D are not normally distributed, thus presented by box-and-whisker plots. The median is indicated by the solid line in the interior of the box. The mean is indicated by the dashed line in the interior of the box. The lower end of the box is the first quartile (Q1). The upper end of the box is the third quartile (Q3). * P < 0.05
Figure 5
Figure 5
Model for the molecular pathways in SNs that regulate pERK dynamics and LTF. Release of 5-HT activate multiple kinases that are involved in the activation of ERK, including PKA, RSK and p38 MAPK. These kinases interact with growth factors NT and TGF-β to induce multiple feedback loops for the sustained increase of ERK activity up to 24 h after 5-HT. Activation of ERK and other kinases in turn activates genes (e.g. creb1/2, c/ebp) essential for the induction of LTF. These processes do not all occur at a single time point, but rather sequentially or, in some cases, partly in parallel. The final steps (dashed lines) between phosphorylation of C/EBP, activation of downstream effector genes and LTF schematically represent numerous, mostly uncharacterized processes. The ultimate output is affected by interlocking positive and negative feedback loops that determine CREB1 and CREB2 activity. Arrowheads indicate activation, circular ends indicate repression.

References

    1. Abel T, Nguyen PV, Barad Met al. . Genetic demonstration of a role for PKA in the late phase of LTP and in hippocampus-based long-term memory. Cell. 1997;88:615–26 PMID: 9054501 - PubMed
    1. Adams JP, Sweatt JD. Molecular psychology: roles for the ERK MAP kinase cascade in memory. Annu Rev Pharmacol Toxicol. 2002;42:135–63 PMID: 11807168 - PubMed
    1. Blum S, Moore AN, Adams F, Dash PK. A mitogen-activated protein kinase cascade in the CA1/CA2 subfield of the dorsal hippocampus is essential for long-term spatial memory. J Neurosci. 1999;19:3535–44 PMID: 10212313 - PMC - PubMed
    1. Byrne JH, Hawkins RD. Nonassociative learning in invertebrates. Cold Spring Harb Perspect Biol. 2015;7:a021675 PMID: 25722464 - PMC - PubMed
    1. Cleary LJ, Lee WL, Byrne JH. Cellular correlates of long-term sensitization in Aplysia. J Neurosci. 1998;18:5988–98 - PMC - PubMed

LinkOut - more resources