. 2023 Aug 15:14:1220796.
doi: 10.3389/fphar.2023.1220796. eCollection 2023.

Assessment of the proarrhythmic effects of repurposed antimalarials for COVID-19 treatment using a comprehensive in vitro proarrhythmia assay (CiPA)

Affiliations

Assessment of the proarrhythmic effects of repurposed antimalarials for COVID-19 treatment using a comprehensive in vitro proarrhythmia assay (CiPA)

Seung-Hyun Yoon et al. Front Pharmacol. .

Abstract

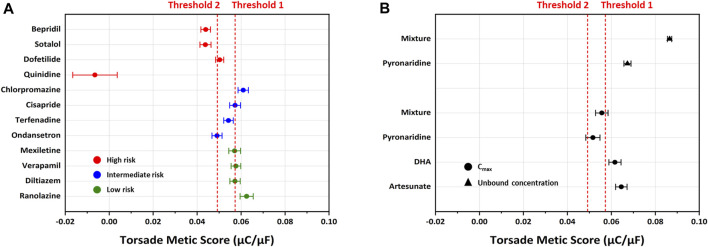
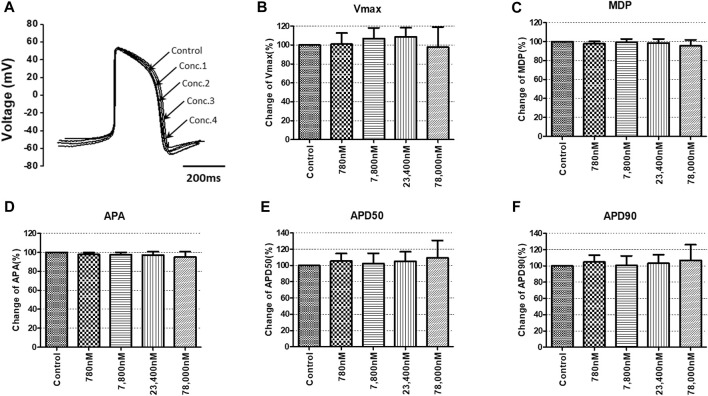
Due to the outbreak of the SARS-CoV-2 virus, drug repurposing and Emergency Use Authorization have been proposed to treat the coronavirus disease 2019 (COVID-19) during the pandemic. While the efficiency of the drugs has been discussed, it was identified that certain compounds, such as chloroquine and hydroxychloroquine, cause QT interval prolongation and potential cardiotoxic effects. Drug-induced cardiotoxicity and QT prolongation may lead to life-threatening arrhythmias such as torsades de pointes (TdP), a potentially fatal arrhythmic symptom. Here, we evaluated the risk of repurposed pyronaridine or artesunate-mediated cardiac arrhythmias alone and in combination for COVID-19 treatment through in vitro and in silico investigations using the Comprehensive in vitro Proarrhythmia Assay (CiPA) initiative. The potential effects of each drug or in combinations on cardiac action potential (AP) and ion channels were explored using human induced pluripotent stem cell-derived cardiomyocytes (hiPSC-CMs) and Chinese hamster ovary (CHO) cells transiently expressing cardiac ion channels (Nav1.5, Cav1.2, and hERG). We also performed in silico computer simulation using the optimized O'Hara-Rudy human ventricular myocyte model (ORd model) to classify TdP risk. Artesunate and dihydroartemisinin (DHA), the active metabolite of artesunate, are classified as a low risk of inducing TdP based on the torsade metric score (TMS). Moreover, artesunate does not significantly affect the cardiac APs of hiPSC-CMs even at concentrations up to 100 times the maximum serum concentration (Cmax). DHA modestly prolonged at APD90 (10.16%) at 100 times the Cmax. When considering Cmax, pyronaridine, and the combination of both drugs (pyronaridine and artesunate) are classified as having an intermediate risk of inducing TdP. However, when considering the unbound concentration (the free fraction not bound to carrier proteins or other tissues inducing pharmacological activity), both drugs are classified as having a low risk of inducing TdP. In summary, pyronaridine, artesunate, and a combination of both drugs have been confirmed to pose a low proarrhythmogenic risk at therapeutic and supratherapeutic (up to 4 times) free Cmax. Additionally, the CiPA initiative may be suitable for regulatory use and provide novel insights for evaluating drug-induced cardiotoxicity.

Keywords: COVID-19; CiPA; antimalarials; cardiotoxicity; electrophysiology.


Conflict of interest statement

The authors declare that the research was conducted in the absence of any commercial or financial relationships that could be construed as a potential conflict of interest.

Figures

FIGURE 1
FIGURE 1
Effects of pyronaridine tested considering Cmax on cardiac ionic currents in CHO cells. (A–D) Representative traces demonstrating of ionic currents showing the effect of pyronaridine on Peak Nav1.5 (A), Late Nav1.5 (B), Cav1.2 (C), and hERG (D) at concentrations of 800, 1,600, 2,400, and 3,200 nM, respectively (left), and the concentration-response relationship for each ionic current (right). Data are presented as mean ± standard error of the mean (SEM) and analyzed using Student’s t-test. *p < 0.05, **p < 0.01 or ***p < 0.001 compared to control (n = 3).
FIGURE 2
FIGURE 2
Effects of pyronaridine tested considering unbound concentration on cardiac ionic currents in CHO cells. (A–D) Representative traces of ionic currents demonstrating the effect of pyronaridine on Peak Nav1.5 (A), Late Nav1.5 (B), Cav1.2 (C), and hERG (D) at concentrations of 13.2, 26.4, 39.6, and 52.8 nM, respectively (left), and the concentration-response relationship for each ionic current (right). Data are presented as mean ± standard error of the mean (SEM) and analyzed using Student’s t-test. *p < 0.05, **p < 0.01 or ***p < 0.001 compared to control (n = 3).
FIGURE 3
FIGURE 3
Effects of artesunate tested considering Cmax on cardiac ionic currents in CHO cells. (A–D) Representative traces of ionic currents demonstrating the effect of artesunate on Peak Nav1.5 (A), Late Nav1.5 (B), Cav1.2 (C), and hERG (D) at concentrations of 780, 1,560, 2,340, and 3,120 nM, respectively (left) and the concentration-response relationship for each ionic current (right). Data are presented as mean ± standard error of the mean (SEM) and analyzed using Student’s t-test. *p < 0.05, **p < 0.01 or ***p < 0.001 compared to control (n = 3).
FIGURE 4
FIGURE 4
Effects of dihydroartemisinin (DHA) tested considering Cmax on cardiac ionic currents in CHO cells. (A–D) Representative traces of ionic currents demonstrating the effect of DHA on Peak Nav1.5 (A), Late Nav1.5 (B), Cav1.2 (C), and hERG (D) at concentrations of 780, 1,560, 2,340, and 3,120 nM, respectively (left) and the concentration-response relationship for each ionic current (right). Data are presented as mean ± standard error of the mean (SEM) and analyzed using Student’s t-test. *p < 0.05, **p < 0.01 or ***p < 0.001 compared to control (n = 3).
FIGURE 5
FIGURE 5
Effects of the mixture tested considering Cmax on cardiac ionic currents in CHO cells. (A–D) Representative traces of ionic currents demonstrating the effect of the mixture on Peak Nav1.5 (A), Late Nav1.5 (B), Cav1.2 (C), and hERG (D) with pyronaridine concentrations of 800, 1,600, 2,400, and 3,200 nM, and artesunate concentrations of 600, 1,200, 1,800, and 2,400 nM, respectively (left). Concentration-response relationship for each ionic current (right). Data are presented as mean ± standard error of the mean (SEM) and analyzed using Student’s t-test. *p < 0.05, **p < 0.01 or ***p < 0.001 compared to control (n = 3). P, pyronaridine; A, artesunate.
FIGURE 6
FIGURE 6
Effects of the mixture tested considering unbound concentration on cardiac ionic currents in CHO cells. (A–D) Representative traces of ionic currents demonstrating the effect of the mixture on Peak Nav1.5 (A), Late Nav1.5 (B), Cav1.2 (C), and hERG (D) with pyronaridine concentrations of 13.2, 26.4, 39.6, and 52.8 nM and artesunate concentrations of 10.4, 20.8, 31.2, and 41.6 nM, respectively (left). Concentration-response relationship for each ionic current (right). Data are presented as mean ± standard error of the mean (SEM) and analyzed using Student’s t-test. *p < 0.05, **p < 0.01 or ***p < 0.001 compared to control (n = 3). P, pyronaridine; A, artesunate.
FIGURE 7
FIGURE 7
Hill curve for dosage-to-response for pyronaridine on INa (A), pyronaridine on INaL (B), pyronaridine on ICaL (C), pyronaridine on IKr (D). Experimental data points for each cell by circles. 95% confidence interval of the fitting on the gray shaded area. Within each panel, the solid red line was fitted using the best parameter of the half-maximal inhibitory concentration (IC50) and Hill coefficient from the nonlinear least square method, whereas the solid black line was the median value from Markov chain Monte Carlo (MCMC) sampling.
FIGURE 8
FIGURE 8
Distribution of the torsade metric score (TMS) for drugs using the optimized ORd model. Drugs are sorted based on the mean of TMS in each dataset. (A) Threshold 1 and threshold 2 were calculated using logistic regression to classify the TdP risk categories (red for high risk, blue for intermediate risk, green for low risk) using CiPA 12 training set drugs. Threshold 1 (separating low from intermediate/high risk) has a value of 0.0573 μC/μF, and threshold 2 (separating high from intermediate/low risk) has a value of 0.0492 μC/μF. (B) The drugs tested considering Cmax are represented by solid black circle clusters, while drugs tested considering unbound concentration are represented by solid black triangle clusters.
FIGURE 9
FIGURE 9
Effects of pyronaridine on action potential (AP) parameters of hiPSC-CMs. (A) Typical AP traces of hiPSC-CMs in the control and after exposure to 13.2, 132, 396, and 1,320 nM pyronaridine. (B–F) Bar graphs illustrating mean normalized values for AP parameters of hiPSC-CMs, including MDP, maximal diastolic potential; APA, AP amplitude; Vmax, maximum rate of depolarization during the upstroke of the AP; APD50 and APD90, AP duration at 50% and 90%. Data are presented as mean ± standard error of the mean (SEM) and analyzed using Student’s t-test. *p < 0.05, **p < 0.01 or ***p < 0.001 compared to control (n = 3).
FIGURE 10
FIGURE 10
Effects of artesunate on action potential (AP) parameters of hiPSC-CMs. (A) Typical AP traces of hiPSC-CMs in the control and after exposure to 780, 7,800, 23,400, and 78,000 nM artesunate. (B–F) Bar graphs illustrating mean normalized values for AP parameters of hiPSC-CMs, including MDP, maximal diastolic potential; APA, AP amplitude; Vmax, maximum rate of depolarization during the upstroke of the AP; APD50 and APD90, AP duration at 50% and 90%. Data are presented as mean ± standard error of the mean (SEM) and analyzed using Student’s t-test. *p < 0.05, **p < 0.01 or ***p < 0.001 compared to control (n = 3).
FIGURE 11
FIGURE 11
Effects of DHA on action potential (AP) parameters of hiPSC-CMs. (A) Typical AP traces of hiPSC-CMs in the control and after exposure to 4,200, 42,000, 126,000 and 420,000 nM DHA. (B–F) Bar graphs illustrating mean normalized values for AP parameters of hiPSC-CMs, including MDP, maximal diastolic potential; APA, AP amplitude; Vmax, maximum rate of depolarization during the upstroke of the AP; APD50 and APD90, AP duration at 50% and 90%. Data are presented as mean ± standard error of the mean (SEM) and analyzed using Student’s t-test. *p < 0.05, **p < 0.01 or ***p < 0.001 compared to control (n = 3).
FIGURE 12
FIGURE 12
Effects of the mixture on action potential (AP) parameters of hiPSC-CMs. (A) Typical AP traces of hiPSC-CMs in the control and after exposure to 13.2, 132, 396, and 1,320 nM pyronaridine and 10.4, 104, 312, and 1,040 nM artesunate. (B–F) Bar graphs illustrating mean normalized values for AP parameters of hiPSC-CMs, including MDP, maximal diastolic potential; APA, AP amplitude; Vmax, maximum rate of depolarization during the upstroke of the AP; APD50 and APD90, AP duration at 50% and 90%. Data are presented as mean ± standard error of the mean (SEM) and analyzed using Student’s t-test. *p < 0.05, **p < 0.01 or ***p < 0.001 compared to control (n = 3). P, pyronaridine; A, artesunate.

Similar articles

References

    1. Authier S., Pugsley M. K., Koerner J. E., Fermini B., Redfern W. S., Valentin J.-P., et al. (2017). Proarrhythmia liability assessment and the comprehensive in vitro proarrhythmia assay (CiPA): an industry survey on current practice. J. Pharmacol. Toxicol. Methods 86, 34–43. 10.1016/j.vascn.2017.02.021 - DOI - PubMed
    1. Bae J.-Y., Lee G. E., Park H., Cho J., Kim Y.-E., Lee J.-Y., et al. (2020). Pyronaridine and artesunate are potential antiviral drugs against COVID-19 and influenza, 2020 2007 2028.225102 bioRxiv. 10.1101/2020.07.28.225102 - DOI
    1. Borba M. G. S., Val F. F. A., Sampaio V. S., Alexandre M. a. A., Melo G. C., Brito M., et al. (2020). Effect of high vs low doses of chloroquine diphosphate as adjunctive therapy for patients hospitalized with severe acute respiratory syndrome coronavirus 2 (SARS-CoV-2) infection: a randomized clinical trial. JAMA Netw. Open. 3, e208857. 10.1001/jamanetworkopen.2020.8857 - DOI - PubMed
    1. Borsini F., Crumb W., Pace S., Ubben D., Wible B., Yan G.-X., et al. (2012). In vitro cardiovascular effects of dihydroartemisin-piperaquine combination compared with other antimalarials. Antimicrob. Agents Chemother. 56, 3261–3270. 10.1128/aac.05688-11 - DOI - PMC - PubMed
    1. Cavero I., Crumb W. (2005). ICH S7B draft guideline on the non-clinical strategy for testing delayed cardiac repolarisation risk of drugs: a critical analysis. Expert Opin. Drug Saf. 4, 509–530. 10.1517/14740338.4.3.509 - DOI - PubMed