[Preprint]. 2023 Aug 8:2023.08.03.23293450.
doi: 10.1101/2023.08.03.23293450.

Personalized chronic adaptive deep brain stimulation outperforms conventional stimulation in Parkinson's disease

Affiliations

Personalized chronic adaptive deep brain stimulation outperforms conventional stimulation in Parkinson's disease

Carina R Oehrn et al. medRxiv. .

Update in

Abstract

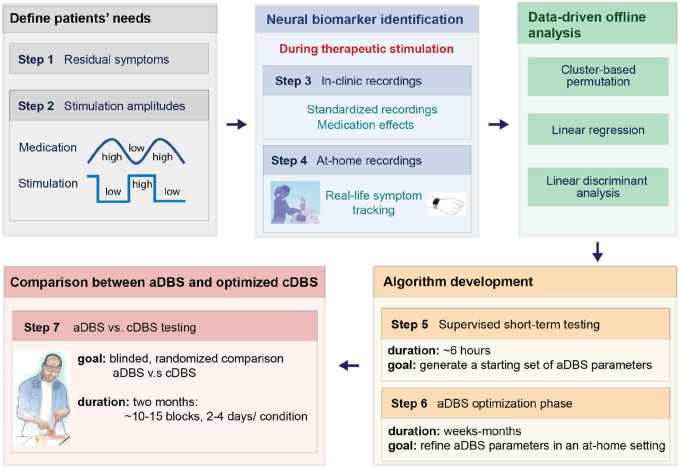
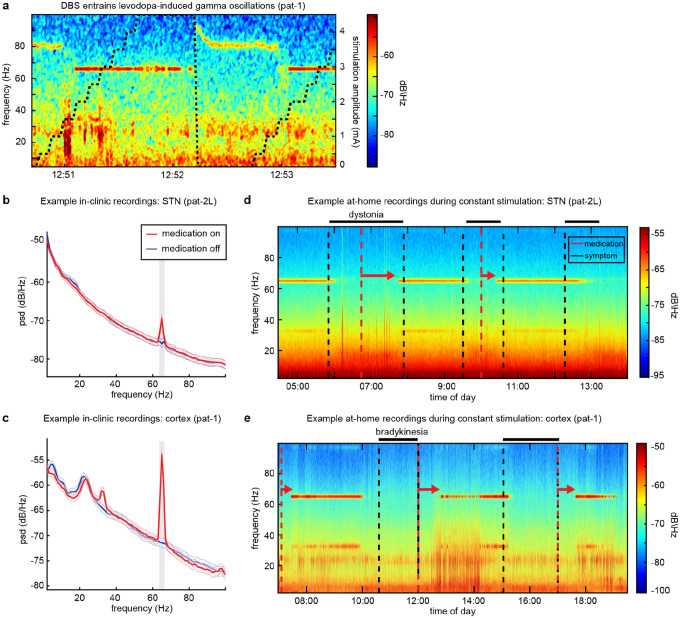
Deep brain stimulation is a widely used therapy for Parkinson's disease (PD) but currently lacks dynamic responsiveness to changing clinical and neural states. Feedback control has the potential to improve therapeutic effectiveness, but optimal control strategy and additional benefits of "adaptive" neurostimulation are unclear. We implemented adaptive subthalamic nucleus stimulation, controlled by subthalamic or cortical signals, in three PD patients (five hemispheres) during normal daily life. We identified neurophysiological biomarkers of residual motor fluctuations using data-driven analyses of field potentials over a wide frequency range and varying stimulation amplitudes. Narrowband gamma oscillations (65-70 Hz) at either site emerged as the best control signal for sensing during stimulation. A blinded, randomized trial demonstrated improved motor symptoms and quality of life compared to clinically optimized standard stimulation. Our approach highlights the promise of personalized adaptive neurostimulation based on data-driven selection of control signals and may be applied to other neurological disorders.


Figures

Figure 1.
Figure 1.. Configuration of implanted hardware, algorithmic model and patient demographics.
a, Illustration of the adaptive paradigm starting with real-life sensing of brain activity (blue) that reflects changes in patient’s mobility–in this example slowness of movement (bradykinesia). Neural activity is sensed continuously on-board the DBS device from either the STN or sensorimotor cortex using depth or subdural electrodes, respectively. Here, we illustrate an example of a cortical control signal for fully-embedded adaptive implementation. Once a change in the brain signal across a predefined threshold is detected (green), the stimulation amplitude increases or decreases automatically (red) at the target brain region (STN). This adaptation of stimulation amplitude to the patient’s needs leads to improved symptoms–in this example, increased stimulation amplitude results in faster movement. b, Localization of depth leads in the STN with active contacts colored in red across patients in normalized Montreal Neurological Institute space. STN is highlighted in orange and the red nucleus in red. c, Patient characteristics including pre- and post-surgery levodopa equivalent daily dose (LEDD, mg) and residual motor fluctuations on clinically optimized cDBS, including the body side, the most bothersome symptom and the “opposite” symptom, referring to the opposite medication state, such as hyperkinetic symptoms for hypokinetic bothersome symptoms, or effects of DBS that limit the therapeutic window (e.g., effects on speech).
Figure 2.
Figure 2.. Workflow for data-driven biomarker identification and aDBS implementation.
We employed a workflow consisting of seven steps. These steps involved identifying bothersome symptoms and required stimulation amplitudes for symptom control for each patient (steps 1 and 2), in-clinic and at-home neural recordings with simultaneous symptom monitoring for biomarker identification (steps 3–4) and refining parameters for patient-tailored adaptive algorithms using supervised short-term (step 5) and long-term (step 6) at-home testing. The workflow culminated in blinded, randomized comparisons between cDBS and aDBS in multiple blocks of 2–4 days per condition (total of one month per condition) in patients’ real-life environments (step 7).
Figure 3.
Figure 3.. Examples of stimulation-entrained finely-tuned gamma oscillations in both in-clinic and at-home recordings.
a, Example spectrogram of cortical activity in the on-medication state during systematic variations in stimulation amplitude (black dotted line), illustrating the phenomenon of stimulation-induced entrainment of gamma oscillations at half of the stimulation frequency (pat-1). Levodopa-induced finely-tuned gamma (FTG) oscillations occur at 80–90 Hz when stimulation amplitudes are low but become entrained to half the stimulation frequency (65 Hz) when stimulation exceeds a certain amplitude (1.5 mA in this example). b-c, Examples of biomarker identification using standardized in-clinic neural recordings (b, pat-2L, c, pat-1). Plots show power spectra during on- and off-levodopa states (mean±standard error of the mean), i.e., periods during which hyper- and hypokinetic symptoms would emerge, respectively. Recordings are collapsed across low and high stimulation amplitude conditions, which were both amplitudes at which FTG entrained to half the stimulation frequency. We found that medication yielded the largest effect on entrained finely-tuned gamma power at half the stimulation frequency in the STN (b, pat-2L) and motor cortex (c, pat-1) when controlling for effects of stimulation (Extended Data Fig. 2). Significant clusters are highlighted in gray. d-e, At-home recordings during constant stimulation amplitude and patients’ normal medication schedule in the STN (d, pat-2L) and motor cortex (e, pat-1). Patients marked their medication intake (red dashed line) and on- and off-set of their most bothersome symptom in their motor diary (completed in 30-minute intervals) and the streaming application. Both patients had bothersome off-state symptoms, lower limb-dystonia (d, pat-2) and bradykinesia (e, pat-1). For both, FTG oscillations occur ~45 minutes after medication intake (red arrows), corresponding to a typical latency of onset for dopaminergic medication. When the patient marked their most bothersome symptom (indicated by the black dashed line) in their motor diary, FTG oscillations disappeared, indicating a transition to an off-medication state.
Figure 4.
Figure 4.. Data-driven biomarker identification for all hemispheres.
a-b, Results of the within-subject nonparametric cluster-based permutation analysis for in-clinic recordings. a, Graphs illustrate the effect size (Cohen’s d) of the main effect of medication on power as a function of frequency in the STN (left), cortical montage 1 (middle), and cortical montage 2 (right) for all patients. Red and blue colors represent positive effects (medication on > medication off) and negative effects (medication off > medication on), respectively. For all patients, we found finely-tuned gamma (FTG) oscillations in the STN (pat-2, both hemispheres) and cortex (pat-1, left hemisphere and pat-3, right hemisphere) to be the optimal biomarker for medication-related fluctuations during active stimulation (Extended Data Fig. 2). We did not find any significant effects in the left hemisphere of pat-3. b, The effect sizes for cortical and STN FTG oscillations (right) were superior to those for STN beta oscillations (left) for all patients (mean±standard error of the mean across permutations). c-e, Results of the within-subject linear discriminant analysis for at-home recordings using power spectral density at the three brain sites to predict the occurrence of the most bothersome symptom. c, The three graphs illustrate the initial area under the curve (AUC) prior to bandwidth optimization as a function of frequency for the STN (left), cortical montage 1 (middle), and cortical montage 2 (right) for all patients. Across patients, we show that FTG oscillations in the STN (pat-2, both hemispheres) and cortex (pat-1, left hemisphere and pat-3, both hemispheres) were the best predictors of the occurrence of the most bothersome symptom and superior to beta oscillations (d, mean±standard error of the mean across permutations, Extended Data Fig. 3). e, The combined use of STN/cortical gamma and STN beta bands provided minimal improvement in the AUC of at-home symptom prediction using linear discriminant analysis (mean±standard error of the mean across permutations).
Figure 5.
Figure 5.. Characteristics and technical performance of adaptive DBS algorithms.
a, Summary of the final stimulation parameters used for blinded, randomized comparisons between stimulation conditions including the control signal for aDBS. All parameters but stimulation amplitude were identical between cDBS and aDBS. b-c, Examples of two control algorithms using subthalamic (b, pat-2R) and cortical (c, pat-1) finely-tuned gamma oscillations at half the stimulation frequency as control signals. In each graph, the upper subplot illustrates the control signal as a function of time with thresholds (black) that are used to determine changes in stimulation amplitude. The lower subpanel illustrates the stimulation amplitudes responding to fluctuations in the neural signal. In all patients, we used an on-state biomarker, such that stimulation amplitude decreases when the biomarker amplitude exceeds a threshold. Timing of dopaminergic medication intake is marked by dashed red vertical lines. d,e, Dynamics of algorithm performance showing adaptive changes on a time course of minutes-hours. d, Daily percent time spent at each stimulation amplitude. e, Average duration of each stimulation amplitude state in a day. Each dot represents one day of aDBS testing. Pat-3’s left hemisphere’s state in the high amplitude has three outliers not currently plotted which include 4.32, 5.15, and 7.32 hours. f, Mean (± standard error of the mean) total electrical energy delivered (TEED) during aDBS and cDBS, showing increased TEED throughout aDBS in all patients during the day.
Figure 6.
Figure 6.. Effects of aDBS compared to cDBS on both subjective and objective metrics of motor symptoms and quality of life.
a-b, Self-reported symptom duration from daily questionnaires. a, aDBS resulted in a significantly decreased percentage of awake hours experiencing the most bothersome symptom (each patient p<0.001). b, Even while reducing time with the most bothersome motor symptom, aDBS resulted in either no significant change (pat-1: p=0.56, pat-2: p=1) or an improvement (pat-3: p=0.02) in the percentage of awake hours experiencing the opposite symptom. c, Quality of life, as measured by the EQ-5D, was improved for two of three patients (pat-1 and pat-2: p<0.001). The third patient reported very high quality of life scores, with minimal reported variance for both cDBS and aDBS. d-e, Wearable monitor scores demonstrating the decreases in symptom intensity fluctuations. Only patients 1 and 3 are displayed, as patient 2’s bothersome and opposite symptoms were not measurable by a wearable device. Laterality refers to the brain hemisphere where aDBS was applied (and therefore contralateral motor sign measurement). d, Fluctuation scores represent differences between wearable scores during hypo- and hyperkinetic states defined by the neural signal. Fluctuations were reduced during aDBS compared to cDBS, representing a stabilized clinical profile throughout the day (pat-1: p<0.001, pat-3R: p=0.005, pat-3L: p=0.046). e, Similar improvements in the dyskinesia fluctuation score were seen in two of three hemispheres with aDBS (pat-1: p=0.04, pat-3R: p=0.03). Error bars reflect standard error of the mean.

References

    1. Lozano A. M. et al. Deep brain stimulation: current challenges and future directions. Nat. Rev. Neurol. 15, 148–160 (2019). - PMC - PubMed
    1. Neumann W.-J., Gilron R., Little S. & Tinkhauser G. Adaptive Deep Brain Stimulation: From Experimental Evidence Toward Practical Implementation. Mov. Disord. Off. J. Mov. Disord. Soc. (2023) doi:10.1002/mds.29415. - DOI - PubMed
    1. Marceglia S. et al. Deep brain stimulation: is it time to change gears by closing the loop? J. Neural Eng. 18, (2021). - PubMed
    1. Stanslaski S. et al. Design and validation of a fully implantable, chronic, closed-loop neuromodulation device with concurrent sensing and stimulation. IEEE Trans. Neural Syst. Rehabil. Eng. Publ. IEEE Eng. Med. Biol. Soc. 20, 410–421 (2012). - PubMed
    1. Stanslaski S. et al. A Chronically Implantable Neural Coprocessor for Investigating the Treatment of Neurological Disorders. IEEE Trans. Biomed. Circuits Syst. 12, 1230–1245 (2018). - PMC - PubMed

Publication types