. 2023 Aug 15:17:1238349.
doi: 10.3389/fnbeh.2023.1238349. eCollection 2023.

Sex- and age-dependent contribution of System xc- to cognitive, sensory, and social behaviors revealed by comprehensive behavioral analyses of System xc- null mice

Affiliations

Sex- and age-dependent contribution of System xc- to cognitive, sensory, and social behaviors revealed by comprehensive behavioral analyses of System xc- null mice

Carla Frare et al. Front Behav Neurosci. .

Abstract

Background: System xc- (Sxc-) is an important heteromeric amino acid cystine/glutamate exchanger that plays a pivotal role in the CNS by importing cystine into cells while exporting glutamate. Although certain behaviors have been identified as altered in Sxc- null mutant mice, our understanding of the comprehensive impact of Sxc- on behavior remains incomplete.

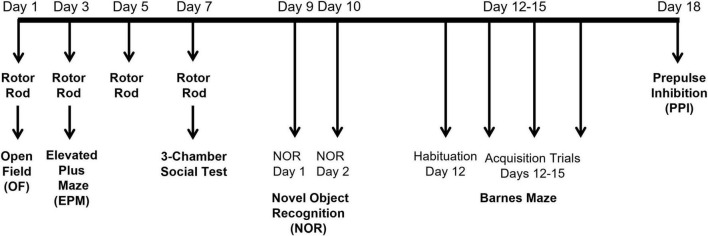
Methods: To address this gap, we compared motor, sensory and social behaviors of male and female mice in mice null for Sxc- (SLC7A11sut/sut) with wildtype littermates (SLC7A11+/+) in a comprehensive and systematic manner to determine effects of genotype, sex, age, and their potential interactions.

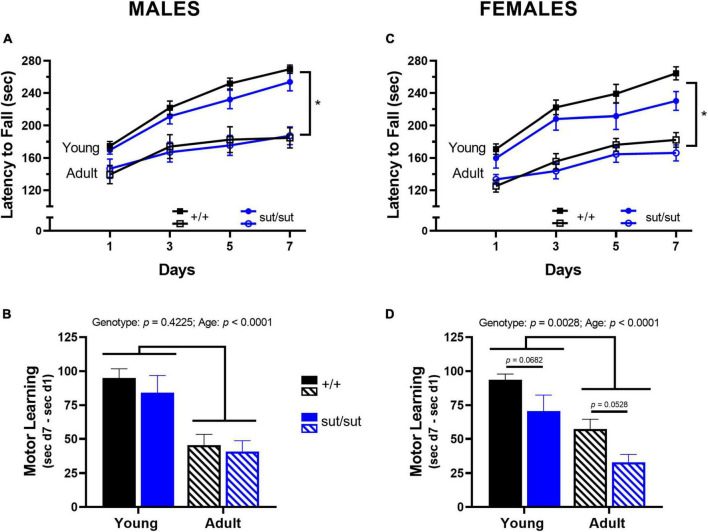
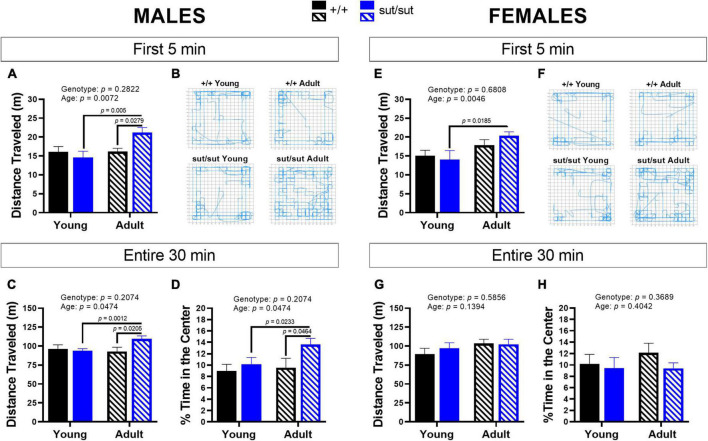
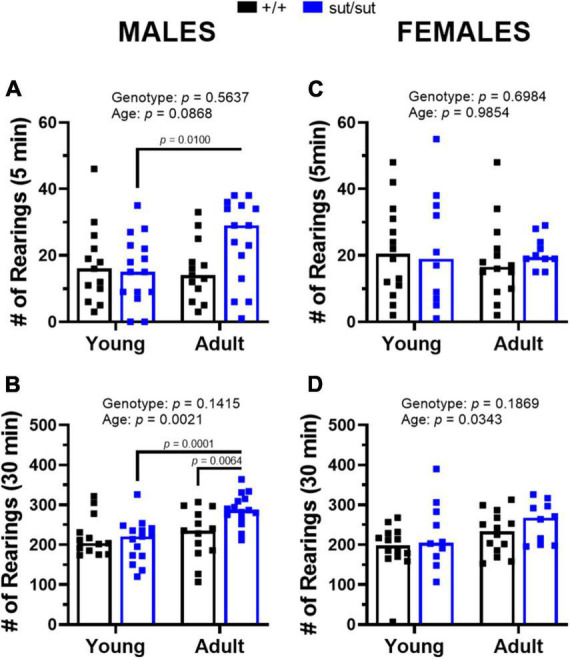
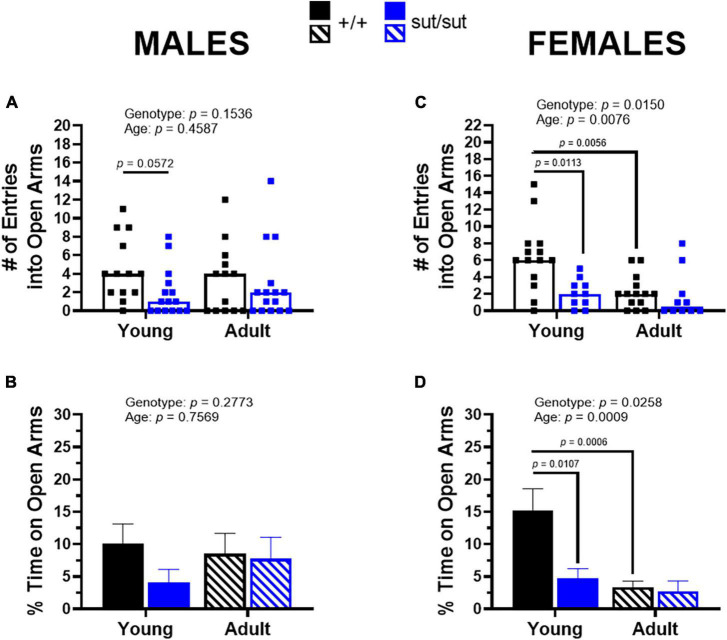
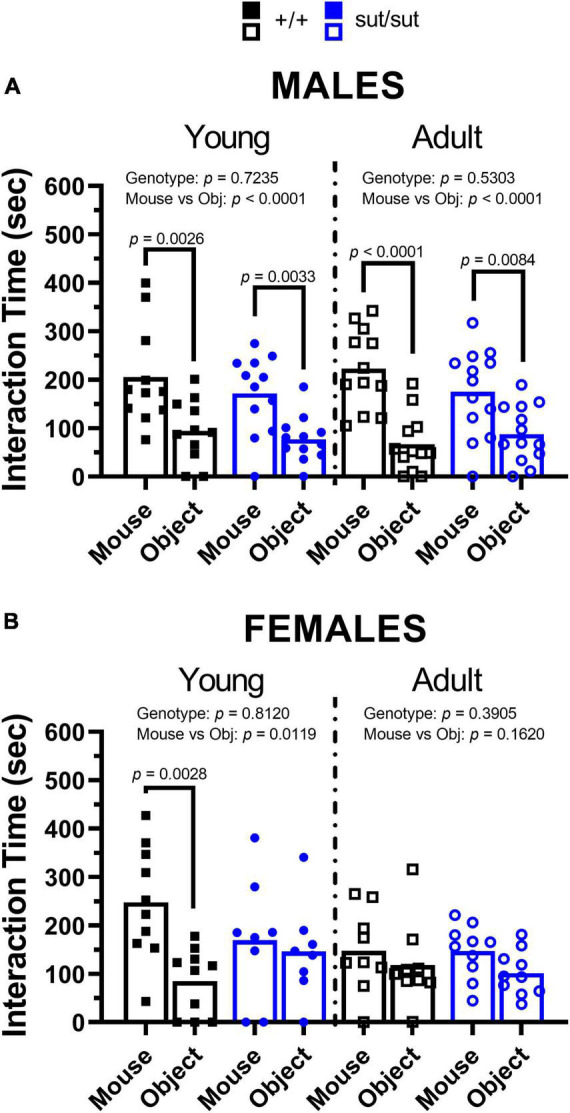
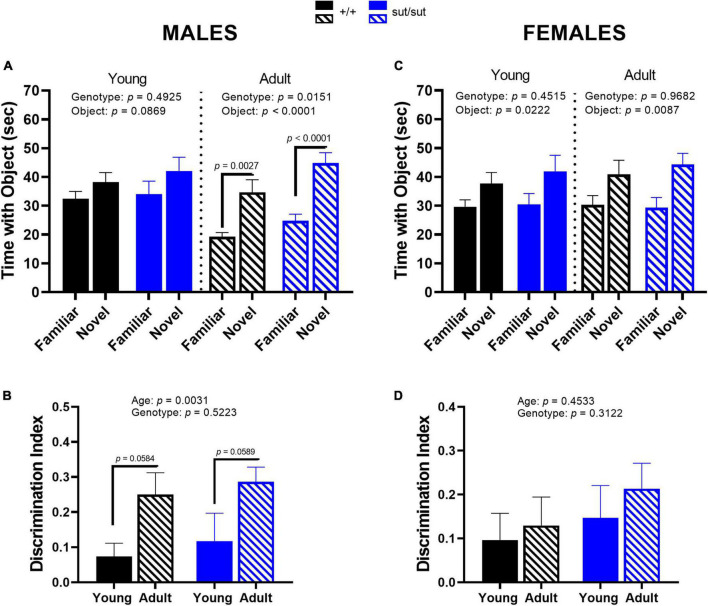
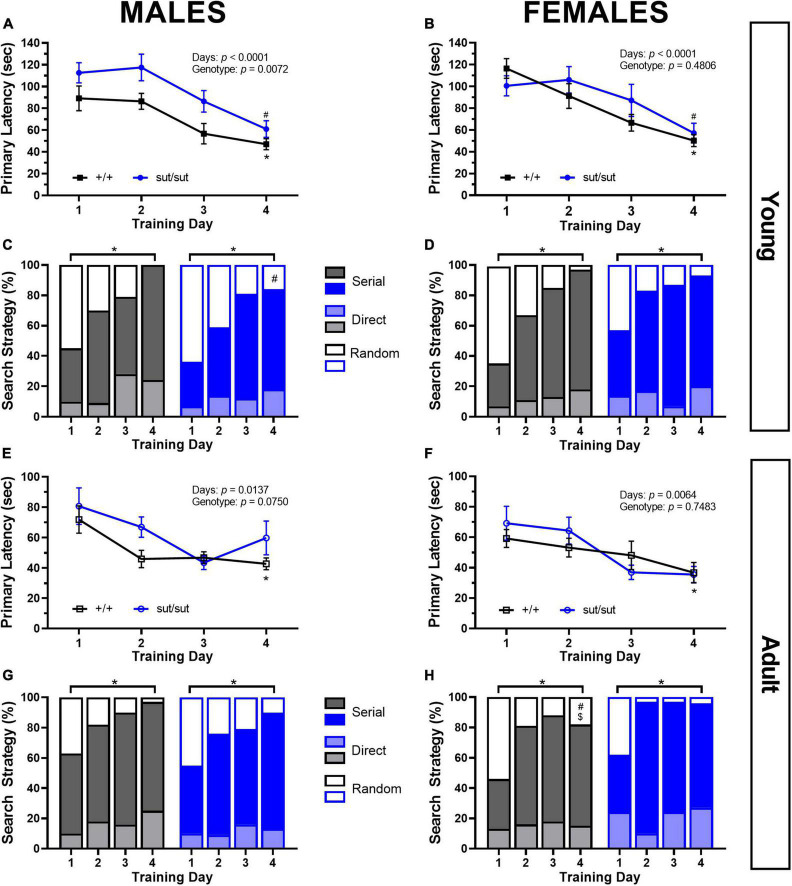
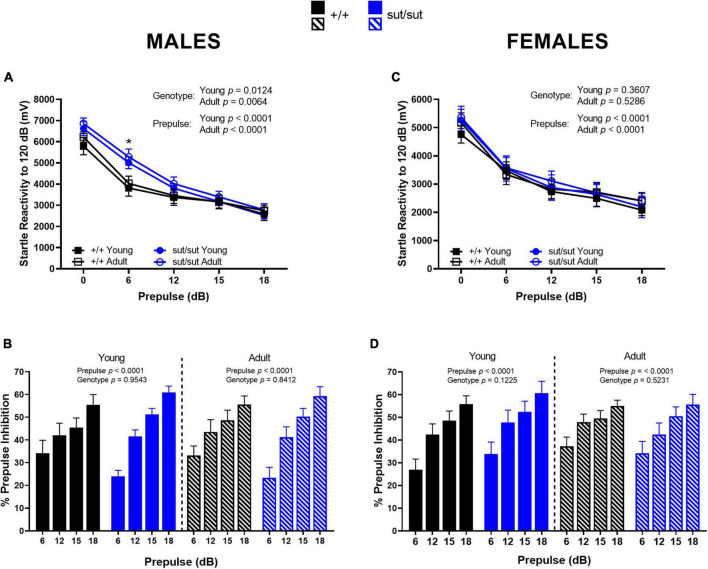
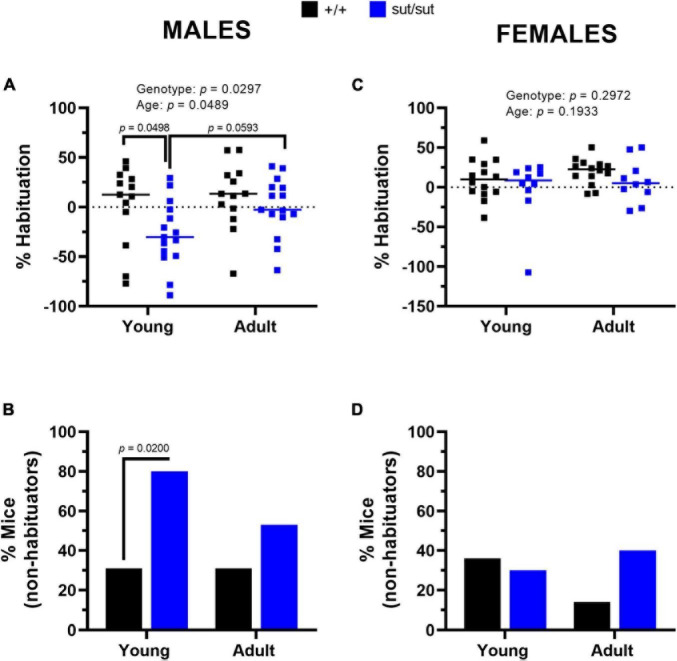
Results: Motor performance was not affected by loss of Sxc- in both males and females, although it was impacted negatively by age. Motor learning was specifically disrupted in female mice lacking Sxc- at both 2 and 6 months of age. Further, female SLC7A11sut/sut mice at both ages exhibited impaired sociability, but normal spatial and recognition memory, as well as sensorimotor gating. Finally, pronounced open-space anxiety was displayed by female SLC7A11sut/sut when they were young. In contrast, young SLC7A11sut/sut male mice demonstrated normal sociability, delayed spatial learning, increased open-space anxiety and heightened sensitivity to noise. As they aged, anxiety and noise sensitivity abated but hyperactivity emerged.

Discussion: We find that the behavioral phenotypes of female SLC7A11sut/sut are similar to those observed in mouse models of autism spectrum disorder, while behaviors of male SLC7A11sut/sut resemble those seen in mouse models of attention deficit hyperactivity disorder. These results underscore the need for further investigation of SLC7A11 in neurodevelopment. By expanding our understanding of the potential involvement of Sxc-, we may gain additional insights into the mechanisms underlying complex neurodevelopmental conditions.

Keywords: C3H/HeSnJ; anxiety; attention deficit hyperactivity disorder; autism spectrum disorder; motor function; recognition memory; sensorimotor gating; spatial memory.


Conflict of interest statement

The authors declare that the research was conducted in the absence of any commercial or financial relationships that could be construed as a potential conflict of interest.

Figures

FIGURE 1
FIGURE 1
Timeline of the behavioral tests: Each mouse completed a battery of behavioral tests over 18 days in the following order: rotor rod, open field, elevated plus maze, three-chamber social interaction test, novel object recognition test, Barnes maze and pre-pulse inhibition of the acoustic startle response. The time between tests performed on the same day was at least 4 h.
FIGURE 2
FIGURE 2
Rotor rod performance. Male (A,B) or Female (C,D) SLC7A11+/+ (+ / + , n = 13M:14F, black) and SLC7A11sut/sut (sut/sut, n = 15M:10F, blue) littermates were tested on the accelerating rotor rod at 2 (young) or 6 months (adult). Motor performance is measured as latency to fall across days and plotted as mean ± SEM. Motor learning is defined as difference in latency to fall at day 7 (d7) vs day 1 (d1) and plotted as mean + SEM. All data were analyzed via MMRM ANOVA followed by Bonferroni’s multiple comparisons test. No within genotype sex differences were found. (A) Performance in males increased across the testing days but did not differ between genotypes at either age: Young: F(2.174, 56.51) = 75.87, p < 0.0001, testing days; F(1, 26) = 1.921, p = 0.1775, genotype; F(3, 78) = 0.5327, p = 0.6612, interaction; Adult: F(2.200, 57.19) = 23.75, p < 0.0001, testing days; F(1, 26) = 0.0037, p = 0.9518, genotype; F(3, 78) = 0.8511, p = 0.4702, interaction. *Age negatively affected performance in both genotypes +/+ : F(1, 12) = 27.49, p = 0.0002 for age; sut/sut: F(1,14) = 16.75, p = 0.0011 for age. (B) Motor learning in males was negatively affected by age independent of genotype: F(1,26) = 0.6641, p = 0.4225, genotype; F(1, 26) = 25.50, p < 0.0001, age; F(1,26) = 0.1138, p = 0.7385, interaction (young vs adult: p = 0.0021 for +/+ , p = 0.0038, for sut/sut) (+ / + vs sut/sut: p = 0.8298 for young; p > 0.9999 for adult). (C) Performance in females increased across the testing days but did not differ between genotypes at either age: Young: F(2.633, 57.92) = 49.50, p < 0.0001, testing days; F(1, 22) = 2.689, p = 0.1153, genotype; F(3, 66) = 1.241, p = 0.3018, interaction; Adult: F(2.709, 59.60) = 37.16, p < 0.0001, testing days; F(1, 22) = 0.4923, p = 0.4902, genotype; F(3, 66) = 2.571, p = 0.0616, interaction. *Age negatively affected performance of mice of both genotypes: +/+ : F(1, 15) = 50.80, p < 0.0001 for age; sut/sut: F(1,11) = 13.57, p = 0.0036 for age. (D) Motor learning in females was negatively affected by age in both genotypes: F(1,44) = 10.06, p = 0.0028, genotype; F(1, 44) = 24.48, p < 0.0001, age; F(1,44) = 0.0061, p = 0.9379, interaction (young vs adult: p = 0.0010 for +/+ ; p = 0.0040 for sut/sut) with additional impairment in learning evident in both young and adult sut/sut mice as compared to their age-matched +/+ littermates (+ / + vs sut/sut: p = 0.0682 for young, p = 0.0528 for adult).
FIGURE 3
FIGURE 3
Open field activity. Male (A–D) or Female (E–H) SLC7A11+/+ (+ / + , n = 13M:14F, black bars) and SLC7A11sut/sut (sut/sut, n = 15M:10F, blue bars) littermates were tested at 2 (young) or 6 months (adult). Ambulatory movement (distance traveled), central and peripheral activity (% time in center) of individual mice were measured. Data are plotted as mean + SEM and analyzed using MMRM ANOVA followed by the Bonferroni’s multiple comparisons test. No within genotype sex differences were found. (A) Distance traveled by males (5 min): F(1,26) = 8.520, p = 0.0072, age; F(1,26) = 1.206, p = 0.2822, genotype; F(1,26) = 8.078, p = 0.0086, interaction. (+ / + vs sut/sut: p = 0.9056 for young; p = 0.0279 for adult) (young vs adult: p = 0.0005 for sut/sut; p > 0.9999 for + / +). (B) Paths. Representative activity in of the first 5 min in the open filed by the same male mice at 2 (young) and 6 months (old). (C) Distance traveled by males (30 min): F(1, 26) = 4.333, p = 0.0474 age; F(1, 26) = 1.672, p = 0.2074, genotype; F(1, 26) = 10.4, p = 0.0034, interaction. (+ / + vs sut/sut: p > 0.9999 for young; p = 0.0205 for adult) (young vs adult: p = 0.0012 for sut/sut; p = 0.8836 for + / +). (D)% time in the center (30 min) – males: F(1, 26) = 3.513, p = 0.0722, age; F(1, 26) = 2.837 p = 0.1041, genotype; F(2,26) = 3.330, p = 0.0796, interaction. (+ / + vs sut/sut: p > 0.9999 for young; p = 0.0464 for adult) (young vs adult: p = 0.0233 for sut/sut; p > 0.9999 for + / +). (E) Distance traveled by females (5 min): F(1,22) = 9.944, p = 0.0046, age; F(1,22) = 0.1738, p = 0.6808, genotype; F(1,22) = 1.450, p = 0.2412, interaction. (+ / + vs sut/sut: p > 0.9999 for young; p = 0.5801 for adult) (young vs adult: p = 0.0185, for sut/sut; p = 0.2907 for + / +). (F) Paths. Representative activity in of the first 5 min in the open filed by the same female mice at 2 (young) and 6 months (old). (G) Distance traveled by females (30 min): F(1,22) = 2.352, p = 0.1394, age; F(1,22) = 0.3062, p = 0.5856, genotype; F(1,22) = 0.7756, p = 0.3880, interaction. (+ / + vs sut/sut: p = 0.6685 for young; p > 0.9999 for adult) (young vs adult: p > 0.9999 for sut/sut; p = 0.1497 for + / +). (H)% time in the center (30 min) – females: F(1, 22) = 0.7235, p = 0.4042, age; F(1, 22) = 0.8414, p = 0.3689, genotype; F(2, 22) = 0.3583, p = 0.5555, interaction. (+ / + vs sut/sut: p > 0.9999 for young; p = 0.5748 for adult) (young vs adult: p > 0.9999 for sut/sut; p = 0.5475 for + / +).
FIGURE 4
FIGURE 4
Rearings behavior in the open field. Male (A,B) or Female (C,D) SLC7A11+/+ (+ / + , n = 13M:14F, black bars) and SLC7A11sut/sut (sut/sut, n = 15M:10F, blue bars) littermates were tested at 2 (young) or 6 months (adult). Each data point representing an individual animal is graphed with the median number of rearings reflected by horizontal line of the bar. Following transformation, data were analyzed using MMRM ANOVA followed by the Bonferroni’s multiple comparisons test. No within genotype sex differences were found. (A) Male rearings (5 min): F(1,26) = 3.167, p = 0.0868, age; F(1,26) = 0.3420, p = 0.5637, genotype; F(1,26) = 5.770, p = 0.0237, interaction. (+ / + vs sut/sut: p > 0.9999 for young; p = 0.2235 for adult) (young vs adult: p = 0.0100 for sut/sut; p > 0.9999 for + / +). (B) Male rearings (30 min): F(1,26) = 11.67, p = 0.0021, age; F(1,26) = 2.299, p = 0.1415, genotype; F(1,26) = 10.15, p = 0.0037, interaction. (+ / + vs sut/sut: p > 0.9999 for young; p = 0.0064 for adult) (young vs adult: p = 0.0001 for sut/sut; p > 0.9999 for + / +). (C) Female rearings (5 min): F(1,22) = 0.0003, p = 0.9854, age; F(1,22) = 0.1541, p = 0.6984, genotype; F(1,22) = 0.6836, p = 0.4172, interaction. (+ / + vs sut/sut: p > 0.9999 for young; p = 0.8850 for adult) (young vs adult: p > 0.9999 for sut/sut; p > 0.9999 for + / +). (D) Females rearings (30 min): F(1,22) = 5.094 p = 0.0343, age; F(1,22) = 1.856, p = 0.1869, genotype; F(1,22) = 0.1047, p = 0.7494, interaction. (+ / + vs sut/sut: p = 0.4098 for young; p = 0.7448 for adult) (young vs adult: p = 0.4376 for sut/sut; p = 0.1162 for + / +).
FIGURE 5
FIGURE 5
Elevated plus maze. Male (A,B) or Female (C,D) SLC7A11+/+ (+ / + , n = 13M:14F, black) and SLC7A11sut/sut (sut/sut, n = 15M:10F, blue) littermates were tested at 2 (young) or 6 months (adult). Each data point representing an individual animal is graphed with the median number of entries reflected by horizontal line of the bar. The% time spent on the open arms is graphed as mean + SEM. Following transformation, data were analyzed via MMRM ANOVA followed by Bonferroni’s multiple comparisons test. No within genotype sex differences were found. (A) Number of entries — males: F(1, 26) = 2.160, p = 0.1536, genotype; F(1, 26) = 0.5658, p = 0.4587, age; F(1, 26) = 3.933, p = 0.0580, interaction. (+ / + vs sut/sut: p = 0.0572 for young; p > 0.9999 for adult) (young vs adult: p = 0.1460 for +/+ ; p = 0.7493 for sut/sut). (B)% time on open arms — males: F(1, 26) = 1.231, p = 0.2773, genotype; F(1, 26) = 0.09789, p = 0.7569, age; F(1, 26) = 3.514, p = 0.0721, interaction. (+ / + vs sut/sut: p = 0.1489 for young; p > 0.9999 for adult) (young vs adult: p = 0.5917 for +/+ ; p = 0.2411 for sut/sut). (C) Number of entries — females: F(1, 22) = 6.967, p = 0.0150, genotype; F(1, 22) = 8.620, p = 0.0076, age; F(1, 22) = 1.979, p = 0.1734, interaction. (+ / + vs sut/sut: p = 0.0113 for young; p = 0.6044 for adult) (young vs adult: p = 0.0056 for +/+ ; p = 0.6554 for sut/sut). (D)% time on open arms — females: F(1, 22) = 5.716, p = 0.0258 genotype; F(1, 22) = 14.81. p = 0.0009, age; F(1, 22) = 2.891, p = 0.1031, interaction. (+ / + vs sut/sut: p = 0.0107 for young; p = 0.8191 for adult) (young vs adult: p = 0.0006 for +/+ ; p = 0.3473 for sut/sut).
FIGURE 6
FIGURE 6
3-chamber social test. Male (A) or Female (B) SLC7A11+/+ and SLC7A11sut/sut littermates were tested at 2 (young) [ +/+ , n = 11M:10F, black; sut/sut, n = 12M:8F, blue] and at 6 months (adult) [ +/+ , n = 13M:9F, black; sut/sut, n = 13M:10F, blue]. Each data point representing an individual animal is graphed with the mean interaction time reflected by horizontal line of the bar. Data were analyzed within each age group by two-way ANOVA followed by Bonferroni’s multiple comparisons test. (A) Time interacting with mouse vs object in males: Young: F(1, 42) = 20.78, p < 0.0001, mouse/object; F(1, 42) = 1.247, p = 0.2705, genotype; F(1, 42) = 0.1268, p = 0.7235, interaction. (mouse vs object: p = 0.0026 for +/+ , p = 0.0033 for sut/sut). Adult: F(1, 46) = 33.63, p < 0.0001, mouse/object; F(1, 46) = 0.3998, p = 0.5303, genotype; F(1, 46) = 2.644, p = 0.1108, interaction. (mouse vs object: p < 0.0001 for +/+ , p = 0.0084 for sut/sut). (B) Time interacting with mouse vs object in females: Young: F(1, 32) = 7.113, p = 0.0119, mouse/object; F(1, 32) = 0.0575, p = 0.8120, genotype; F(1, 32) = 3.995, p = 0.0542, interaction. (mouse vs object: p = 0.0028 for +/+ , p > 0.9999 for sut/sut). Adult: F(1, 34) = 2.043, p = 0.1620, mouse/object; F(1, 34) = 0.7565, p = 0.3905, genotype; F(1, 34) = 0.1070, p = 0.7456, interaction. (mouse vs object: p = 0.9054 for +/+ , p = 0.4212 for sut/sut).
FIGURE 7
FIGURE 7
Novel object recognition. Male (A,B) or Female (C,D) SLC7A11+/+ and SLC7A11sut/sut littermates were tested at 2 (young) [ +/+ , n = 13M:14F, black; sut/sut, n = 14M:10F, blue] and at 6 months (adult) [ +/+ , n = 13M:14F, hatch black; sut/sut, n = 15M:10F, hatch blue]. The mean time + SEM interacting with the novel and familiar object is graphed and analyzed within each age group by two-way ANOVA followed by Bonferroni’s multiple comparisons test. The discrimination index, calculated as the difference in time exploring the new object and the familiar object over the total time exploring both objects, was graphed as mean + SEM and analyzed via MMRM ANOVA followed by Bonferroni’s multiple comparisons test. (A) Time interacting with mouse vs object in males: Young: F(1,50) = 3.051, p = 0.0869, object; F(1,50) = 0.4780, p = 0.4925, genotype; F(1,50) = 0.0801, p = 0.7784, interaction (novel vs familiar: p = 0.6288 for +/+ , p = 0.2998 for sut/sut). Adult: F(1,52) = 32.32, p < 0.0001, object; F(1,52) = 6.316, p = 0.0151, genotype; F(1,52) = 0.5293, p = 0.4701, interaction. (novel vs familiar: p = 0.0027 for +/+ , p < 0.0001 for sut/sut). (B) Discrimination index in male mice: F(1, 25) = 10.68, p = 0.0031, age; F(1, 26) = 0.4207, p = 0.5223, genotype; F(1, 25) = 0.0074, p = 0.9318, interaction. (adult vs young: p = 0.0584 for +/+ , p = 0.0589 for sut/sut). (C) Time interacting with mouse vs object in females: Young: F(1,44) = 0.5771, p = 0.4515, genotype; F(1,44) = 5.620, p = 0.0222, object; F(1,44) = 0.2122, p = 0.6473, interaction. (novel vs familiar: p = 0.2923 for +/+ , p = 0.1410 for sut/sut). Adult: F(1,44) = 0.0016, p = 0.9682, genotype; F(1,44) = 7.543, p = 0.0087, object; F(1,44) = 0.0657, p = 0.7988, interaction. (novel vs familiar: p = 0.1204 for +/+ , p = 0.1113 for sut/sut). (D) Discrimination index in female mice: F(1, 44) = 0.5724, p = 0.4533, age; F(1, 44) = 1.045, p = 0.3122, genotype; F(1, 44) = 0.06248, p = 0.8023 interaction (adult vs young: p > 0.9999 for both +/+ and sut/sut).
FIGURE 8
FIGURE 8
Barnes maze performance. Male or Female SLC7A11+/+ and SLC7A11sut/sut littermates were tested at 2 (young) [ +/+ , n = 11M:13F, black; sut/sut, n = 15M:10F, blue] and at 6 months (adult) [ +/+ , n = 13M:9F, black; sut/sut, n = 14M:10F, blue]. Spatial learning is measured as time to the escape chamber (i.e., primary latency) across days and graphed as mean ± SEM per each day. Data were analyzed via MMRM ANOVA followed by Dunnett’s multiple comparisons test. The percentage of direct [light gray or light blue], serial [gray or blue] and random [white with black or blue borders] strategies used per each training days are graphed. Differences in strategy used between groups or days were determined by Fisher’s exact test. No within genotype sex differences were found. (A) Young sut/sut male mice took longer to find the escape chamber as compared to +/+ , but both genotypes improved their performance over time: F(1, 24) = 8.628, p = 0.0072, genotype; F(2.206, 50.06) = 15.13, p < 0.0001, training days; F(3, 68) = 0.4644, p = 0.7081, interaction, performing significantly better on the last day (d1 vs d4: *p = 0.0406 for +/+ , #p = 0.0031 for sut/sut). (B) Young female mice improved their performance on the maze over time: F(2.669, 56.06) = 15.58, p < 0.0001, training days; F(1, 21) = 0.51578, p = 0.4806, genotype; F(3, 63) = 1.690, p = 0.1782, interaction, and performed better on the last day (d1 vs d4: *p < 0.0001 for +/+ , #p = 0.0090 for sut/sut). (C) Young male mice adopted more effective (direct + serial) search strategy with training regardless of genotype (*d1 vs d4: p < 0.0001 for both +/+ and sut/sut). However, while +/+ male mice fully abandoned the use of a random strategy by day 4, sut/sut mice did not (#p = 0.0177 for d4). (D) Young female mice adopted more effective search strategies (direct + serial) across training days regardless of genotype (*d1 vs d4: p < 0.0001 for +/+ ; p = 0.0204 sut/sut). No genotype differences in strategy utilization by day 4 was found in female mice (p = 0.5757). (E) A main effect of training was present in adult male mice: F(1.613, 37.64) = 5.313, p = 0.0137, training days; F(1, 25) = 3.452, p = 0.0750, genotype; F(3, 70) = 0.7608, p = 0.5198 interaction. Post hoc analyses: adult +/+ mice improved their performance (*d1 vs d4: p = 0.0270) whereas adult sut/sut mice did not (d1 vs d4: p = 0.6446). Escape latency improved with age regardless of genotype: +/+ : F(1, 12) = 9.204, p = 0.0104 for age; sut/sut: F(1,14) = 19.23, p = 0.0006 for age. (F) A main effect of training was present in adult females: F(2.728, 50.01) = 4.806, p = 0.0064, training days; F(1, 21) = 0.1057, p = 0.7483, genotype; F(3, 55) = 1.548, p = 0.2124, interaction]. Post hoc analyses: adult +/+ mice improved their performance (*d1 vs d4: p = 0.0431) whereas adult sut/sut mice did not (d1 vs d4: p = 0.1818). Escape latency improved with age regardless of genotype: +/+ : F(1, 12) = 28.72, p = 0.0002 for age; sut/sut: F(1,9) = 12.72, p = 0.0061 for age. (G) Male mice adopted more effective strategies (direct + serial) across training days regardless of genotype (*d1 vs d4: p = 0.0003 for +/+ ; p = 0.0008 sut/sut). (H) Female mice also adapted more effective strategies (direct + serial) across training days regardless of genotype (*d1 vs d4: p = 0.0030 for +/+ ; p = 0.0064 for sut/sut). Adult female +/+ mice persisted in their use of a random strategy as compared to young +/+ females (#d4: young vs adult: p = 0.0427) and as compared to adult +/+ male mice ($d4: p = 0.0427). No differences between adult +/+ and sut/sut female mice in their use of strategies was uncovered (d4: p = 0.1211).
FIGURE 9
FIGURE 9
Acoustic startle reactivity and percent prepulse inhibition. Male (A,B) or Female (C,D) SLC7A11+/+ (+ / + , n = 13M:14F, black) and SLC7A11sut/sut (sut/sut, n = 15M:10F, blue) littermates were tested at 2 (young) and at 6 months (adult). ASR and PPI are graphed as mean ± SEM. Data were analyzed within each age group by two-way ANOVA followed by Bonferroni’s multiple comparisons test. Sex Differences: Female mice have an overall lower startle reactivity when compared to age- and genotype-matched male mice [young: F(1,125) = 10.16, p = 0.0018 for sex for +/+ ; F(1,115) = 20.86, p < 0.0001 for sex for sut/sut; adult: F(1,130) = 9.820, p = 0.0021 for sex for +/+ ; F(1,115) = 24.44, p < 0.0001 for sex for sut/sut]. No within genotype sex differences were found in PPI. (A) Mean startle reactivity is higher in sut/sut male mice, regardless of age, as compared to +/+ male mice when the prepulse delivered is below 15dB. Young: F(4, 130) = 6.424, p = 0.0124, genotype; F(4, 130) = 44.94, p < 0.0001, prepulse; F(4, 130) = 1.633, p = 0.1698, interaction. Adult: F(4, 135) = 7.680, p = 0.0064, genotype; F(4, 135) = 45.86, p < 0.0001, prepulse; F(4, 135) = 1.118, p = 0.3506, interaction. This difference is significant at the 6 dB prepulse *(p = 0.0267 for young; p = 0. 0253 for adult). (B) PPI significantly increased with prepulse intensity regardless of genotype in male mice: Young: F(3,108) = 19.33, p < 0.0001, prepulse; F(3,108) = 0.0033, p = 0.9543, genotype; F(1, 108) = 1.672 p = 0.1772, interaction. Adult: F(3,108) = 20.86, p < 0.0001, prepulse; F(1,108) = 0.0404, p = 0.8412, genotype; F(3, 108) = 1.685 p = 0.1745, interaction]. Young vs adult: +/+ : F(1, 52) = 0.3196, p = 0.5743 for age; sut/sut: F(1, 56) = 3.583, p = 0.0636 for age. (C) Mean startle reactivity did not differ between genotype at either age tested in female mice: Young: F(4, 110) = 0.8425, p = 0.3607, genotype; F(4, 110) = 21.91, p < 0.0001, prepulse; F(4, 110) = 0.1343, p = 0.9694, interaction. Adult: F(1,110) = 0.3995, p = 0.5286, genotype; F(4, 110) = 22.05, p < 0.0001, prepulse; F(4, 110) = 0.0856, p = 0.9867, interaction. (D) PPI significantly increased with prepulse intensity regardless of genotype in female mice: Young: F(3,88) = 12.46, p < 0.0001, prepulse; F(1,88) = 2.432, p = 0.1225, genotype; F(3, 88) = 0.0568, p = 0.9821, interaction. Adult: F(3,88) = 8.638, p < 0.0001, prepulse; F(1,88) = 0.4111, p = 0.5231, genotype; F(3, 88) = 0.3264, p = 0.8063, interaction. Young vs adult: +/+ : F(1, 52) = 3.705, p = 0.0597 for age; sut/sut: F(1, 36) = 1.268, p = 0.2676 for age.
FIGURE 10
FIGURE 10
Percent habituation. Male (A,B) or Female (C,D) SLC7A11+/+ (+ / + , n = 13M:14F, black) and SLC7A11sut/sut (sut/sut, n = 15M:10F, blue) littermates were tested at 2 (young) and at 6 months (adult). Each data point representing an individual animal is graphed with the median percent habituation (100 x [(mean startle amplitude on the first 6 trials - mean startle amplitude on the last 6 trials)/mean startle amplitude on the first 6 trials]) reflected by the horizontal line. Statistical analyses were performed on the habituation score [(mean startle amplitude on the last 6 trials)/(mean startle amplitude on the first 6 trials)] using MMRM ANOVA followed by Bonferroni’s multiple comparisons test. The number of non-habituating mice graphed as a percentage was analyzed using the Fisher’s exact test. Sex Differences: Percent habituation is disrupted in sut/sut male mice as compared to sut/sut female mice [F (1,48) = 4.301, p = 0.0435 for sex]. No sex differences were found in +/+ mice [F(1,48) = 0.7447, p = 0.3925 for sex]. (A) Habituation in males: F(1, 52) = 4.998, p = 0.0297, genotype; F(1, 52) = 4.066, p = 0.0489, age; F(1, 52) = 1.064, p = 0.3071, interaction. (+ / + vs sut/sut: p = 0.0498 for young, p = 0.7967 for adult) (young vs adult: p > 0.9999 for +/+ , p = 0.0593 for sut/sut). (B) Male non-habituator mice. Genotype: +/+ vs sut/sut (p = 0.0200 for young, p = 0.2761 for adult); Age: young vs adult (p > 0.9999 for +/+ , p = 0.2451 for sut/sut). (C) Habituation in females: F(1, 22) = 1.140, p = 0.2972, genotype; F(1, 22) = 1.801 p = 0.1933, age; F(1, 22) = 0.0386, p = 0.8461, interaction. (+ / + vs sut/sut: p > 0.9999 for young, p = 0.7085 for adult) (young vs adult: p = 0.5362 for +/+ , p = 0.8894 for sut/sut). (D) Female non-habituator mice. Genotype: +/+ vs sut/sut (p > 0.9999 for young, p = 0.1924 for adult); Age: young vs adult (p = 0.3845 for +/+ , p > 0.9999 for sut/sut).

Similar articles

References

    1. Abraham W. C., Jones O. D., Glanzman D. L. (2019). Is plasticity of synapses the mechanism of long-term memory storage? NPJ Sci. Learn. 4:9. - PMC - PubMed
    1. Adibi M. (2019). Whisker-mediated touch system in rodents: From neuron to behavior. Front. Syst. Neurosci. 13:40. 10.3389/fnsys.2019.00040 - DOI - PMC - PubMed
    1. Allsop S. A., Vander Weele C. M., Wichmann R., Tye K. M. (2014). Optogenetic insights on the relationship between anxiety-related behaviors and social deficits. Front. Behav. Neurosci. 8:241. 10.3389/fnbeh.2014.00241 - DOI - PMC - PubMed
    1. Autism Genome Project Consortium Szatmari P., Paterson A. D., Zwaigenbaum L., Roberts W., Brian J., et al. (2007). Mapping autism risk loci using genetic linkage and chromosomal rearrangements. Nat. Genet. 39, 319–328. - PMC - PubMed
    1. Baker D. A., Mcfarland K., Lake R. W., Shen H., Tang X. C., Toda S., et al. (2003). Neuroadaptations in cystine-glutamate exchange underlie cocaine relapse. Nat. Neurosci. 6 743–749. - PubMed