. 2023 Aug 2:33:683-697.
doi: 10.1016/j.omtn.2023.07.037. eCollection 2023 Sep 12.

Disease modeling and gene correction of LGMDR21 iPSCs elucidates the role of POGLUT1 in skeletal muscle maintenance, regeneration, and the satellite cell niche

Affiliations

Disease modeling and gene correction of LGMDR21 iPSCs elucidates the role of POGLUT1 in skeletal muscle maintenance, regeneration, and the satellite cell niche

Jose L Ortiz-Vitali et al. Mol Ther Nucleic Acids. .

Abstract

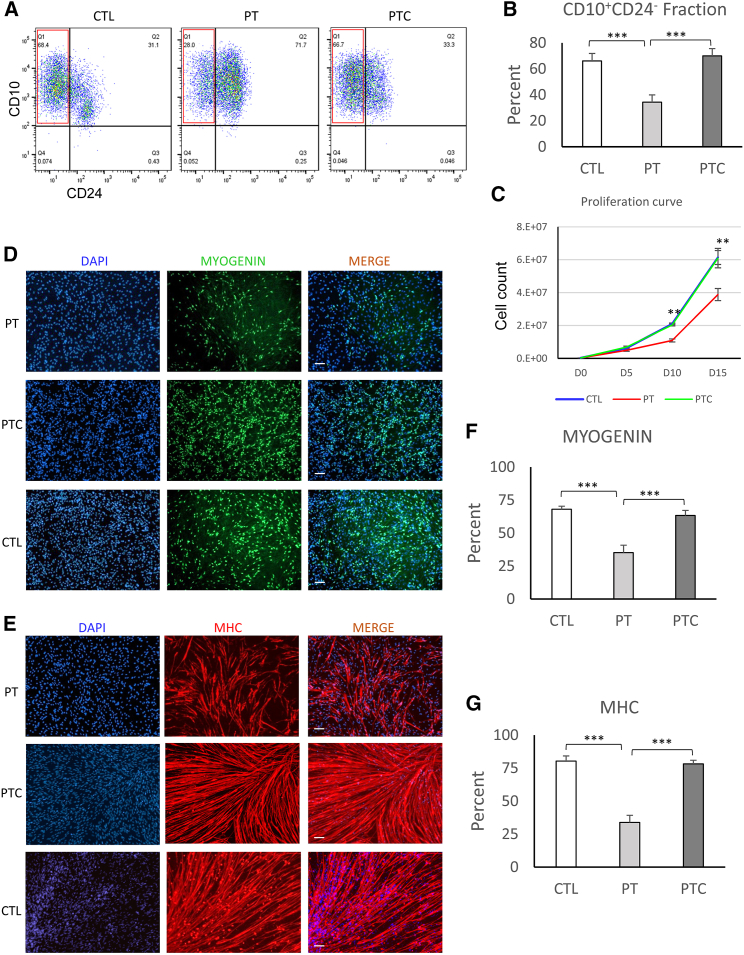
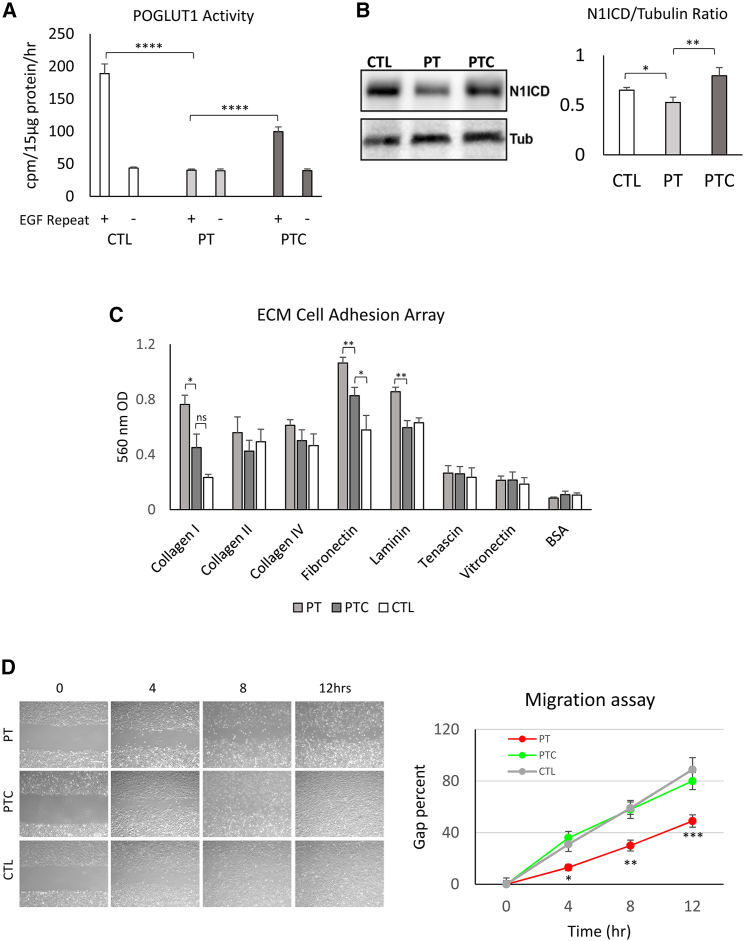
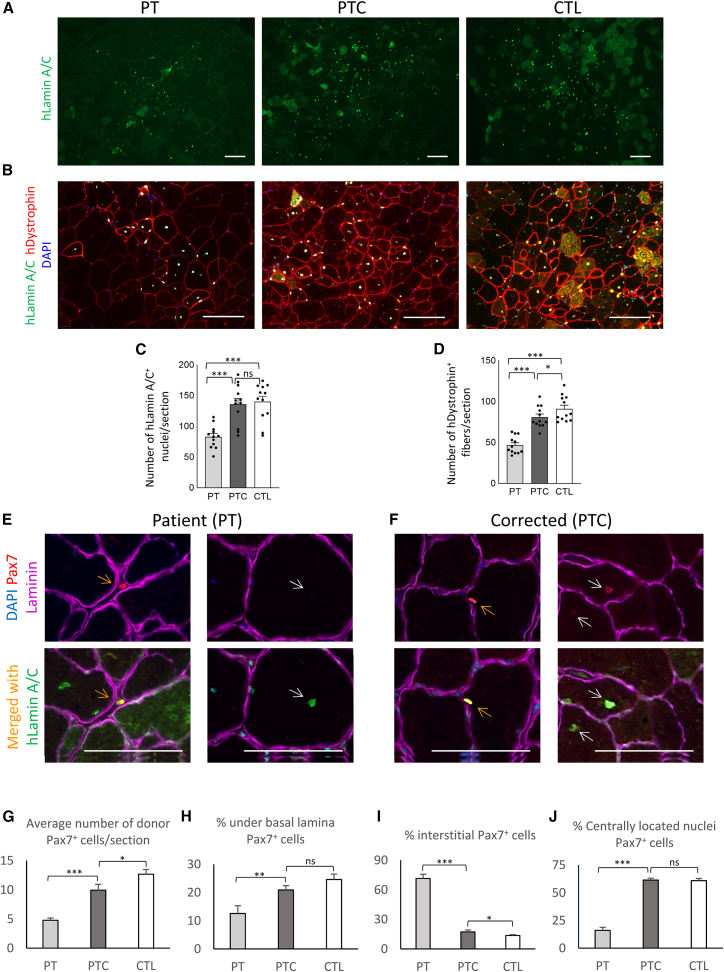
Autosomal recessive limb-girdle muscular dystrophy 21 (LGMDR21) is caused by pathogenic variants in protein O-glucosyltransferase 1 (POGLUT1), which is responsible for O-glucosylation of specific epidermal growth factor (EGF) repeats found in ∼50 mammalian proteins, including Notch receptors. Previous data from patient biopsies indicated that impaired Notch signaling, reduction of muscle stem cells, and accelerated differentiation are probably involved in disease etiopathology. Using patient induced pluripotent stem cells (iPSCs), their corrected isotypes, and control iPSCs, gene expression profiling indicated dysregulation of POGLUT1, NOTCH, muscle development, extracellular matrix (ECM), cell adhesion, and migration as involved pathways. They also exhibited reduced in vitro POGLUT1 enzymatic activity and NOTCH signaling as well as defective myogenesis, proliferation, migration and differentiation. Furthermore, in vivo studies demonstrated significant reductions in engraftment, muscle stem cell formation, PAX7 expression, and maintenance, along with an increased percentage of mislocalized PAX7+ cells in the interstitial space. Gene correction in patient iPSCs using CRISPR-Cas9 nickase led to the rescue of the main in vitro and in vivo phenotypes. These results demonstrate the efficacy of iPSCs and gene correction in disease modeling and rescue of the phenotypes and provide evidence of the involvement of muscle stem cell niche localization, PAX7 expression, and cell migration as possible mechanisms in LGMDR21.

Keywords: CRISPR-Cas9; LGMDR21; MT: RNA/DNA Editing; POGLUT1; gene correction; iPSCs; muscle stem cells; skeletal muscle.


Conflict of interest statement

The authors declare no competing interests.

Figures

None
Graphical abstract
Figure 1
Figure 1
Gene correction strategy of the iPSCs (A) Analyzed sequence near the mutation site and selected gRNAs and their cutting sites. Red and blue sequences mark the PAM and target sites. Red arrows mark the cutting sites. (B) Targeting strategy using an HDR vector containing homology arms, positive and negative selection cassettes, and final removal of the selection cassette. Primer sites and PCR products for wild-type (1.2 kb), targeted alleles (1.7 kb), and after Cre removal (0.7 and 0.9 kb) are marked. (C) Surveyor assay confirming the cutting efficiency of the selected Cas9n pairs. The 1+4 pair demonstrated the best in vitro targeting efficiency and was used for gene correction experiments. (D) PCR image of wild-type and targeted alleles demonstrates the presence of targeted iPSCs among screened single-cell clones. (E) PCR for confirmation of removal of the selection cassette among screened single-cell clones. (F) Bright-field image of a single-copy-corrected iPSC. (G) Sequencing results of healthy control (CTL), patient (PT), and patient-corrected (PTC) iPSCs confirm correct replacement of the mutated codon.
Figure 2
Figure 2
Defective in vitro myogenesis of PT iPSCs and their rescue after gene correction (A) A representative flow cytometric analysis of the myogenic fraction (CD10+CD24) on day 15 of differentiation of iPSCs demonstrates a significant reduction of the myogenic fraction in PT vs. healthy CTL and its rescue in PTC iPSCs. (B) Quantitative analysis of the myogenic fraction in studied iPSCs demonstrates a significant reduction of the myogenic fraction in PT cells compared with healthy CTL iPSCs and its rescue after gene correction. Data are mean +SEM from 5 independent experiments. (C) Proliferation curve of studied cells during the myogenic induction phase (days 0–15) indicates significant reduction of the proliferation rate in PT cells and its rescue after correction. Data are mean +SEM from 5 independent experiments. (D and E) Immunofluorescence (IF) staining of myogenic cells after differentiation into myotubes for MYOGENIN and myosin heavy chain (MHC). (F and G) Quantification of the IF images indicates a significant reduction of differentiation in PT cells compared with CTL cells and their rescue after single-copy correction. Data are mean +SEM from 5 independent experiments (5 representative image/marker/experiment). ∗∗p < 0.01, ∗∗∗p < 0.001.
Figure 3
Figure 3
Gene expression profiling of PT, PTC, and CTL iPSCs during the myogenic differentiation time course (A) Major variation in transcript level reflects differentiation stage differences. A scatterplot shows RNA-seq data projected onto the first two PCs; each data point represents a sample: PC1 (33% variance) and PC2 (21% variance). (B) A scatterplot shows RNA-seq data projected onto the fourth and sixth PCs to visualize the donor effects and variant correction effects: PC4 (5.5% variance) and PC6 (3.2% variance). (C) Heatmap representation of results from a targeted search for gene set enrichment. The color code reflects the significance level (i.e., −log10 p value) of enrichment for each differentiation stage by gene set combination. MC.Notch, a manually curated list of Notch-related genes (Table S1). (D) Heatmap representations of gene set enrichment analysis results from a systematic search across the GO database. Shown are the top 5 categories identified for day 15 variant correction effect genes. The color key reflects the significance level (i.e., −log10 p value) of enrichment. (E) A scatterplot visualizes the between-differentiation stage log2 fold change in gene expression level comparing PT samples with and without variant correction for day 15 vs. day 20. Red data points represent day 15 vs. day 20 LGMDR21-impacted differentiation genes that passed the 1% FWER significance cutoff, and the corresponding effect size is proportional to the shortest distance to the black diagonal line from the center of each data point. (F) Network representation of STRING connections for day 15 vs. day 20 LGMDR21-impacted differentiation genes. Each node represents a gene, and edges represent connections between genes that passed a STRING score cutoff of 0.9. Nodes are color coded by gene set annotations.
Figure 4
Figure 4
Evaluation of enzyme activity, N1ICD, cell adhesion, and migration in iPSC-derived myogenic progenitors from PT, PTC, and CTL cells (A) Measurement of POGLUT1 activity in the absence or presence of factor IX EGF repeats indicate a significant reduction of enzyme activity in PT cells compared with the CTL and its partial rescue after one-copy gene correction in PTC cells. Data are mean +SEM from five experimental replicates for each cell line. (B) A representative WB gel image of N1ICD demonstrates its reduction in PT cells compared with the CTL and its rescue after gene correction. The bar graph represents the N1ICD/tubulin ratio from five independent experimental replicates. (C) Bar graph representation of the ECM cell adhesion potential of the iPSC-derived myogenic progenitors from the study samples. Values are the mean +SEM from 4 independent experimental replicates. (D) The migration time course of the studied cells using a scratch wound healing assay demonstrates a migration deficiency of PT cells compared with the CTL and its rescue after gene correction. The graph on the right demonstrates quantitative evaluation of the migration potential at each time point. Data are mean ± SEM from 6 experimental replicates. ∗p < 0.05, ∗∗p < 0.01, ∗∗∗p < 0.001, ∗∗∗∗p < 0.0001.
Figure 5
Figure 5
In vivo transplantation study of iPSC-derived myogenic progenitors from PT, PTC, and CTL cells in a muscle injury model in NSG mice (A) Representative low-magnification images demonstrate donor cell presence in host myofibers using immunostaining for a human donor cell marker (human lamin A/C). (B) Representative higher-magnification images demonstrate donor cell engraftment into host myofibers expressing human dystrophin and human lamin A/C. (C and D) Quantitative evaluation of donor cells demonstrates significant reduction of donor cell presence and myofiber engraftment in PT cells compared with the CTL and its rescue after gene correction. (E) A representative image of PT -derived cell engraftment. Left images demonstrate a PT -derived cell (expressing PAX7 and hLamin A/C, orange arrow) residing in the interstitial space between the myofibers. The right image shows a PT -derived cell (expressing hLamin A/C, white arrow) in a regenerating fiber and negative for PAX7. (F) A representative image of a one-copy gene-corrected PT derived cell. The left images demonstrate a PTC cell (expressing PAX7 and hLamin A/C, orange arrow) under the basal lamina. The right image shows two PTC cells (expressing PAX7 and hLamin A/C, white arrows) in a regenerating fiber. (G–J) Quantification of the average number of donor PAX7+ cells, based on their localization to myofibers. Data are mean +SEM (n = 6 mouse/cell group). ∗p < 0.05, ∗∗p < 0.01, ∗∗∗p < 0.001.

References

    1. Murphy A.P., Straub V. The Classification, Natural History and Treatment of the Limb Girdle Muscular Dystrophies. J. Neuromuscul. Dis. 2015;2:S7–S19. - PMC - PubMed
    1. Vissing J. Limb girdle muscular dystrophies: classification, clinical spectrum and emerging therapies. Curr. Opin. Neurol. 2016;29:635–641. - PubMed
    1. Narayanaswami P., Carter G., David W., Weiss M., Amato A.A. Evidence-based guideline summary: Diagnosis and treatment of limb-girdle and distal dystrophies: Report of the Guideline Development Subcommittee of the American Academy of Neurology and the Practice Issues Review Panel of the American Association of Neuromuscular & Electrodiagnostic Medicine. Neurology. 2015;84:1720–1721. - PubMed
    1. Magri F., Brajkovic S., Govoni A., Brusa R., Comi G.P. Revised Genetic Classification of Limb Girdle Muscular Dystrophies. Curr. Mol. Med. 2014;14:934–943. - PubMed
    1. Nigro V., Savarese M. Genetic basis of limb-girdle muscular dystrophies: the 2014 update. Acta Myol. 2014;33:1–12. - PMC - PubMed