. 2023 Oct 31;14(5):e0085723.
doi: 10.1128/mbio.00857-23. Epub 2023 Aug 31.

Biological hydrogen cyanide emission globally impacts the physiology of both HCN-emitting and HCN-perceiving Pseudomonas

Affiliations

Biological hydrogen cyanide emission globally impacts the physiology of both HCN-emitting and HCN-perceiving Pseudomonas

Abhishek Anand et al. mBio. .

Abstract

Bacteria communicate by exchanging chemical signals, some of which are volatile and can remotely reach other organisms. HCN was one of the first volatiles discovered to severely impact exposed organisms by inhibiting their respiration. Using HCN-deficient mutants in two Pseudomonas strains, we demonstrate that HCN's impact goes beyond the sole inhibition of respiration and affects both emitting and receiving bacteria in a global way, modulating their motility, biofilm formation, and production of antimicrobial compounds. Our data suggest that bacteria could use HCN not only to control their own cellular functions, but also to remotely influence the behavior of other bacteria sharing the same environment. Since HCN emission occurs in both clinically and environmentally relevant Pseudomonas, these findings are important to better understand or even modulate the expression of bacterial traits involved in both virulence of opportunistic pathogens and in biocontrol efficacy of plant-beneficial strains.

Keywords: HCN; Pseudomonas; siderophores; volatile.


Conflict of interest statement

The authors declare no conflict of interest.

Figures

Fig 1
Fig 1
Loss of cyanogenesis increases pyoverdine and phenazine production, induces swimming motility, and represses biofilm production. (a) Qualitative analysis of siderophore production by wild type (wt) and cyanide-deficient (Δhcn) mutant strains of both Pseudomonas chlororaphis R47 and Pseudomonas putida R32 after 5 days of growth at room temperature on King’s B agar medium. Plates were visualized under UV light. (b) Growth curves [optical density (OD) at 600 nm, lines] and pyoverdine (Pvd) detection assay (fluorescence reading at 465 nm, bars) in liquid King’s B medium grown for 19 h at 30°C. Data represent the average of three independent experiments with four technical replicates each. (c) Phenazine quantification assay based on HPLC-UV detection. R47 wt and R47 Δhcn strains were grown at 30°C in liquid King’s B medium for 24 h before sampling. Bars represent the PCA peak area normalized with growth (OD600). Data represent the average of three independent experiments with three technical replicates each. (d) Swimming motility assay on low agar M9 plates. The colony area was measured using the ImageJ software after 4 to 5 days incubation at room temperature. Bars show the average of four and three independent experiments for R47 and R32, respectively, with four to six technical replicates each. (e) Biofilm formation assay. Strains were grown statically in liquid King’s B medium in 96-well plates for 48 h at 30°C. Bars correspond to biofilm index (crystal violet staining measured at 570 nm divided by optical density measured at 550 nm before the staining) and represent the average of three independent experiments with 36 technical replicates each. For c–e, samples were statistically analyzed using Mann–Whitney U test (two-tailed). ***P < 0.001. Error bars represent standard error.
Fig 2
Fig 2
Inability to produce HCN leads to global transcriptional dysregulation. (a) Representative growth curve of P. chlororaphis R47 wt and Δhcn strains in King’s B liquid medium highlighting the three time points used for transcriptome analysis. T1; early log phase, T2; transition phase (exponential to stationary), T3; early stationary phase. (b) Principal component analysis of transcriptomic data at the three time points. Strains were grown in King’s B liquid medium in 6-well plates at 30°C with continuous shaking before each sampling. (c) COG category analysis of the dysregulated genes in R47 Δhcn strain compared with its wild type. Bars show the percentage of dysregulated genes in each COG category. RNA-sequencing data (b and c) were obtained from three independent experiments. Cut-off for significance; Log2 (fold change) ≥1, q-value ≤0.05.
Fig 3
Fig 3
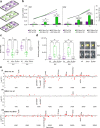
Exposure to exogenous HCN emitted by P. chlororaphis R47 and P. putida R32 wild types represses pyoverdine production and swimming motility, but induces biofilm formation in the cyanide-deficient mutants. (a) Scheme of the volatile-mediated exposure experiment using 6-well plates used for (b). Purple color represents liquid cultures of the wild type, green color liquid cultures of the cyanide-deficient mutants. The middle two wells (thicker border) were collected for RNA extraction and sequencing. (b) Growth (OD600) and pyoverdine (pvd) measurements for P. chlororaphis R47 and P. putida R32 strains grown at 30°C in liquid King’s B medium in 6-well plates. wt, wildtype; Δhcn, cyanide-deficient mutant; EΔhcn, Δhcn strains exposed to HCN emitted by the respective wild types. Measurements were performed as indicated in Fig. 1. Data represent the average of three independent experiments with two technical replicates each. T1 (early log phase), T2 (transition phase between exponential and stationary phases), and T3 (early stationary phase). (c) Biofilm formation assay for wild types (wt), cyanide-deficient mutants (Δhcn), and HCN-exposed mutants (EΔhcn). The assay was carried out in liquid LB as indicated in Fig. 1 and Fig. S8. Bars represent the average of three independent experiments with 6–20 technical replicates each. (d) Swimming/swarming motility assay on split Petri dishes. The wild type and the cyanide-deficient mutant were grown on each side of the split Petri dishes (Fig. S7). Plates were incubated at room temperature for two days before pictures were taken. The areas were measured as indicated in Fig. 1. Bars show averages of three independent experiments with four to five technical replicates each. (e) Genome-wide representation of differentially expressed genes at timepoint 2 (transition phase between exponential and stationary growth phase). The x-axis shows the gene location on the chromosome with each dot corresponding to one gene and the y-axis shows the log2 (fold change) values. (i) and (ii) log2 (fold change) values correspond to Δhcn and EΔhcn, using the wt as reference. (iii) Log2 (fold change) values correspond to the Δhcn strain using EΔhcn as reference. Red dots represent significantly differentially expressed genes while gray dots represent no significant difference as compared to the respective reference. Cut-off for significance; Log2 (fold change) ≥1, q-value ≤ 0.05. For b–d, samples were statistically analyzed using ANOVA followed by Tukey’s multiple comparison tests. Error bars represent the standard error. ***P < 0.001, **P < 0.01, *P < 0.05; ns, not significant. For (e) dots represent average values from three independent experiments for each time point and treatment. SodA, superoxide dismutase A; hcnABC, hydrogen cyanide synthase ABC; cytochrome unit, cytochrome orphan subunit N4Q4; Pvd, pyoverdine biosynthesis; Phz, phenazine biosynthesis; glycolate, glycolate to glyoxylate oxidation; heme, heme utilization; mlrA, activator of csgD (master regulator of biofilm formation); GCv, glycine-cleavage system.

References

    1. Weisskopf L, Schulz S, Garbeva P. 2021. Microbial volatile organic compounds in intra-kingdom and inter-kingdom interactions. Nat Rev Microbiol 19:391–404. doi:10.1038/s41579-020-00508-1 - DOI - PubMed
    1. Gunasekar PG, Borowitz JL, Turek JJ, Van Horn DA, Isom GE. 2000. Endogenous generation of cyanide in neuronal tissue: involvement of a peroxidase system. J Neurosci Res 61:570–575. doi:10.1002/1097-4547(20000901)61:5<570::AID-JNR12>3.0.CO;2-V - DOI - PubMed
    1. Brückner A, Raspotnig G, Wehner K, Meusinger R, Norton RA, Heethoff M. 2017. Storage and release of hydrogen cyanide in a chelicerate (Oribatula tibialis). Proc Natl Acad Sci U S A 114:3469–3472. doi:10.1073/pnas.1618327114 - DOI - PMC - PubMed
    1. Peiser GD, Wang TT, Hoffman NE, Yang SF, Liu HW, Walsh CT. 1984. Formation of cyanide from carbon 1 of 1-aminocyclopropane-1-carboxylic acid during its conversion to ethylene. Proc Natl Acad Sci U S A 81:3059–3063. doi:10.1073/pnas.81.10.3059 - DOI - PMC - PubMed
    1. Blumer C, Haas D. 2000. Mechanism, regulation, and ecological role of bacterial cyanide biosynthesis. Arch Microbiol 173:170–177. doi:10.1007/s002039900127 - DOI - PubMed

Publication types

MeSH terms

Substances

LinkOut - more resources