. 2023 Oct 13;51(18):9690-9702.
doi: 10.1093/nar/gkad718.

Optimisation of TP53 reporters by systematic dissection of synthetic TP53 response elements

Affiliations

Optimisation of TP53 reporters by systematic dissection of synthetic TP53 response elements

Max Trauernicht et al. Nucleic Acids Res. .

Abstract

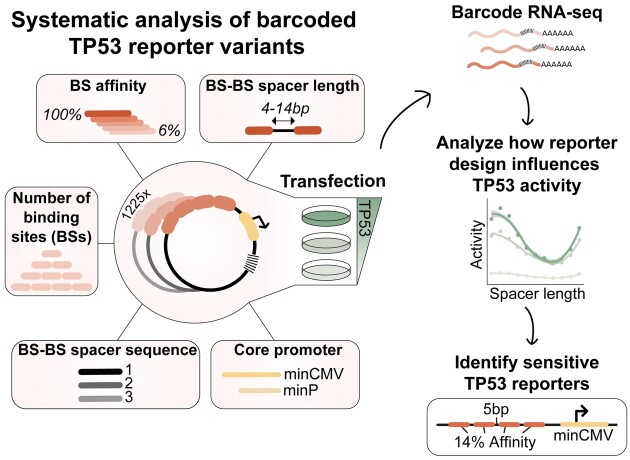
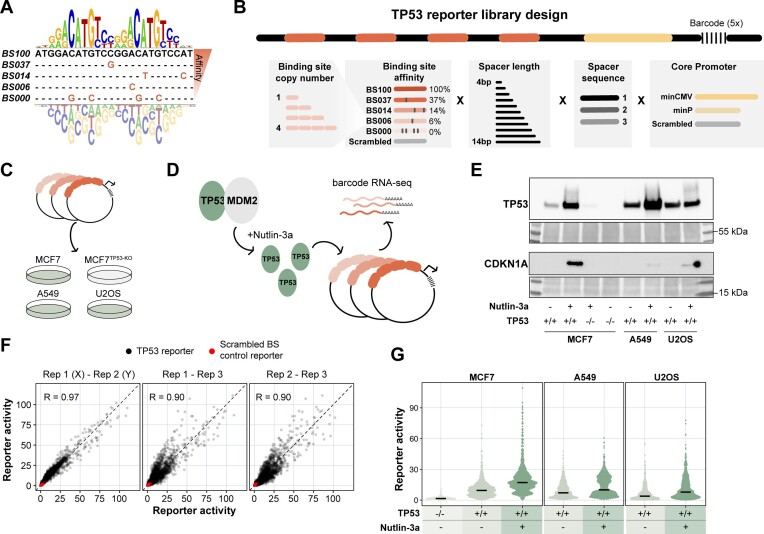
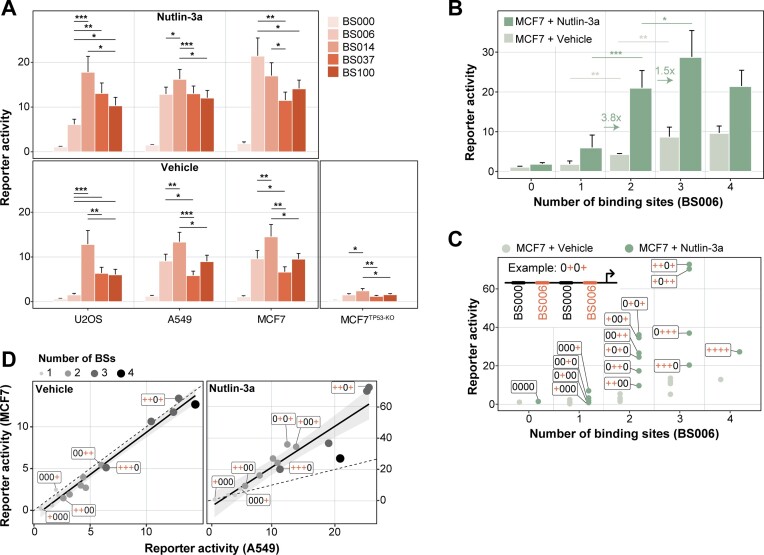
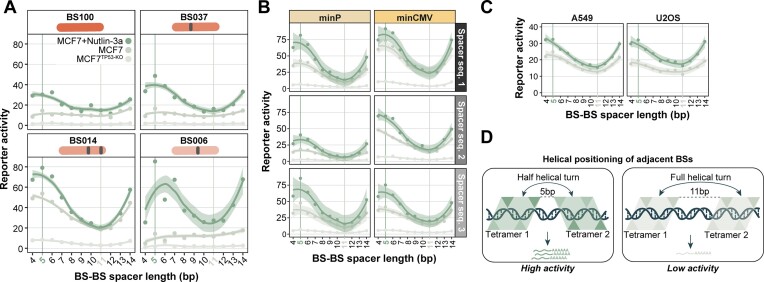
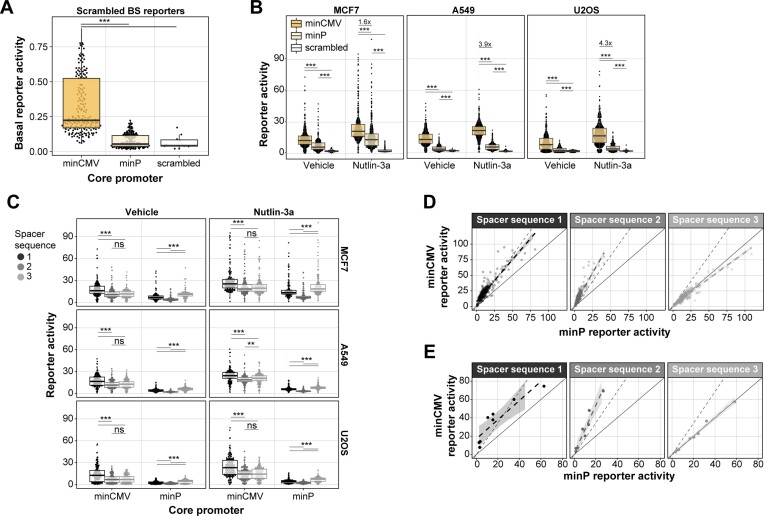
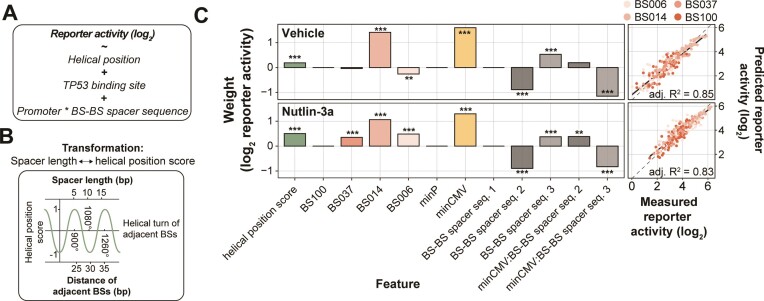
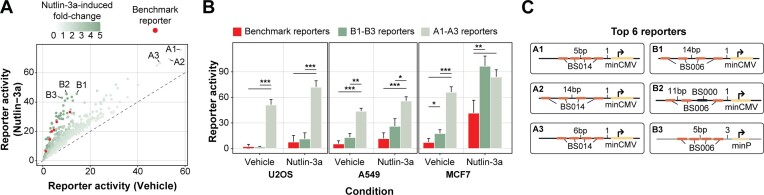
TP53 is a transcription factor that controls multiple cellular processes, including cell cycle arrest, DNA repair and apoptosis. The relation between TP53 binding site architecture and transcriptional output is still not fully understood. Here, we systematically examined in three different cell lines the effects of binding site affinity and copy number on TP53-dependent transcriptional output, and also probed the impact of spacer length and sequence between adjacent binding sites, and of core promoter identity. Paradoxically, we found that high-affinity TP53 binding sites are less potent than medium-affinity sites. TP53 achieves supra-additive transcriptional activation through optimally spaced adjacent binding sites, suggesting a cooperative mechanism. Optimally spaced adjacent binding sites have a ∼10-bp periodicity, suggesting a role for spatial orientation along the DNA double helix. We leveraged these insights to construct a log-linear model that explains activity from sequence features, and to identify new highly active and sensitive TP53 reporters.


Figures

Graphical Abstract
Graphical Abstract
Figure 1.
Figure 1.
Systematic screening of TP53 reporter variants. (A) The 24-bp position weight matrix (PWM) underlying the TP53 affinity model (25), which was used to design five TP53 BSs with a broad range of predicted binding affinities. (B) Scheme of the TP53 reporter design. TP53 BSs were placed at four positions, with the first BS positioned 10 bp upstream of the core promoter. TP53 BSs, BS–BS spacer length, BS–BS spacer sequence and core promoter were varied as indicated in the scheme. (C) The TP53 reporter plasmid library was transfected into A549, U2OS and TP53 proficient or TP53-KO MCF7 cells. (D) Upon transfection the cells were treated with Nutlin-3a or vehicle control. (E) Western blot showing the protein levels of TP53 and CDKN1A in all tested conditions. Bottom panels show Ponceau S staining serving as loading control. (F) Pairwise correlations between the three independent replicates of the computed reporter activities. Reporter activities were computed from the barcode counts in the mRNA, and are displayed as fold enrichment over the mean of the scrambled BS controls per core promoter and condition. Only data for MCF7 cells are shown. Experiments in A549 and U2OS cells were performed in two independent biological replicates which correlated highly (Pearson's R = 0.99 and 0.98 for A549 and U2OS, respectively). (G) Reporter activities (average of the three independent replicates) of all TP53 reporters compared to the scrambled BS control reporters in the tested conditions. Black horizontal lines indicate median values.
Figure 2.
Figure 2.
The impact of BS affinity and copy number on reporter activity. (A) Reporter activity per condition and BS, as indicated by the colour. Only reporters with four identical copies of the BS and a BS–BS spacer length of 11 bp between all BSs are displayed. Bars indicate the mean and error bars the standard deviation of reporter activities across all BS–BS spacer sequences and core promoters. P-values were calculated using two-tailed paired Student's t-test: significance levels: ***P < 0.001, **P < 0.01, *P < 0.05. (B) Impact of BS006 copy number on reporter activity in TP53-WT cells and TP53-WT cells stimulated with Nutlin-3a. Displayed is the mean and standard deviation of reporter activities across all BS–BS spacer sequences and core promoters. The arrows and numbers indicate the fold-change in reporter activity from one to two or two to three copies of BSs in the MCF7 + Nutlin-3a condition. P-values were calculated using two-tailed paired Student's t-test: significance levels: ***P < 0.001, **P < 0.01, *P < 0.05. (C) Reporter activity as function of copy number and positioning of the BSs. The cartoon depicts the BS code of the reporters; + (red) = BS006, 0 (black) = BS000, arrow = core promoter. Displayed is the mean of the minCMV reporter activities across all BS–BS spacer sequences. (D) Correlation of the data plotted in (C) between MCF7 and A549 cells without stimulation (left panel) and with stimulation of Nutlin-3a (right panel).
Figure 3.
Figure 3.
BS–BS spacer length affects transcriptional output periodically. (A) Activities of minCMV reporters in MCF7 cells (TP53-KO, TP53-WT and TP53-WT + Nutlin-3a) as a function of BS–BS spacer length, with four identical BSs as indicated. Activities are averaged across the three BS–BS spacer sequences. (B) Reporter activities (only BS014) per BS–BS spacer length, separately for the three BS–BS spacer sequences and the two core promoters. (C) Data shown in (B) for A549 and U2OS cells (average across BS–BS spacer sequence and core promoter). Data points in (A)-(C) were fitted using LOESS smoothing with a 95% confidence interval. (D) Model of adjacent TP53 tetramers on DNA at BS–BS spacer lengths of 5 bp (upper panel) or 11 bp (lower panel). The triangles indicate TP53 monomers.
Figure 4.
Figure 4.
Effects of core promoter and BS–BS spacer sequences. (A) Activities of reporters with scrambled BSs per core promoter. Basal reporter activities are displayed and are not normalised per core promoter like in all other figure panels. (B) Reporter activities of all TP53 reporters per core promoter in MCF7, A549 and U2OS cells treated with vehicle or Nutlin-3a. (C) Reporter activities of all TP53 reporters per BS–BS spacer sequence and core promoter in MCF7, A549 and U2OS cells treated with vehicle or Nutlin-3a. (D) Correlation of the reporter activities between the two minimal promoters per BS–BS spacer sequence in MCF7 cells. Solid line indicates proportional relationship with slope 1, dotted line indicates the proportional relationship with the slope of the mean fold-change of minCMV over minP reporters. Data points are fitted using linear regression with a 95% confidence interval, as indicated by the grey shaded dotted line. (E) Same as (D) but only for reporters with a constant spacer sequence between the BSs. Groups in (A), (B) and (C) were compared using Wilcoxon rank sum test, significance levels: ***P < 0.001, **P < 0.01, *P < 0.05, ns: P ≥ 0.05.
Figure 5.
Figure 5.
Log-linear model captures importance of design features. (A–C) Log-linear modelling to estimate relative contributions of BS spacing, BS–BS spacer sequences and core promoter choice. (A) Equation of the log-linear model used to fit the reporter activities. Reporter activities were averaged across the three probed cell types. (B) Explanation of the transformation of BS–BS spacer length (bp) to the helical position score. (C) Right-side plots: scatter plots of measured reporter activities compared to reporter activities as predicted by the log-linear model. Adjusted R2 is calculated from R2 by adjusting for the total number of model features. Left-side plots: weights calculated by the log-linear model. Asterisks indicate P-values of the individual features, significance levels: ***P < 0.001, **P < 0.01, *P < 0.05, ns: P ≥ 0.05.
Figure 6.
Figure 6.
Identifying reporters with high TP53 activity and sensitivity. (A) Scatter plot showing the differences in reporter activity in TP53-WT versus TP53-WT stimulated with Nutlin-3a. Displayed is the mean effect across the three tested cell types. Benchmark reporters are indicated in red. The two sets of identified TP53-sensitive reporters are denoted as A1–A3 and B1–B3. (B) Reporter activities of the three set A (light green) and three set B (dark green) reporters versus the six benchmark reporters (red) in the different conditions. Displayed is the mean and standard deviation across the reporters. P-values were calculated using two-tailed paired Student's t-test: significance levels: ***P < 0.001, **P < 0.01, *P < 0.05. (C) Schematic representation of the design of the set A and set B reporters.

Similar articles

Cited by

References

    1. el-Deiry W.S., Kern S.E., Pietenpol J.A., Kinzler K.W., Vogelstein B.. Definition of a consensus binding site for p53. Nat. Genet. 1992; 1:45–49. - PubMed
    1. Fischer M. Census and evaluation of p53 target genes. Oncogene. 2017; 36:3943–3956. - PMC - PubMed
    1. Espinosa J.M. Mechanisms of regulatory diversity within the p53 transcriptional network. Oncogene. 2008; 27:4013–4023. - PMC - PubMed
    1. Schlereth K., Beinoraviciute-Kellner R., Zeitlinger M.K., Bretz A.C., Sauer M., Charles J.P., Vogiatzi F., Leich E., Samans B., Eilers M.et al. .. DNA binding cooperativity of p53 modulates the decision between cell-cycle arrest and apoptosis. Mol. Cell. 2010; 38:356–368. - PubMed
    1. Ciribilli Y., Monti P., Bisio A., Nguyen H.T., Ethayathulla A.S., Ramos A., Foggetti G., Menichini P., Menendez D., Resnick M.A.et al. .. Transactivation specificity is conserved among p53 family proteins and depends on a response element sequence code. Nucleic Acids Res. 2013; 41:8637–8653. - PMC - PubMed