Review
. 2023 Aug 31;15(1):209.
doi: 10.1007/s40820-023-01174-7.

Zinc-Bromine Rechargeable Batteries: From Device Configuration, Electrochemistry, Material to Performance Evaluation

Affiliations
Review

Zinc-Bromine Rechargeable Batteries: From Device Configuration, Electrochemistry, Material to Performance Evaluation

Norah S Alghamdi et al. Nanomicro Lett. .

Abstract

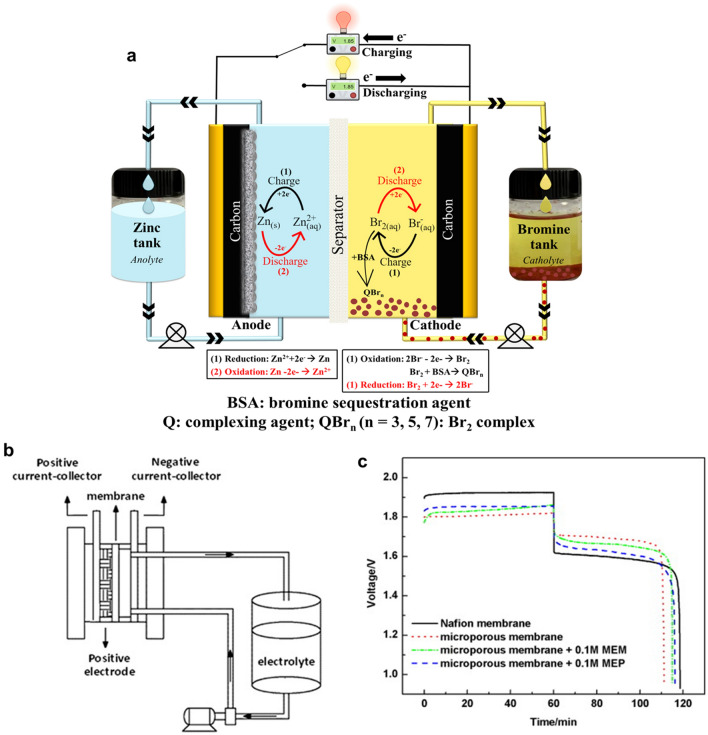
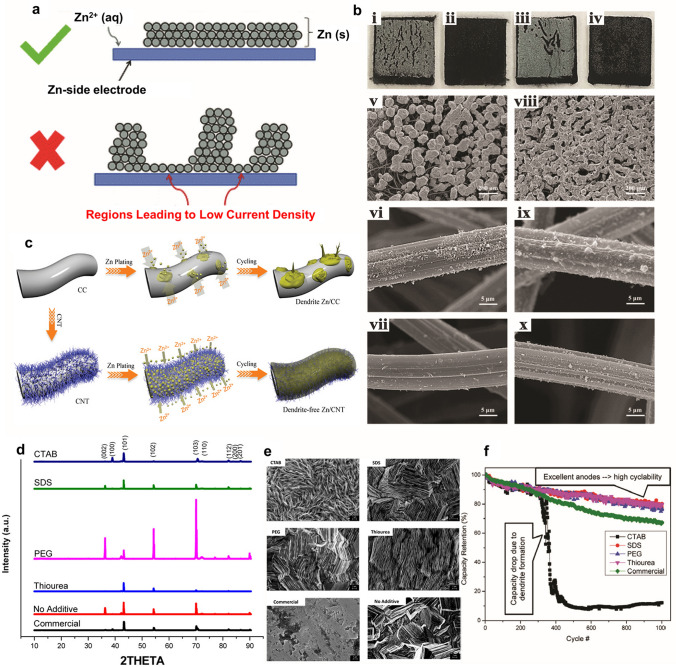
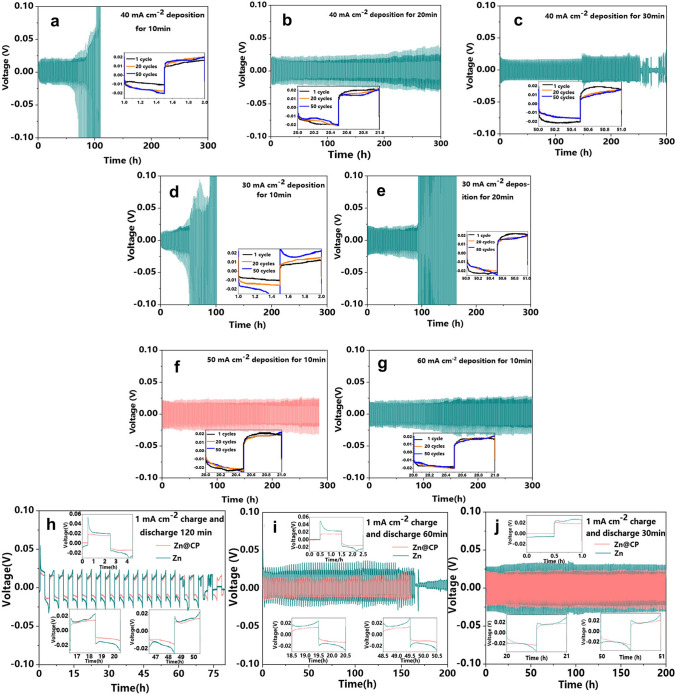
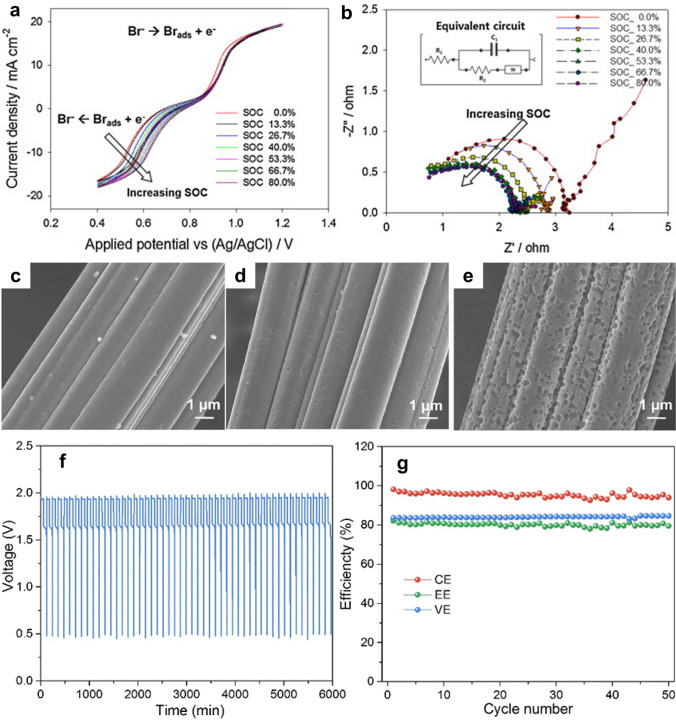
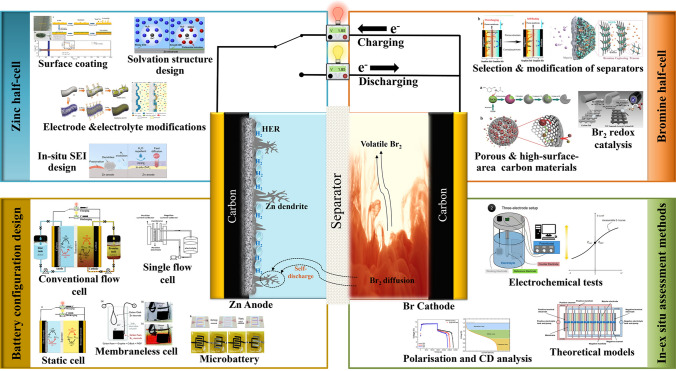
Zinc-bromine rechargeable batteries (ZBRBs) are one of the most powerful candidates for next-generation energy storage due to their potentially lower material cost, deep discharge capability, non-flammable electrolytes, relatively long lifetime and good reversibility. However, many opportunities remain to improve the efficiency and stability of these batteries for long-life operation. Here, we discuss the device configurations, working mechanisms and performance evaluation of ZBRBs. Both non-flow (static) and flow-type cells are highlighted in detail in this review. The fundamental electrochemical aspects, including the key challenges and promising solutions, are discussed, with particular attention paid to zinc and bromine half-cells, as their performance plays a critical role in determining the electrochemical performance of the battery system. The following sections examine the key performance metrics of ZBRBs and assessment methods using various ex situ and in situ/operando techniques. The review concludes with insights into future developments and prospects for high-performance ZBRBs.

Keywords: Assessment methods; Cell configurations; Electrochemical property; Performance metrics; Zinc–bromine rechargeable batteries.


Conflict of interest statement

The authors declare no interest conflict. They have no known competing financial interests or personal relationships that could have appeared to influence the work reported in this paper.

Figures

Fig. 1
Fig. 1
Schematic representation of different static cells. a ZBRB with static non-flow configuration. b MA-ZBB cell design schematic. The photographs of the realised 5 mL cell in the c discharged and d charged states show the distinct colours of Br2(l) (red), dissolved Br2(aq) (yellow) and ZnBr2(aq) electrolyte (transparent). Panels bd reproduced with permission from Ref. [12]. Copyright 2017, The Royal Society of Chemistry. e Fabrication process of the ZnBr2 MBs. f Digital photographs of flexible Zn–Br2 MBs at flat and bending states. g In situ construction of Br2 cathode and Zn anode during the charging process. h Schematic of the fast diffusion of Br3 from current collector when ZnBr2 solution is used as the electrolyte. i When TBABr is used as the electrolyte, solid-state TBABr3 complex is produced, which shows slow reaction kinetics. j When MPIBr is used as the electrolyte, the oily phase MPIBr3 complex is generated, which not only prevents the Br3 from dissolving into the electrolyte but also shows fast reaction kinetics. Charge–discharge curves of ZBBs with k ZnBr2, l TBABr and m MPIBr electrolytes. Panels em reproduced with permission from Ref. [15] Copyright 2022, SCIENCE ADVANCES
Fig. 2
Fig. 2
a Typical ZBFB with the redox reaction mechanism and different components. b Schematic diagram of a single-flow zinc–bromine battery. c Charge–discharge curves of single-flow ZBB at room temperature under a constant current density of 20 mA cm−2. Panels b and c reproduced with permission from Ref. [72]. Copyright 2013, Elsevier
Fig. 3
Fig. 3
a Graphical illustration of how a lower degree of zinc plating uniformity potentially results in lower zinc-side electrode current densities. Reproduced with permission from Ref. [68]. Copyright 2016, Springer. b Digital photographs of (i, ii) GF and (iii, iv) thermally treated GF negative electrodes after the charging process; (i) and (iii) are taken from the membrane side, while (ii) and (iv) are taken from the current collector side. SEM images of (v–vii) GF and (viii–x) thermally treated GF negative electrodes following the charge process. The top, medium and bottom parts are taken from the parts on the membrane side, underneath the zinc layer, and on the current collector side, respectively. Reproduced with permission from Ref. [78]. Copyright 2018, Elsevier. c Illustration of zinc deposition on carbon cloth (CC) and carbon nanotube (CNT). Reproduced with permission from Ref. [79]. Copyright 2020, Wiley–VCH Verlag GmbH & Co. KGaA, Weinheim. d XRD results of the zinc anode electroplated with and without organic additives and commercialised zinc. e SEM images of synthesised anode with and without organic additives and commercialised zinc (magnification 5 k). CTAB, SDS, PEG, thiourea: Electroplated Zn using CTAB, SDS, PEG or thiourea containing electrolyte, respectively. Commercial: Commercial zinc foil material. No additive: Electroplated zinc without using any additive in the electroplating bath. f Cyclability of the batteries with zinc anode with organic additives and commercialised zinc foil. Estimated errors: ± 2.5%. Panels df reproduced with permission from Ref. [80]. Copyright 2017, American Chemical Society
Fig. 4
Fig. 4
Zn dendrite morphology and schematic illustration of Zn plating/stripping: a Optical microscope image of Zn dendrites on a cross section of Zn foil. b Photograph of a palm leaf, similar to the morphology of Zn dendrites. c Schematic illustration of morphology evolution for both the bare Zn–Zn cell and the PVB@Zn-PVB@Zn cell during repeated cycles of stripping/plating. d Cycling stability of Zn plating/stripping in both bare Zn and PVB@Zn symmetric cells, with the inset showing the initial voltage profiles of both cells. Panels ad reproduced with permission from Ref. [83]. Copyright 2020, WILEY-VCH Verlag GmbH & Co. KGaA, Weinheim
Fig. 5
Fig. 5
Polarisation test of Zn@CP electrode prepared via electrodeposition under various conditions: a 40 mA cm−2 deposition for 10 min, b 40 mA cm−2 deposition for 20 min, c 40 mA cm−2 deposition for 30 min, d 30 mA cm−2 deposition for 10 min, e 30 mA cm−2 deposition for 20 min, f 50 mA cm−2 deposition for 10 min, and g 60 mA cm−2 deposition for 10 min. Electrochemical performance of Zn@CP-50 and Zn plate electrodes under 1 mA cm−2 for various time durations: h 120 min, i 60 min, and j 30 min. Panels en reproduced with permission from Ref. [107]. Copyright 2020, American Chemical Society
Fig. 6
Fig. 6
a Schema of Zn2+ solvation structure and zinc surface passivation in H2O (left) and H2O–DMSO (right) solvents Galvanostatic. b Zn plating/stripping in Zn||Zn symmetrical cells at a current density of 0.5 mA cm−2 and a capacity of 0.5 mAh cm−2, c Zn plating/stripping CE in different electrolytes at 1 mA cm−2 and 0.5 mAh cm−2, and d voltage profiles of Zn plating/stripping processes at selected cycles in ZnCl2–H2O–dimethyl sulphoxide (DMSO) electrolytes. Panels ad reproduced with permission from Ref. [109]. Copyright 2020, American Chemical Society
Fig. 7
Fig. 7
Electrochemical characteristics of the catholyte at various SoCs for the first cycle of charge–discharge test: a Cyclic voltammetry (the potential scan started at 0.85 V forward and then backward with a scan rate of 500 mV s−1) and b electrochemical impedance spectroscopy analysis (measured under the frequency range of 10 kHz–10 mHz with potential perturbations of amplitude 10 mV). Panels a and b reproduced with permission from Ref. [124]. Copyright 2014, Elsevier Ltd. SEM images of c pristine GF, d GF-2 h and e GF-4 h, and cycling performance of a ZBFB with GF-2 h electrode. f Voltage versus time plot and g Columbic, voltage and energy efficiencies during the 50 charge–discharge cycles. Panels cg reproduced with permission from Ref [125]. Copyright 2017, Elsevier B.V
Fig. 8
Fig. 8
CV results of a Zn2+/Zn, and b Br2/Br redox reaction at a scan rate of 20 mV s−1 in 2 M ZnBr2 with and without 1 M MSA. c Charge–discharge profiles obtained at a current density of 40 mA cm−2. Panels ac reproduced with permission from Ref. [129]. Copyright 2018, Elsevier B.V. d Schematic diagram of a ZBSFB and e the used highly selective porous composite membrane with bromine capturing capacity. Panels d and e reproduced with permission from Ref. [130]. Copyright 2021, Elsevier Ltd
Fig. 9
Fig. 9
The charge–discharge curves of the Nafion/PP and SF-600-based ZBB single cells at a the first cycle and b the 19th cycle. c Coulombic, d voltage, and e energy efficiencies of the Nafion/PP and SF-600-based ZBB single cells with various current densities from 10 to 40 mA cm−2. f Coulombic, g voltage, and h energy efficiencies of the Nafion/PP and SF-600-based ZBB single cells with cycling at 20 mA cm−2. Panels ah reproduced with permission from Ref. [135]. Copyright 2017, Elsevier Ltd
Fig. 10
Fig. 10
a Typical zinc electrodeposition processes with the corresponding voltage response in the in situ EC-LPTEM test: (i–viii) image segmentations of a typical dendrite growth process of zinc electrodeposition and b the corresponding voltage response when applying the current during the zinc electrodeposition. The scale bar is 2 μm. Panels a and b reproduced with permission from Ref. [137]. Copyright 2021, American Chemical Society. c × 100 magnification morphologies of deposited zinc due to charge time and MEP∙Br concentrations for a given 2.0 M zinc–bromide electrolyte solution: (i) pristine, (ii) 0.3 M MEP∙Br, (iii) 0.6 M MEP∙Br, (iv) 0.9 M MEP∙Br and (v) 1.2 M MEP∙Br. d Charge–discharge curves (capacity vs. potential) of 5th cycle for pristine and 0.6 M MEP∙Br supported electrolyte, and e illustration of (i–iii) zinc dendrite growth process (in the case of pristine) and (iv–vi) electrostatic shielding process by MEP cations. Panels ce reproduced with permission from Ref. [122]. Copyright 2019, Elsevier B.V
Fig. 11
Fig. 11
a Schematic of a Zn–Br2 flow battery and b Schematic of the Zn–Br2 cell modelled by Lee and Selman (Eqs. 9 and 10), Lee (Eq. 11). Panels a and b reproduced with permission from Ref. [149]. Copyright 1987, The Electrochemical Society. c Schematic of a Zn–Br2 flow battery stack composed of 8 cells. d An equivalent circuit model corresponding to the schematic of (c). e Comparison of the modelling charge and discharge behaviours of a Zn–Br2 flow battery stack composed of 8 cells with the experimental data. Panels ce reproduced with permission from Ref. [151] Copyright 2019, MDPI
Fig. 12
Fig. 12
Schematic illustration of ZBRBs from device configuration, electrochemistry, material to performance evaluation

References

    1. Gür TM. Review of electrical energy storage technologies, materials and systems: challenges and prospects for large-scale grid storage. Energy Environ. Sci. 2018;11(10):2696–2767. doi: 10.1039/c8ee01419a. - DOI
    1. Leung P, Li XH, de Leon CP, Berlouis L, Low CTJ, et al. Progress in redox flow batteries, remaining challenges and their applications in energy storage. RSC Adv. 2012;2(27):10125–10156. doi: 10.1039/c2ra21342g. - DOI
    1. Chen C, Lee CS, Tang Y. Fundamental understanding and optimization strategies for dual-ion batteries: a review. Nano-Micro Lett. 2023;15(1):121. doi: 10.1007/s40820-023-01086-6. - DOI - PMC - PubMed
    1. Yang J, Yin B, Sun Y, Pan H, Sun W, et al. Zinc anode for mild aqueous zinc-ion batteries: challenges, strategies, and perspectives. Nano-Micro Lett. 2022;14(1):42. doi: 10.1007/s40820-021-00782-5. - DOI - PMC - PubMed
    1. Li X, Chen F, Zhao B, Zhang S, Zheng X, et al. Ultrafast synthesis of metal-layered hydroxides in a dozen seconds for high-performance aqueous Zn (micro-) battery. Nano-Micro Lett. 2023;15(1):32. doi: 10.1007/s40820-022-01004-2. - DOI - PMC - PubMed

LinkOut - more resources