. 2023 Oct 1;149(10):904-911.
doi: 10.1001/jamaoto.2023.2339.

The Global Otolaryngology-Head and Neck Surgery Workforce

Affiliations

The Global Otolaryngology-Head and Neck Surgery Workforce

Beatriz Petrucci et al. JAMA Otolaryngol Head Neck Surg. .

Abstract

Importance: A core component of delivering care of head and neck diseases is an adequate workforce. The World Health Organization report, Multi-Country Assessment of National Capacity to Provide Hearing Care, captured primary workforce estimates from 68 member states in 2012, noting that response rates were a limitation and that updated more comprehensive data are needed.

Objective: To establish comprehensive workforce metrics for global otolaryngology-head and neck surgery (OHNS) with updated data from more countries/territories.

Design, setting, and participants: A cross-sectional electronic survey characterizing the OHNS workforce was disseminated from February 10 to June 22, 2022, to professional society leaders, medical licensing boards, public health officials, and practicing OHNS clinicians.

Main outcome: The OHNS workforce per capita, stratified by income and region.

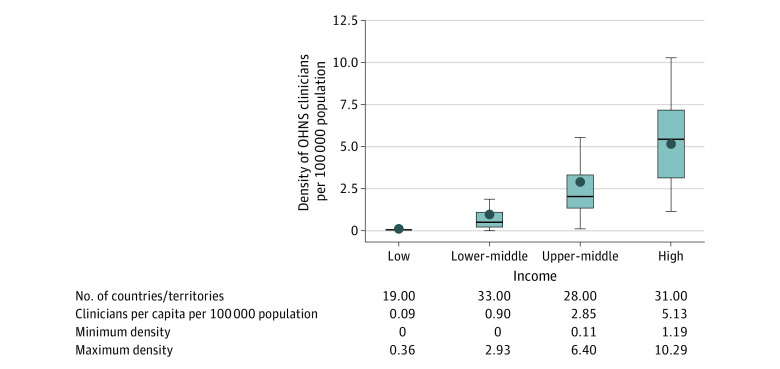
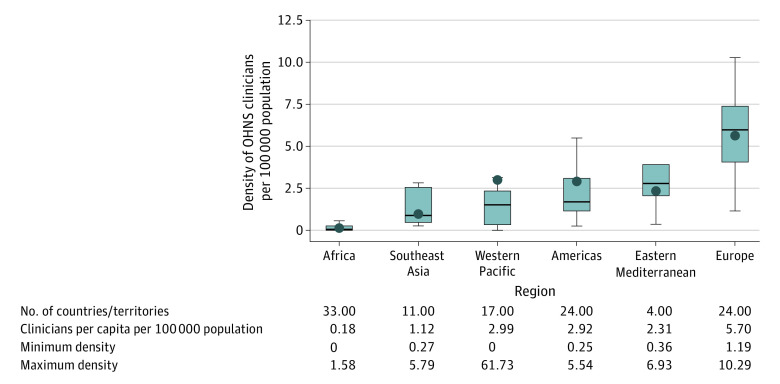
Results: Responses were collected from 121 of 195 countries/territories (62%). Survey responses specifically reported on OHNS workforce from 114 countries/territories representing 84% of the world's population. The global OHNS clinician density was 2.19 (range, 0-61.7) OHNS clinicians per 100 000 population. The OHNS clinician density varied by World Bank income group with higher-income countries associated with a higher density of clinicians. Regionally, Europe had the highest clinician density (5.70 clinicians per 100 000 population) whereas Africa (0.18 clinicians per 100 000 population) and Southeast Asia (1.12 clinicians per 100 000 population) had the lowest. The OHNS clinicians deliver most of the surgical management of ear diseases and hearing care, rhinologic and sinus diseases, laryngeal disorders, and upper aerodigestive mucosal cancer globally.

Conclusion and relevance: This cross-sectional survey study provides a comprehensive assessment of the global OHNS workforce. These results can guide focused investment in training and policy development to address disparities in the availability of OHNS clinicians.


Conflict of interest statement

Conflict of Interest Disclosures: None reported.

Figures

Figure 1.
Figure 1.. Otolaryngology–Head and Neck Surgery Ear, Nose, and Throat Clinicians Per Capita
Countries/territories in gray are without estimates.
Figure 2.
Figure 2.. Otolaryngology–Head and Neck Surgery (OHNS) Workforce Per Capita by World Bank Income Group
Range and quartiles represented by the box plot; outliers for the box plots are excluded. The horizontal line within the box represents the median value and the dot within the box represents the mean value. The top end of the box represents the 75th quartile and the bottom of the box represents the 25th quartile. The very top of the vertical line, indicated by the short horizontal bar, represents the maximum value. The very bottom of the vertical line, indicated by the short horizontal bar, represents the minimum value. Per capita by World Bank income group represented by the point in the box plot.
Figure 3.
Figure 3.. Otolaryngology–Head and Neck Surgery (OHNS) Workforce Per Capita by World Health Organization Region
Range and quartiles represented by the box plot; outliers for the box plots are excluded. The horizontal line within the box represents the median value and the dot within the box represents the mean value. The top end of the box represents the 75th quartile and the bottom of the box represents the 25th quartile. The very top of the vertical line, indicated by the short horizontal bar, represents the maximum value. The very bottom of the vertical line, indicated by the short horizontal bar, represents the minimum value. Per capita by World Health Organization region represented by the point in the box plot. The regional per capita of the Western Pacific region is outside of the IQR given exclusion of extreme outliers for the visualization using the box plots to show dispersion of these data.
Figure 4.
Figure 4.. Percentage of Countries/Territories in Which Otolaryngology–Head and Neck Surgeons (OHNS) Manage Most of the Disease Processes
ENT indicates ear, nose, and throat.

References

    1. Jamison DT, Gelband H, Horton S, et al. , eds. Disease Control Priorities: Improving Health and Reducing Poverty. International Bank for Reconstruction and Development/The World Bank; 2017. - PubMed
    1. Meara JG, Leather AJ, Hagander L, et al. Global Surgery 2030: evidence and solutions for achieving health, welfare, and economic development. Surgery. 2015;158(1):3-6. doi: 10.1016/j.surg.2015.04.011 - DOI - PubMed
    1. Shrime MG, Bickler SW, Alkire BC, Mock C. Global burden of surgical disease: an estimation from the provider perspective. Lancet Glob Health. 2015;3(suppl 2):S8-S9. doi: 10.1016/S2214-109X(14)70384-5 - DOI - PubMed
    1. McColl E. Best practice in symptom assessment: a review. Gut. 2004;53(Suppl 4)(suppl 4):iv49-iv54. doi: 10.1136/gut.2003.034355 - DOI - PMC - PubMed
    1. Global Strategy on Human Resources for Health: Workforce 2030. World Health Organization; 2016.

Publication types