. 2023 Aug 31;8(19):e170148.
doi: 10.1172/jci.insight.170148.

The unfolded protein response links ER stress to cancer-associated thrombosis

Affiliations

The unfolded protein response links ER stress to cancer-associated thrombosis

Oluwatoyosi Muse et al. JCI Insight. .

Abstract

Thrombosis is a common complication of advanced cancer, yet the cellular mechanisms linking malignancy to thrombosis are poorly understood. The unfolded protein response (UPR) is an ER stress response associated with advanced cancers. A proteomic evaluation of plasma from patients with gastric and non-small cell lung cancer who were monitored prospectively for venous thromboembolism demonstrated increased levels of UPR-related markers in plasma of patients who developed clots compared with those who did not. Release of procoagulant activity into supernatants of gastric, lung, and pancreatic cancer cells was enhanced by UPR induction and blocked by antagonists of the UPR receptors inositol-requiring enzyme 1α (IRE1α) and protein kinase RNA-like endoplasmic reticulum kinase (PERK). Release of extracellular vesicles bearing tissue factor (EVTFs) from pancreatic cancer cells was inhibited by siRNA-mediated knockdown of IRE1α/XBP1 or PERK pathways. Induction of UPR did not increase tissue factor (TF) synthesis, but rather stimulated localization of TF to the cell surface. UPR-induced TF delivery to EVTFs was inhibited by ADP-ribosylation factor 1 knockdown or GBF1 antagonism, verifying the role of vesicular trafficking. Our findings show that UPR activation resulted in increased vesicular trafficking leading to release of prothrombotic EVTFs, thus providing a mechanistic link between ER stress and cancer-associated thrombosis.

Keywords: Cancer; Hematology; Thrombosis.


Conflict of interest statement

Conflict of interest: JIZ and RF are named inventors on a provisional patent titled “COMPOSITIONS AND METHODS FOR IDENTIFYING AND MODULATING THROMBOTIC CONDITIONS IN A CANCER PATIENT.”

Figures

Figure 1
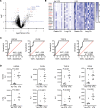
Figure 1. Plasma from patients with cancer who develop VTE is enriched in UPR-related analytes.
Plasma samples were collected from 20 patients with gastric cancer and 19 patients with non–small cell lung cancer. Patients were followed prospectively for the development of VTE, which developed in 10 patients with gastric cancer and 9 patients with lung adenocarcinoma. (A) A volcano plot of 7,596 analytes tested using the SomaScan platform. Analytes that were significantly different (P < 6.6 × 10⁻⁶) between patients who developed VTE and those who did not are shown in red. Of these, 18 showed a greater than 2-fold difference between VTE and non-VTE, and the 4 shown in blue are UPR-related proteins. CLGN, calmegin; TXNDC15, thioredoxin domain containing 15 (or TMX5); RCN1, reticulocalbin 1. (B) The 18 proteins that were significantly elevated by >2-fold are shown in a heatmap that presents data for each patient normalized to the average value for that protein. Outliers are shown in white. (C) ROC curves of the 4 UPR-related proteins. (D) Values in patients who had no VTE over the observation period (no VTE) compared with those who went on to develop VTE (VTE) for UPR-related analytes for patients with gastric and non–small cell lung cancer are indicated (P values were obtained using a 2-tailed t test).
Figure 2
Figure 2. Induction of UPR results in increased TF activity in the supernatants of several adenocarcinoma cell lines.
Human gastric cell adenocarcinoma (AGS), human lung adenocarcinoma cells (A549), and human pancreatic adenocarcinoma cells (HPAF-II and BxPC3) were exposed to 2.5 mg/mL tunicamycin for 4 hours. Supernatants were collected following this incubation, cleared, and subjected to serial centrifugation. The pellet was washed and evaluated for TF using a factor Xa generation assay (A) and thrombin generation (B). Thrombin generation was calculated based on the quantification of Vmax as described in Supplemental Methods. ****P < 0.0001, **P < 0.01 (P values obtained using a 2-tailed t test).
Figure 3
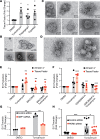
Figure 3. UPR induction in pancreatic cancer cells stimulates production of TF-bearing EVs.
(A) HPAF-II cells were exposed to vehicle (DMSO), tunicamycin (2.5 mg/mL), thapsigargin (0.8 μM), or triptolide (0.2 μM) for 4 hours. Supernatants were collected and EVs isolated as described in the Methods. EVs were subsequently stained for TF and evaluated by flow cytometry. Error bars represent the mean ± SEM of 4 samples. *P < 0.01 (1-way ANOVA). (B) EVs isolated from HPAF-II cells following exposure to 2.5 mg/mL tunicamycin for 4 hours and evaluated using transmission electron microscopy (TEM). (C and D) EVs were generated and isolated as described in B and subsequently stained for CD9 (C) and TF (D). (E and F) HPAF-II cells were exposed to either 5 μM IRE1α inhibitor MKC3946 (E) or 1 μM of PERK inhibitor GSK2606414 (F) for 1 hour followed by 2.5 mg/mL tunicamycin for 4 hours. Supernatants were collected and EVs evaluated for binding of annexin V or anti-TF antibody using flow cytometry. Error bars represent the mean ± SEM of 4 samples. **P < 0.005, ***P < 0.001 (1-way ANOVA). Statistically significance differences were observed for EV TF expression between tunicamycin and DMSO, tunicamycin and MKC3946 or GSK2606414 alone, and tunicamycin alone and the presence of MKC3946 or GSK2606414 with tunicamycin. HPAF-II cells were exposed to 40 nM of either control siRNA or siRNA directed at (G) XBP1 or (H) PERK for 72 hours and subsequently exposed to vehicle or tunicamycin. EVs were isolated from supernatants and evaluated for thrombin generation. Error bars represent the mean ± SEM of 9 samples, *P = 0.01 (1-way ANOVA).
Figure 4
Figure 4. UPR induces procoagulant EVs from pancreatic cancer cells.
(A and B) EVs were isolated from the supernatants of HPAF-II cells exposed to vehicle (DMSO) or 2.5 mg/mL tunicamycin. Isolated EVs were incubated with nonimmune IgG, (A) anti-TF antibody (IIID8), or (B) anti-FXIIa antibody (3F7) prior to evaluation of thrombin generation. Error bars represent the mean ± SEM of 3 samples, ****P < 0.0001, **P < 0.01, *P = 0.01 (1-way ANOVA). (C and D) BxPC3 cells were incubated with either 5 μM MKC3946 (C) or 1 μM GSK2606414 (D) for 4 hours and subsequently exposed to DMSO (Control) or 2.5 mg/mL tunicamycin (TM). EVs were isolated from supernatants and incubated with either nonimmune IgG or anti-TF antibody prior to evaluation of thrombin generation. Error bars represent the mean ± SEM of 3 samples, ****P ≤ 0.0001, ***P < 0.001 (1-way ANOVA). (E) HPAF-II cells were incubated with either 1 μM GSK2606414 or 5 μM MKC3946 for 1 hour prior to incubation with 2.5 mg/mL tunicamycin. EVs were isolated, lysed, and evaluated for protein concentration. Equal concentrations of proteins within EV lysates were subsequently separated by SDS-PAGE and analyzed for TF using Western blot analysis. Loading of total protein was assessed using Instant Blue (left panel). Quantification of 3 independent experiments (right panel). **P < 0.01, *P = 0.01 (1-way ANOVA).
Figure 5
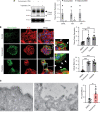
Figure 5. Induction of the UPR enhances cell surface TF expression.
(A) HPAF-II cells were incubated in the presence of vehicle (DMSO), 2.5 mg/mL tunicamycin, or 0.2 μM triptolide for 4 hours. TF in cells was then analyzed by Western blot analysis (left panel) and quantified using densitometry (right panel). GAPDH was used as a loading control. Glycosylated (upper bands; black arrow) and deglycosylated (lower bands; gray arrow) TF were analyzed separately. *P = 0.01 (1-way ANOVA). (B) HPAF-II cells were exposed to DMSO (Control), 2.5 mg/mL tunicamycin, or 0.2 μM triptolide for 4 hours. Cells were then washed, fixed, permeabilized, and stained with antibody directed at TF (green), PE-phalloidin (red), and DAPI (blue). Cells were subsequently evaluated using 3-color immunofluorescence confocal microscopy. Arrows in magnified insets show TF-rich, actin-poor blebs. The graphs to the right represent the quantification of TF intensity and the percentage of cellular blebs as indicated. **P < 0.01, ***P < 0.001, ****P < 0.0001 (1-way ANOVA). (C) HPAF-II cells were grown on grids and subsequently exposed to vehicle (DMSO) or 2.5 tunicamycin for 4 hours. Cells were washed and fixed. Fixed cells were stained with anti-TF antibody (IIID8) followed by immunogold-labeled secondary IgG and evaluated by TEM as described in the Methods. The graph to the right shows quantification of TF on the cell membrane (gold particle number per micron of membrane). **P < 0.01 (2-tailed t test).
Figure 6
Figure 6. UPR does not mediate increased TF synthesis but promotes thrombin generation at the surface of pancreatic cancer cells.
(A) HPAF-II cells were incubated with either 5 μM MKC3946 or 1 μM GSK2606414 for 1 hour prior to exposure to 2.5 mg/mL tunicamycin or vehicle (DMSO) for 4 hours. After a 1-hour incubation, cells were lysed and TF transcript levels quantified using quantitative PCR. (B and C) HPAF-II cells were incubated in the presence of vehicle. Not significant (1-way ANOVA). (B) MKC3946 or (C) GSK2606414 for 1 hour prior to stimulation with either vehicle (DMSO) or 2.5 mg/mL tunicamycin for 4 hours. TF in cells was then analyzed by Western blot analysis. (D) HPAF-II cells were exposed to 2.5 mg/mL tunicamycin for 4 hours. The supernatant was removed, cells were washed, and cells’ surface factor Xa (FXa) activity was evaluated using a FXa assay as described in Supplemental Methods. Error bars represent the mean ± SEM of 3 samples, **P < 0.005, ***P < 0.001, ****P < 0.0001 (1-way ANOVA). (E and F) HPAF-II cells were exposed to either 5 μM MKC3946 (E) or 1 μM GSK2606414 for 1 hour (F) followed by 2.5 mg/mL tunicamycin for 4 hours. The supernatant was removed, cells were washed, and thrombin generation on cells’ surfaces was evaluated. Error bars represent the mean ± SEM. ****P ≤ 0.0001, ***P < 0.0005, *P = 0.01 (1-way ANOVA).
Figure 7
Figure 7. UPR-induced production of procoagulant EVs involves ER to Golgi transport.
(A) HPAF-II or (B) BxPC3 cells were incubated with vehicle (DMSO) or brefeldin A for 1 hour prior to stimulation with vehicle (DMSO) or 2.5 mg/mL tunicamycin for 4 hours before analysis of TF in EVs. (C) HPAF-II cells were exposed to 3 μM brefeldin A for 1 hour followed by 2.5 mg/mL tunicamycin or DMSO for 4 hours. EVs were isolated from supernatants and evaluated using annexin V or anti-TF antibodies by flow cytometry. Error bars represent the mean ± SEM of 3 samples, *P < 0.01, ***P < 0.001 (1-way ANOVA). (D) HPAF-II cells were exposed to 3 μM brefeldin A for 1 hour followed by 2.5 mg/mL tunicamycin or DMSO for 4 hours. EVs were isolated from supernatants and incubated in the presence of nonimmune IgG or IgG directed at TF (IIID8). Samples were subsequently evaluated for thrombin generation. Error bars represent the mean ± SEM of 3 samples, ****P ≤ 0.0001 (1-way ANOVA). (E) HPAF-II cells were exposed to 1.5 μM Golgicide A for 1 hour then 2.5 mg/mL tunicamycin or vehicle (DMSO) for 4 hours. EVs were isolated from supernatants and subsequently evaluated for thrombin generation. Error bars represent the mean ± SEM of 3 samples, **P < 0.01, ***P < 0.001 (1-way ANOVA). (F) HPAF-II cells were exposed to 40 nM of either control siRNA or siRNA directed at Arf1 for 48 hours and subsequently exposed to either DMSO or 2.5 mg/mL tunicamycin for 4 hours. EVs were isolated from supernatants and evaluated for thrombin generation. Error bars represent the mean ± SEM of 3 samples, ****P ≤ 0.0001 (1-way ANOVA). (G) Schematic model of TF trafficking to the cell surface and to EVs following activation of the UPR in pancreatic adenocarcinoma cells. Increased protein translation with malignant transformation results in increased abundance of unfolded proteins, activation of ER stress receptors, and increased TF trafficking.

Similar articles

Cited by

References

    1. Canale ML, et al. Arterial thrombosis in cancer: spotlight on the neglected vessels. Anticancer Res. 2019;39(9):4619–4625. doi: 10.21873/anticanres.13642. - DOI - PubMed
    1. Zwicker JI, et al. Cancer-associated thrombosis. Crit Rev Oncol Hematol. 2007;62(2):126–136. doi: 10.1016/j.critrevonc.2007.01.001. - DOI - PubMed
    1. Navi BB, et al. Arterial thromboembolic events preceding the diagnosis of cancer in older persons. Blood. 2019;133(8):781–789. doi: 10.1182/blood-2018-06-860874. - DOI - PMC - PubMed
    1. Khorana AA, et al. Thromboembolism is a leading cause of death in cancer patients receiving outpatient chemotherapy. J Thromb Haemost. 2007;5(3):632–634. doi: 10.1111/j.1538-7836.2007.02374.x. - DOI - PubMed
    1. Abdol Razak NB, et al. Cancer-associated thrombosis: an overview of mechanisms, risk factors, and treatment. Cancers (Basel) 2018;10(10):380. doi: 10.3390/cancers10100380. - DOI - PMC - PubMed

Publication types

MeSH terms