. 2023 Oct 9;8(19):e171701.
doi: 10.1172/jci.insight.171701.

A lipid-associated macrophage lineage rewires the spatial landscape of adipose tissue in early obesity

Affiliations

A lipid-associated macrophage lineage rewires the spatial landscape of adipose tissue in early obesity

Cooper M Stansbury et al. JCI Insight. .

Abstract

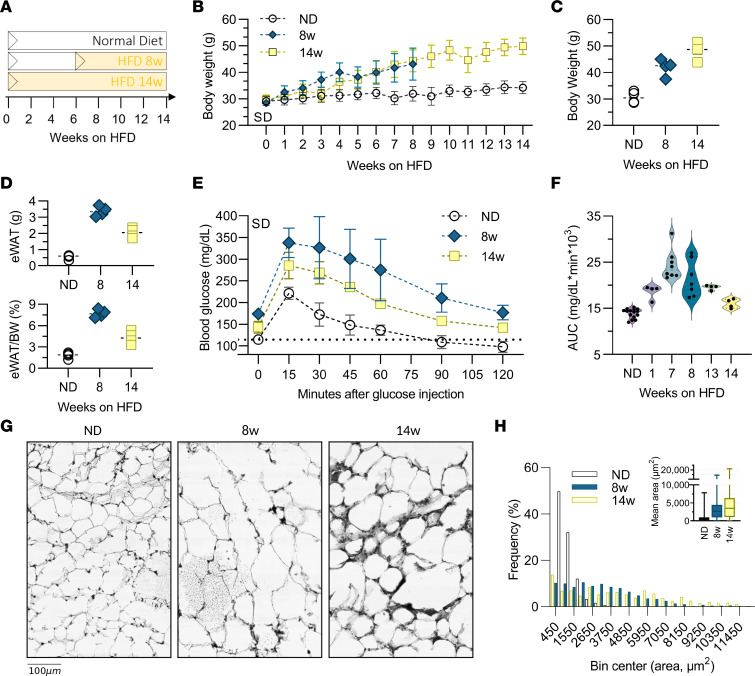
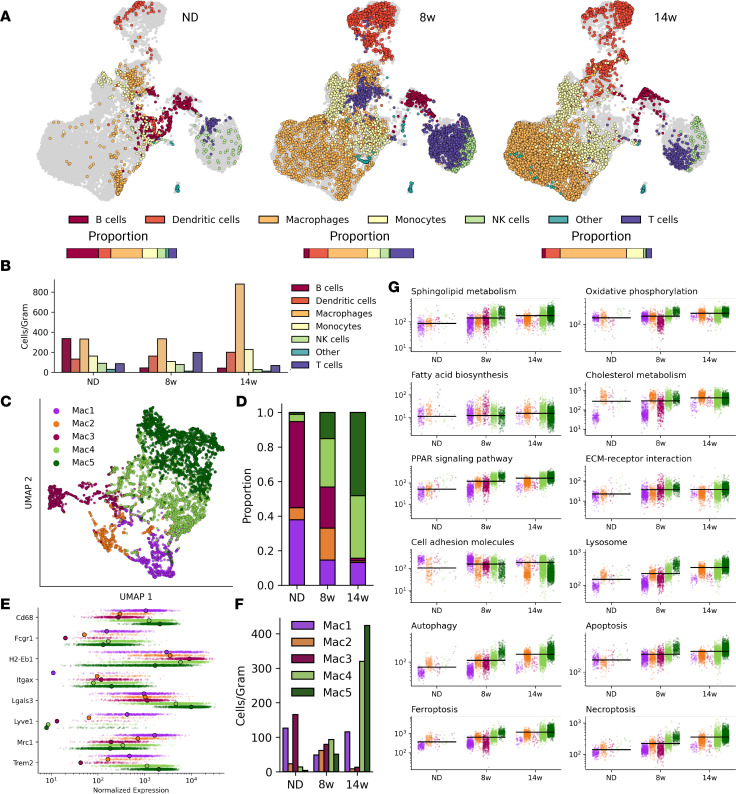
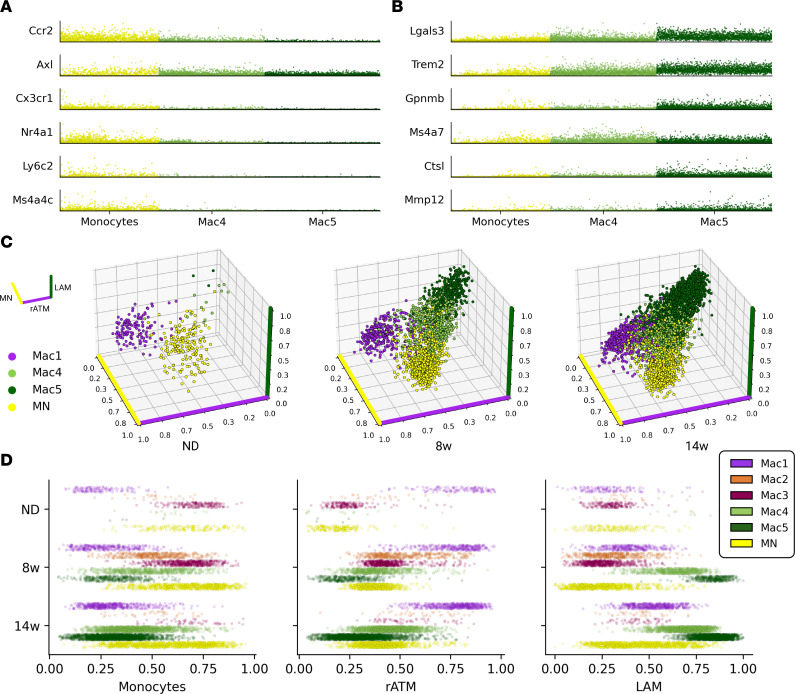
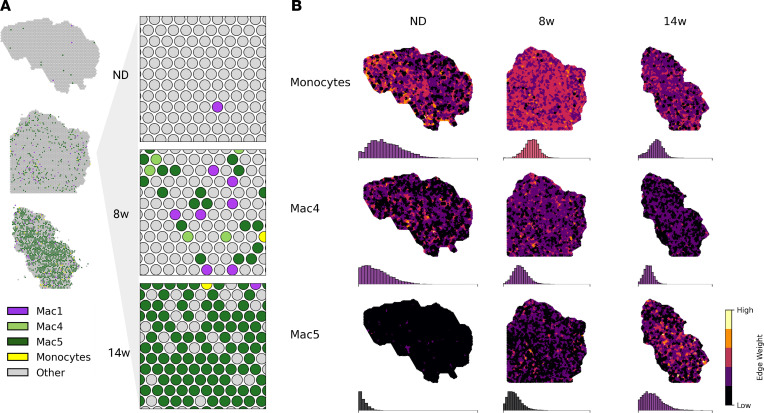
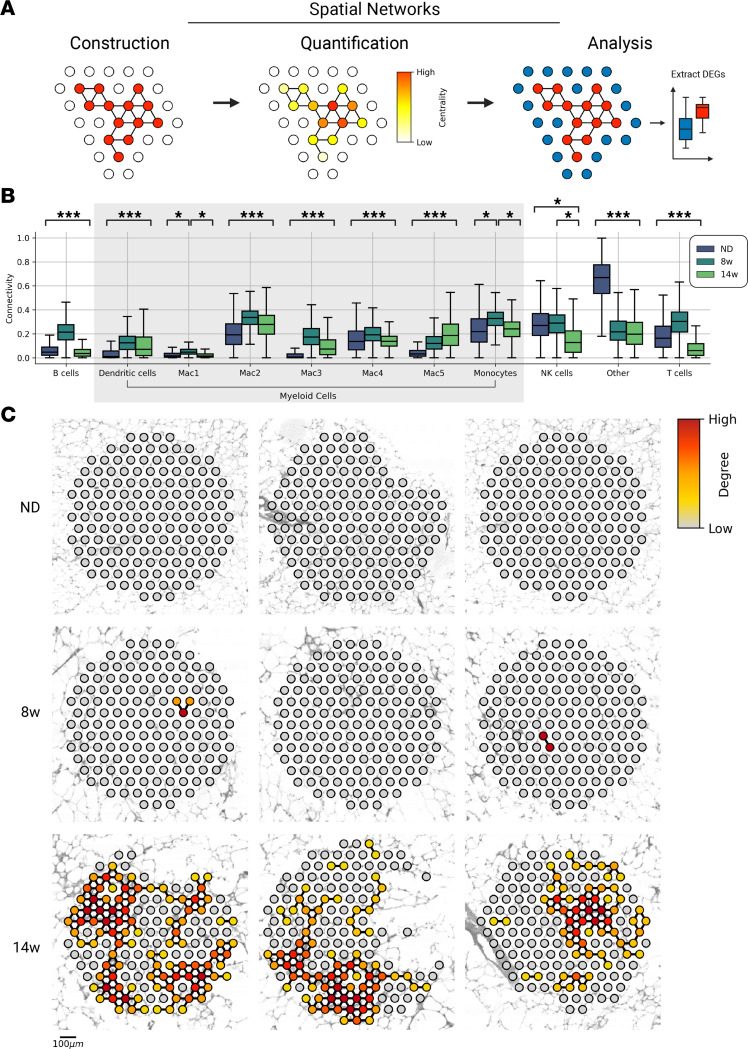
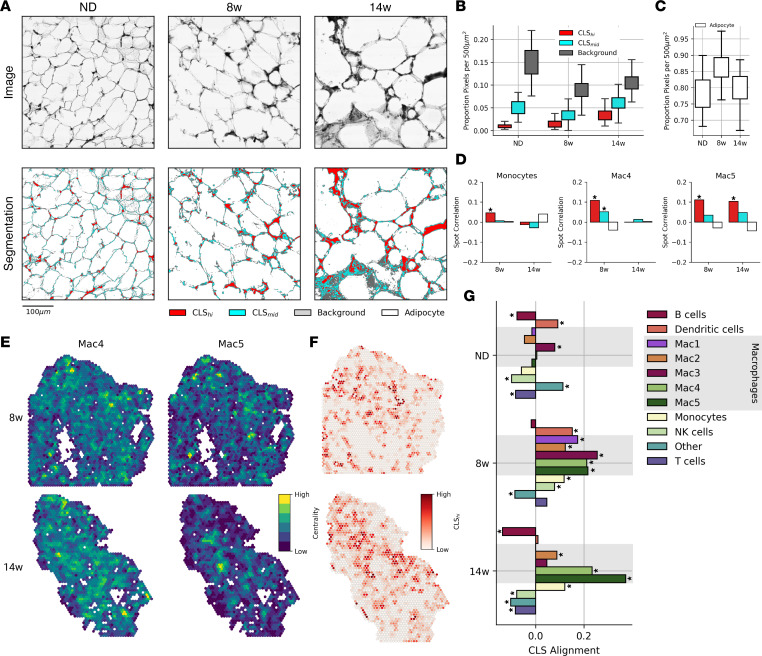
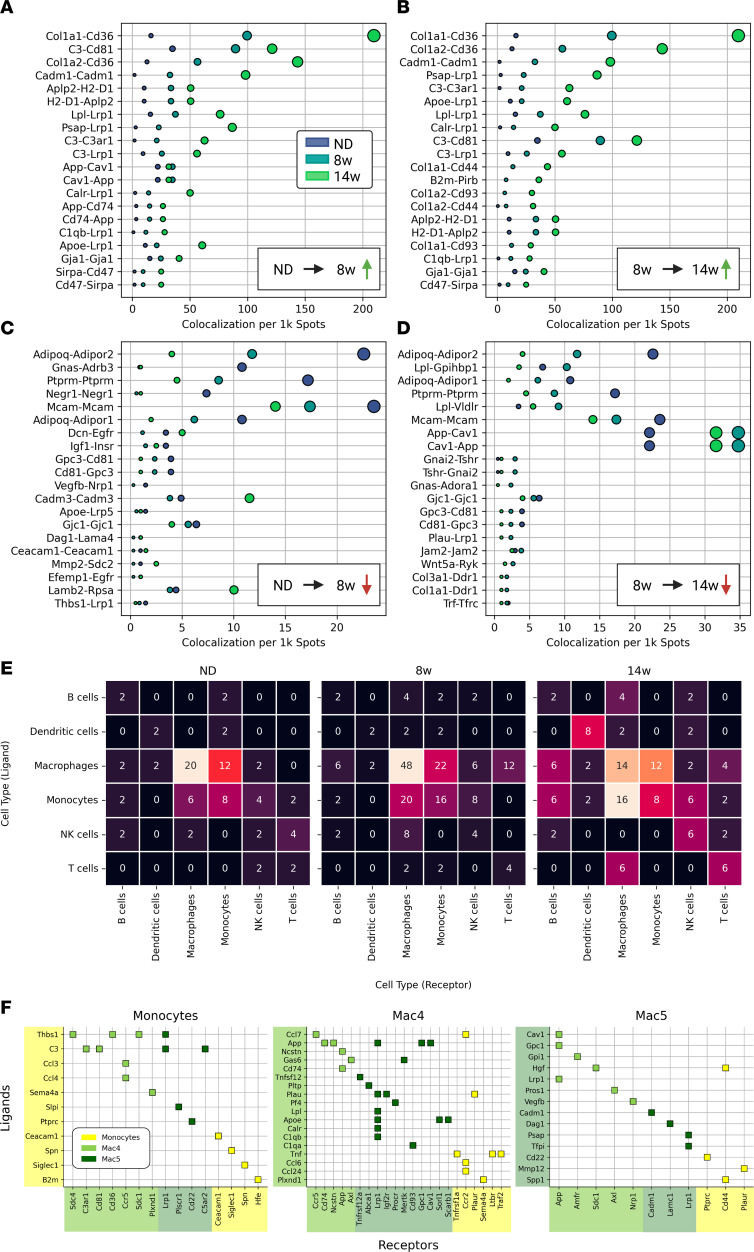
Adipose tissue macrophage (ATM) infiltration is associated with adipose tissue dysfunction and insulin resistance in mice and humans. Recent single-cell data highlight increased ATM heterogeneity in obesity but do not provide a spatial context for ATM phenotype dynamics. We integrated single-cell RNA-Seq, spatial transcriptomics, and imaging of murine adipose tissue in a time course study of diet-induced obesity. Overall, proinflammatory immune cells were predominant in early obesity, whereas nonresident antiinflammatory ATMs predominated in chronic obesity. A subset of these antiinflammatory ATMs were transcriptomically intermediate between monocytes and mature lipid-associated macrophages (LAMs) and were consistent with a LAM precursor (pre-LAM). Pre-LAMs were spatially associated with early obesity crown-like structures (CLSs), which indicate adipose tissue dysfunction. Spatial data showed colocalization of ligand-receptor transcripts related to lipid signaling among monocytes, pre-LAMs, and LAMs, including Apoe, Lrp1, Lpl, and App. Pre-LAM expression of these ligands in early obesity suggested signaling to LAMs in the CLS microenvironment. Our results refine understanding of ATM diversity and provide insight into the dynamics of the LAM lineage during development of metabolic disease.

Keywords: Adipose tissue; Macrophages; Metabolism; Obesity.


Conflict of interest statement

Conflict of interest: The authors have declared that no conflict of interest exists.

Figures

Figure 1
Figure 1. Diet-induced obesity and adipose tissue remodeling.
(A) Time course for mice fed a 60% HFD for 8 weeks (8w) or 14 weeks (14w) versus ND controls. (B) Total BW by week on HFD. (C) Final BW at time of tissue collection. (D) eWAT weight (top) and eWAT as a percentage of BW (bottom). (E) Glucose measurements in cohorts 1 week prior to endpoint tissue collection. (F) GTT data showing AUC. (G) H&E-stained adipose tissue sections of eWAT from cohorts. (H) Frequency distribution and average adipocyte size in eWAT from cohorts. (BE) For each group, n = 4. (F) For HFD-fed mice, n = 4–8 mice per group; for ND, n = 15 mice.
Figure 2
Figure 2. Single-cell data on macrophage phenotypes in obesity.
(A) Immune-cell population changes over the course of diet-induced obesity. (B) The number of cells per gram of adipose tissue for each cell type in each diet condition. (C) UMAP visualization of ATM clusters from scRNA-Seq data. (D) Proportions of each ATM cluster at each time point. (E) Expression of key genes across ATM subtypes. Large points represent mean expression for the subtype. (F) ATM subtypes per gram of tissue sampled for each diet condition. (G) Changes in mean expression of genes in select Kyoto Encyclopedia of Genes and Genomes pathways in the macrophage subpopulations. Black lines represent mean macrophage expression of pathway genes in each diet condition. 8w, 8 weeks; 14w, 14 weeks; ECM, extracellular matrix.
Figure 3
Figure 3. Emergence of the LAM phenotype.
(A) Normalized expression of MN marker genes for key myeloid cell types. (B) Normalized expression of LAM marker genes for key myeloid cell types. (C) 3D profiling of MNs, resident ATMs (Mac1), and LAMs (Mac4, Mac5). Cell position represents simultaneous Pearson correlation with gene expression signatures derived from MNs (yellow axis), resident ATMs (rATM; purple axis), and LAMs (green axis). (D) Macrophage subtype correlations with MN, rATM, and LAM expression signatures for each diet condition. 8w, 8 weeks; 14w, 14 weeks.
Figure 4
Figure 4. Spatial patterning of the MN-LAM lineage.
(A) Overview of CARD-predicted cell-type proportions for myeloid cell types over the course of HFD feeding. (B) Spatial patterning of MNs, pre-LAMs (Mac4) and LAMs (Mac5) over the course of HFD feeding. Edge weights are the harmonic mean of CARD proportions for neighboring capture spots. Histograms show the distribution of edge weights for the whole tissue section and are colored according to the mean edge weight on the same color scale. 8w, 8 weeks; 14w, 14 weeks.
Figure 5
Figure 5. LAM networks are hubs of cell death.
(A) Workflow schematic. Network models are defined on the basis of properties of neighboring tissue spots. Analysis of network structure reveals principals of tissue organization. Differential expression analysis may be used to characterize the transcriptional signature of niches. (B) Connectivity of tissue-wide networks for all immune-cell types over time. Connectivity is the distribution of network edge weights, defined as the harmonic mean of CARD-predicted proportions between neighboring spots. ***P = 0.01 by Student’s t test for comparison between each time point (i.e., ND vs. 8 weeks [8w], 8w vs. 14 weeks [14w], and ND vs. 14w); *P ≤ 0.01 for specific comparison. (C) Nine randomly sampled 150-node networks based on LAM signature (Mac5) over time. DEG, differentially expressed gene.
Figure 6
Figure 6. Histological quantification of CLSs.
(A) H&E-stained images captured during spatial transcriptomics library preparation (top) and segmentation results quantifying CLSs (bottom). (B) Segmentation class label proportions of 100 randomly sampled 500 μm regions from each diet condition. (C) Adipocyte area from images regions in B. (D) Spot correlation between myeloid cell-type proportions and segmentation results from a 150 μm region around each capture spot. Spots with read counts below the 0.05 quantile were removed. *P ≤ 0.01 by Pearson correlation. (E) Spot importance in global cell-type networks (eigenvector centrality) in HFD feeding conditions. Eigenvector centrality highlights regions of densely localized cells in the tissue. (F) CLShi segmentation results in 150 μm regions around each capture spot at 8 weeks (8w) and 14 weeks (14w). (G) CLS alignment represents the Pearson correlation between CLShi segmentation results and cell type–specific eigenvector centrality for each diet condition. *P ≤ 0.01 by Pearson correlation. Spots with read counts below the 0.05 quantile were removed.
Figure 7
Figure 7. eWAT LR signaling dynamics.
(A) LR pairs with most increased colocalization during the first 8 weeks (8w) of HFD feeding. Dot sizes are LR colocalization per 1000 (1k) capture spots (same as x axis) and dot colors indicate diet condition. (B) LR pairs with most increased colocalization during the last 6 weeks of HFD feeding. (C) LR pairs with most decreased colocalization during the first 8 weeks of HFD feeding. (D) LR pairs with most decreased colocalization during last 6 weeks of HFD feeding. (E) Counts of colocalized cell type–specific LR pairs with log fold change > 1 in each diet condition. (F) Differentially expressed myeloid LR pairs using Wilcoxon rank-sum test (α = 0.05, Bonferroni corrected) with nonzero colocalization in spatial data. 14w, 14 weeks.

References

    1. Lumeng CN, et al. Increased inflammatory properties of adipose tissue macrophages recruited during diet-induced obesity. Diabetes. 2007;56(1):16–23. doi: 10.2337/db06-1076. - DOI - PubMed
    1. Lumeng CN, et al. Phenotypic switching of adipose tissue macrophages with obesity is generated by spatiotemporal differences in macrophage subtypes. Diabetes. 2008;57(12):3239–3246. doi: 10.2337/db08-0872. - DOI - PMC - PubMed
    1. Muir LA, et al. Frontline Science: rapid adipose tissue expansion triggers unique proliferation and lipid accumulation profiles in adipose tissue macrophages. J Leukoc Biol. 2018;103(4):615–628. doi: 10.1002/JLB.3HI1017-422R. - DOI - PMC - PubMed
    1. Muir LA, et al. Human CD206+ macrophages associate with diabetes and adipose tissue lymphoid clusters. JCI Insight. 2022;7(3):e146563. doi: 10.1172/jci.insight.146563. - DOI - PMC - PubMed
    1. Bäckdahl J, et al. Spatial mapping reveals human adipocyte subpopulations with distinct sensitivities to insulin. Cell Metab. 2021;33(9):1869–1882. doi: 10.1016/j.cmet.2021.07.018. - DOI - PubMed

Publication types