. 2023 Oct 16;133(20):e161366.
doi: 10.1172/JCI161366.

Endothelial VEGFR2-PLCγ signaling regulates vascular permeability and antitumor immunity through eNOS/Src

Affiliations

Endothelial VEGFR2-PLCγ signaling regulates vascular permeability and antitumor immunity through eNOS/Src

Elin Sjöberg et al. J Clin Invest. .

Abstract

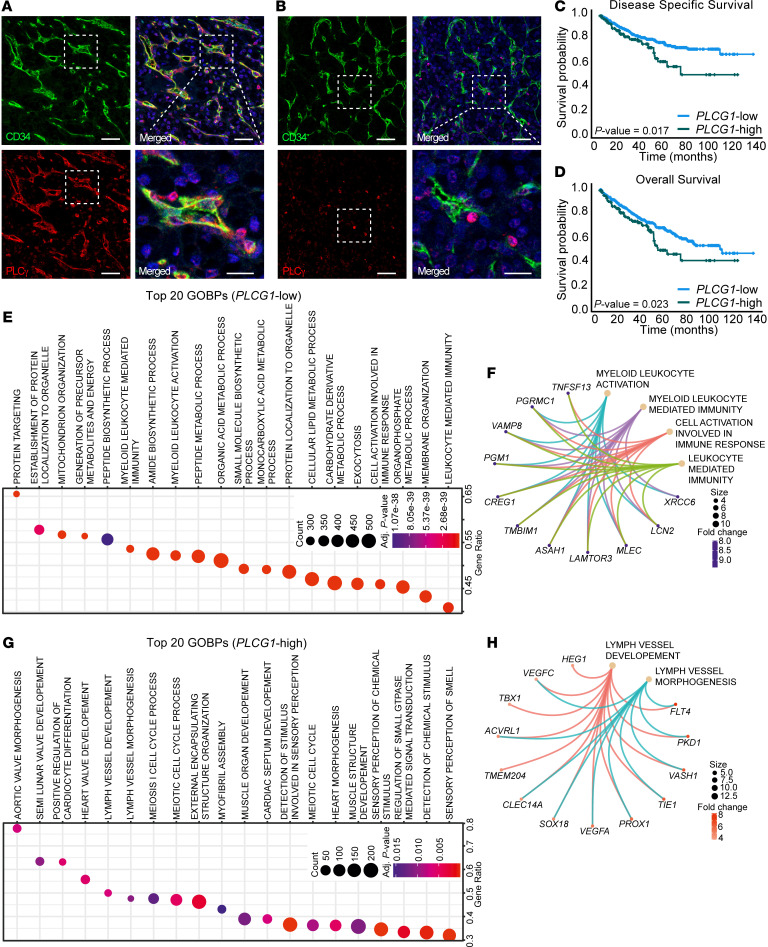
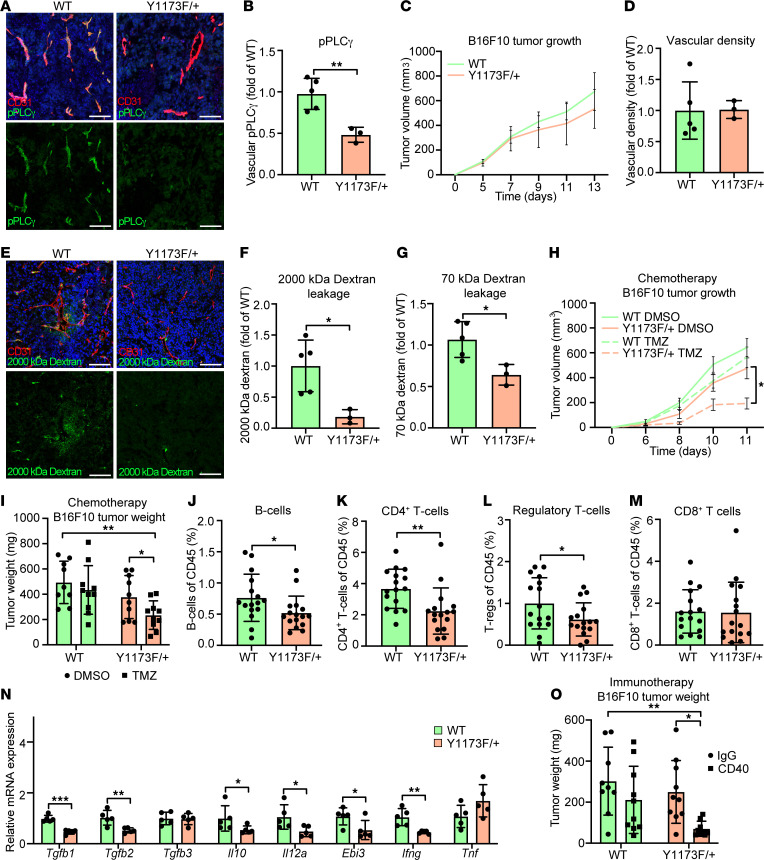
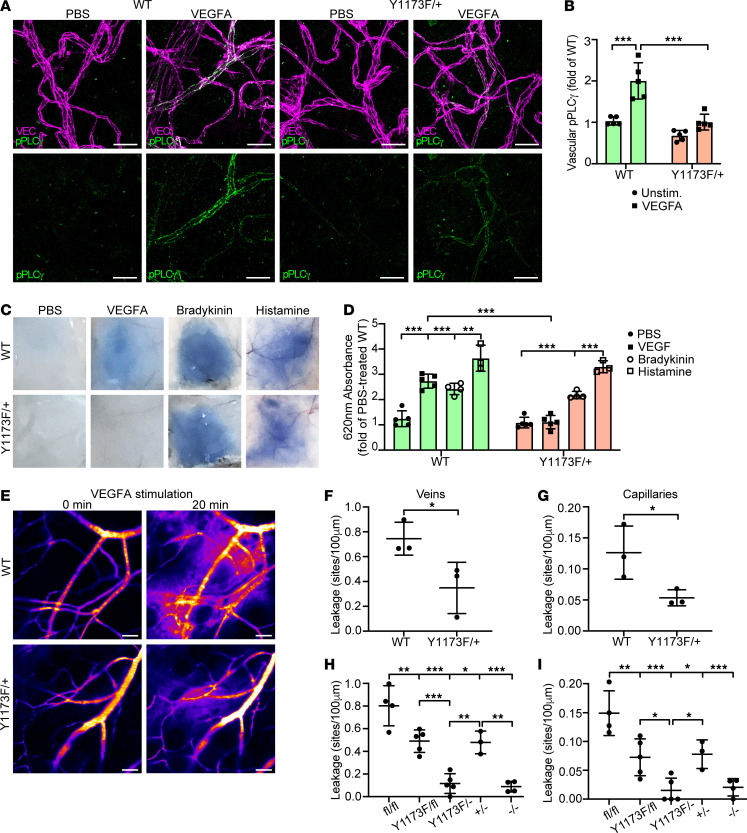
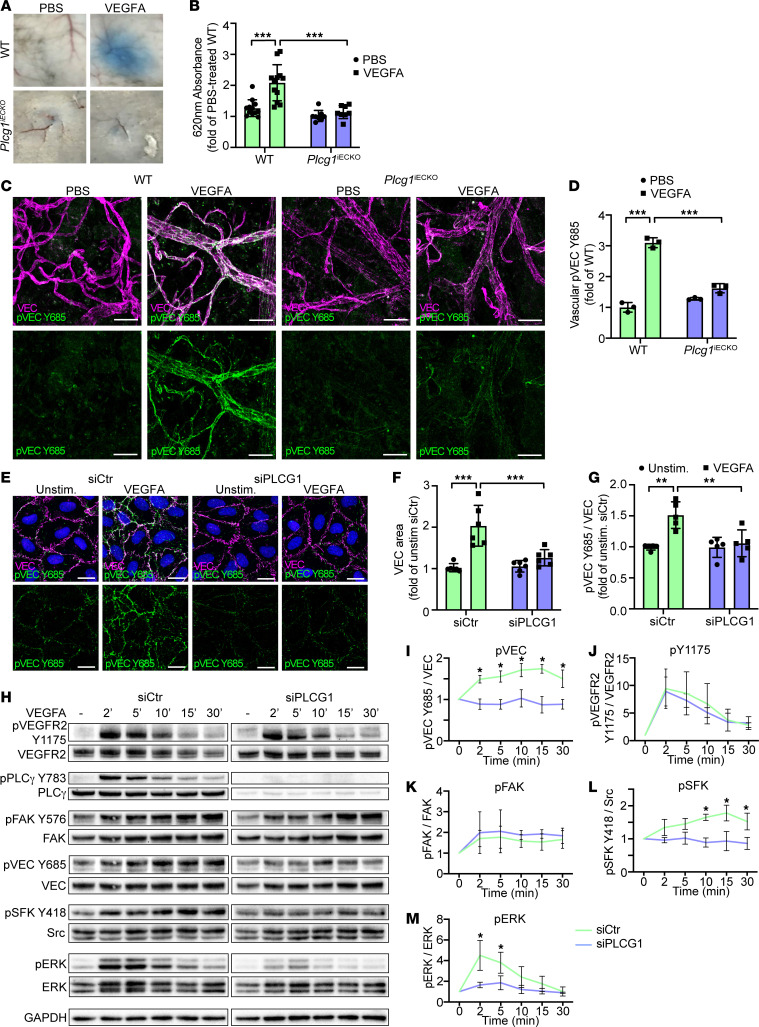
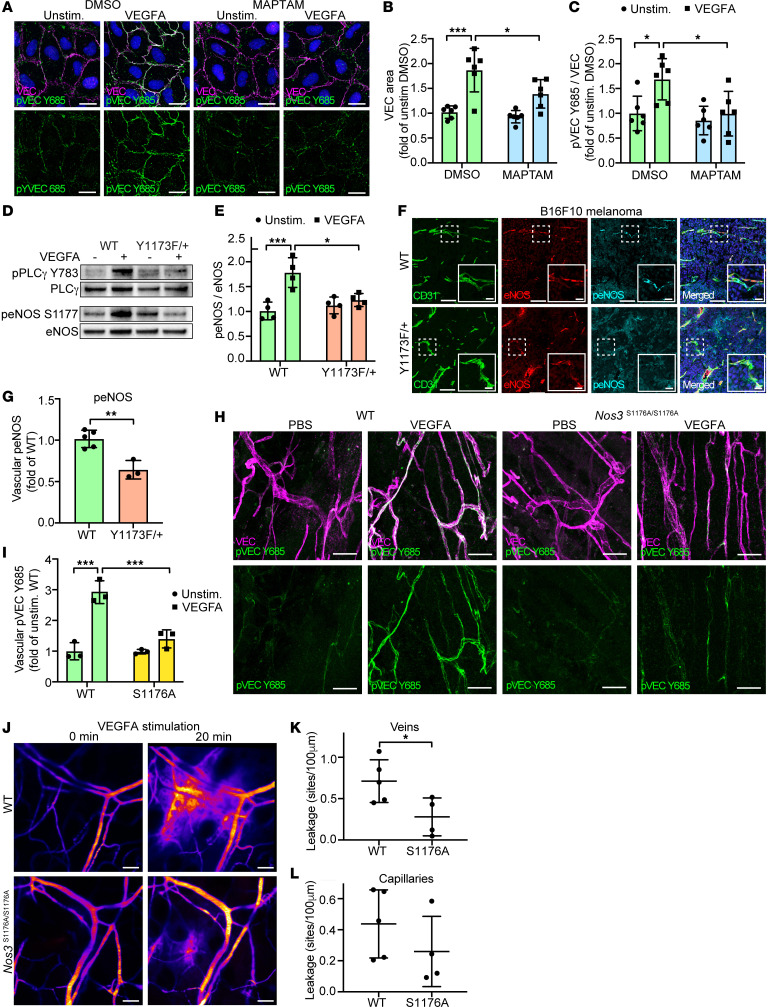
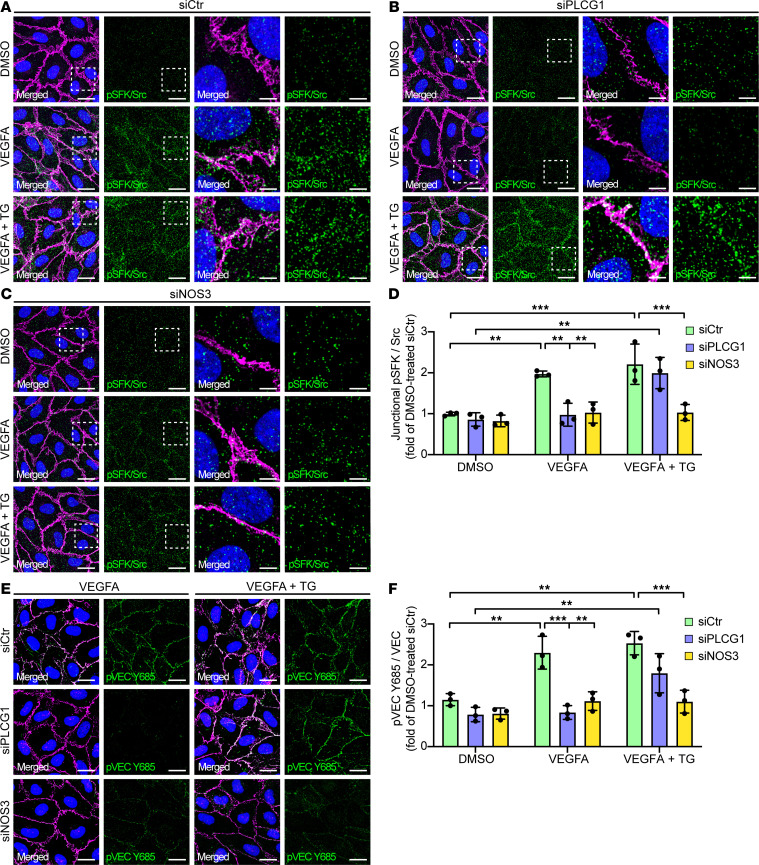
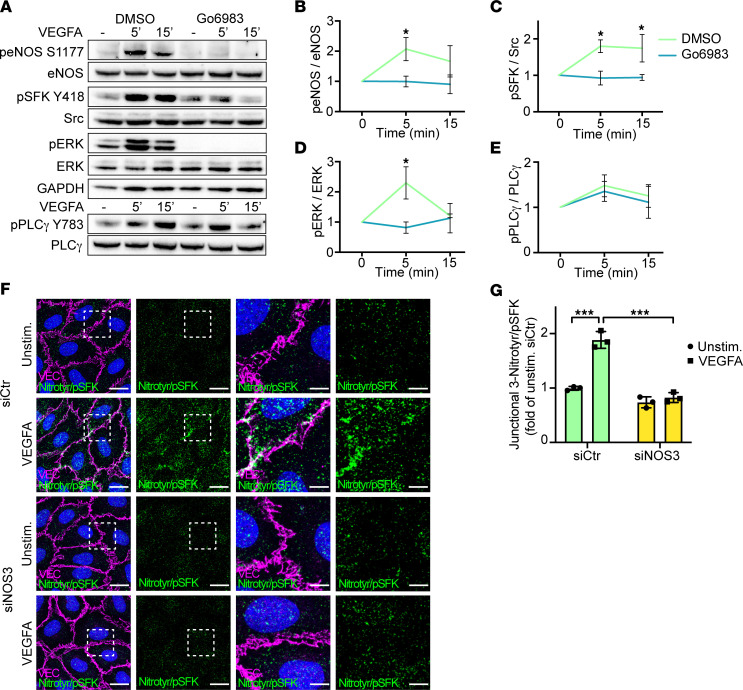
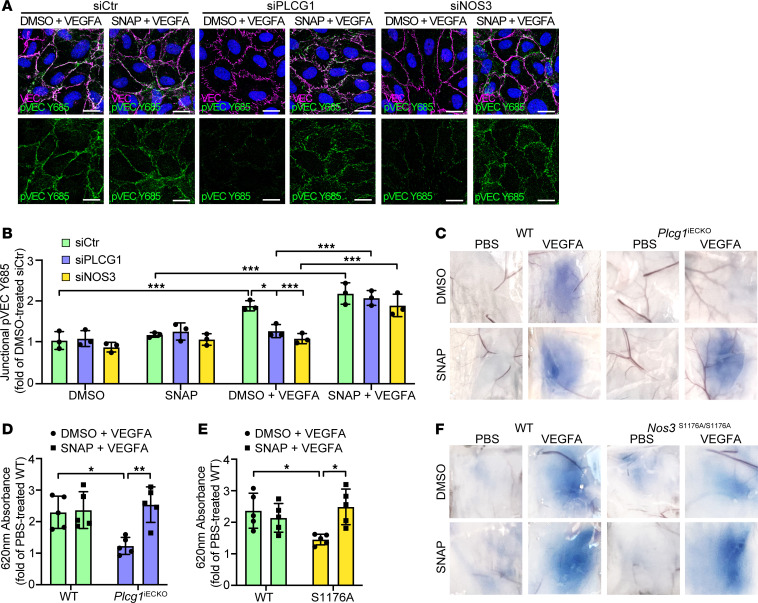
Endothelial phospholipase Cγ (PLCγ) is essential for vascular development; however, its role in healthy, mature, or pathological vessels is unexplored. Here, we show that PLCγ was prominently expressed in vessels of several human cancer forms, notably in renal cell carcinoma (RCC). High PLCγ expression in clear cell RCC correlated with angiogenic activity and poor prognosis, while low expression correlated with immune cell activation. PLCγ was induced downstream of vascular endothelial growth factor receptor 2 (VEGFR2) phosphosite Y1173 (pY1173). Heterozygous Vegfr2Y1173F/+ mice or mice lacking endothelial PLCγ (Plcg1iECKO) exhibited a stabilized endothelial barrier and diminished vascular leakage. Barrier stabilization was accompanied by decreased expression of immunosuppressive cytokines, reduced infiltration of B cells, helper T cells and regulatory T cells, and improved response to chemo- and immunotherapy. Mechanistically, pY1173/PLCγ signaling induced Ca2+/protein kinase C-dependent activation of endothelial nitric oxide synthase (eNOS), required for tyrosine nitration and activation of Src. Src-induced phosphorylation of VE-cadherin at Y685 was accompanied by disintegration of endothelial junctions. This pY1173/PLCγ/eNOS/Src pathway was detected in both healthy and tumor vessels in Vegfr2Y1173F/+ mice, which displayed decreased activation of PLCγ and eNOS and suppressed vascular leakage. Thus, we believe that we have identified a clinically relevant endothelial PLCγ pathway downstream of VEGFR2 pY1173, which destabilizes the endothelial barrier and results in loss of antitumor immunity.

Keywords: Oncology; Signal transduction; Vascular Biology.


Figures

Figure 1
Figure 1. Tumor endothelial PLCγ expression correlates with worse patient survival and biological processes in patients with ccRCC.
(A and B) Representative images of patients with RCC positive (n = 5, A) and negative (n = 7; B) for vascular PLCγ expression. Scale bar: 50 μm. Lower right panels show magnifications from insets. Scale bar, 20 μm. (C and D) Kaplan-Meier curves showing correlative analysis of PLCG1 mRNA expression and disease specific survival (C) and overall survival (D) in the ccRCC TCGA data set (KIRC); n = 383 (PLCG1-low subgroup) and 127 patients (PLCG1-high subgroup). (E) Ranking of the 20 (GOBPs most enriched in the PLCG1-low subgroup (n = 383 patients) based on significance (Padj shown as heatmap) and ratio of affected genes within each GOBP. Overrepresentation analysis was performed based on a hypergeometric distribution corresponding to the 1-sided Fisher’s exact test (ClusterProfiler). (F) CNET plot showing networks of top differentially expressed genes (DEGs) in the immune activity GOBPs listed in E. (G) Ranking as in E, of the 20 most enriched GOBPs in the PLCG1-high subgroup (n = 127 patients). (H) CNET plot showing network of top DEGs in the indicated GOBPs in G.
Figure 2
Figure 2. VEGFR2 pY1173/PLCγ signaling in experimental tumors affects vascular leakage, response to therapy, and antitumor immunity.
(A and B) Immunostaining (A) and mean fluorescent intensity (MFI) quantification (B) of pPLCγ Y783 in Vegfr2+/+ (WT) and Vegfr2Y1173F/+ (Y1173F/+) B16F10 melanoma tumors; n = 5 (WT) and 3 (Y1173F/+) mice, ≥ 3 fields of view/experiment. Scale bar: 100 μm. Unpaired 2-tailed Students’ t test. (C) Tumor growth of WT and Y1173F/+ B16F10 tumors; n = 5 (WT) and 3 (Y1173F/+) mice. 1-way ANOVA. (D) Quantification of vessel density (MFI) from A; n = 5 (WT) and 3 (Y1173F/+) mice, ≥ 3 fields of view/tumor. Unpaired 2-tailed Students’ t test. (E and F) Representative image (E) and quantification (F) of extravasated fixable 2,000 kDa FITC-dextran in B16F10 tumors; n = 5 (WT) and 3 (Y1173F/+) mice, ≥ 3 fields of view/experiment. Scale bar:100 μm. Unpaired 2-tailed Students’ t test. (G) Fluorescent intensity of 70 kDa TRITC-dextran extracted from B16F10 tumors; n = 5 (WT) and 3 (Y1173F/+) mice. Unpaired 2-tailed Students’ t test. (H and I) Tumor growth (H) and tumor weights (I) of WT and Y1173F/+ B16F10 tumors treated with 5 mg/kg Temozolomide (TMZ) or DMSO control; n = 9–10 mice/group. 2-way ANOVA (H), 1-way ANOVA (I). (JM) Percent B cells (CD19) (J), helper T cells (CD3 and CD4 costaining) (K), regulatory T cells (CD3, CD4, CD25, and Foxp3 costaining) (L), cytotoxic T cells (CD3 and CD8 costaining) (M) in WT and Y1173F/+ B16F10 tumors; n = 16/genotype. Unpaired 2-tailed Students’ t test. (N) mRNA expression of TGFβ (Tgfb1-3), IL10 (Il10), IL35 (Il12a, Ebi3), IFNγ (Ifng), and TNFα (Tnf) in WT and Y1173F/+ B16F10 tumors; n = 5 mice/genotype. Unpaired 2-tailed Students’ t test. (O) Tumor weight of CD40- or IgG-treated WT and Y1173F/+ B16F10 tumors harvested at day 12; n = 9–10 mice/group. 1-way ANOVA. Data represent mean ± SD or SEM (H). *P < 0.05, **P < 0.01, ***P < 0.001.
Figure 3
Figure 3. VEGFR2 pY1173 signaling regulates VEGFA-induced vascular permeability in the healthy skin.
(A) Representative images of immunofluorescent staining for VE-cadherin (VEC) and pPLCγ Y783 in the back skin of Vegfr2+/+ WT and Vegfr2Y1173F/+ heterozygous (Y1173F/+) mice, subsequent to intradermal injection of PBS or VEGFA. Scale bar: 20 μm. (B) Quantification of mean fluorescent intensity of vascular pPLCγ Y783 from A; n = 5 mice/genotype, ≥ 2 fields of view/mouse. 1-way ANOVA. (C) Representative images of Evans blue leakage in response to PBS, VEGFA, bradykinin, or histamine in the back skin of WT and Y1173F/+ mice. (D) Quantification (620 nm absorbance) of extravasated Evans blue from C. Values are shown as fold of PBS-treated control, normalized to tissue weight; n = 3–5 mice/group. 1-way ANOVA. (E) Representative time-lapse image of VEGFA-induced vascular permeability of 2,000 kDa FITC dextran in the ear dermis of WT and Y1173F/+ mice. Scale bar: 50 μm. (F and G) Number of leakage sites/100 μm in WT and Vegfr2Y1173F/+ mice, in veins (F) and capillaries (G); n = 3 mice/genotype, ≥ 2 fields of view/mouse. Unpaired 2-tailed Students’ t test. (H and I) Ear dermis leakage in response to VEGFA in tamoxifen-treated Vegfr2fl/fl; Cdh5-Cre (fl/fl), Vegfr2Y1173F/fl; Cdh5-Cre (Y1173F/fl), Vegfr2Y1173F/fl; Cdh5-Cre+ (Y1173F/), Vegfr+/fl; Cdh5-Cre+ (+/), Vegfr2fl/fl; Cdh5-Cre+ (/), quantified as leakage sites/100 μm, in veins (H) and capillaries (I); n = 3–5 mice/genotype, ≥ 2 fields of view/mouse. 1-way ANOVA. Data represent mean ± SD. *P < 0.05, **P < 0.01, ***P < 0.001.
Figure 4
Figure 4. pY1173/PLCγ signaling leads to adherens junction disruption and phosphorylation.
(A) Evans blue leakage in the back skin in response to PBS or VEGFA in tamoxifen-treated Plcg1fl/fl; Cdh5-Cre – (WT), and Plcg1fl/fl; Cdh5-Cre + (Plcg1iECKO) mice. (B) Quantification of extravasated Evans blue from A shown as fold of PBS-treated WT mice, normalized to tissue weight; n = 12 (WT), and 8 (Plcg1iECKO) mice. 1-way ANOVA. (C) Immunofluorescent staining with antibodies against VE-cadherin (VEC) and pVEC Y685 in the back skin of tamoxifen-treated WT and Plcg1iECKO mice after intradermal injection of PBS or VEGFA. Scale bar: 20 μm. (D) Quantification of mean fluorescent intensity for vascular pVEC Y685 from C; n = 3 mice/genotype, ≥ 2 fields of view/mouse. 1-way ANOVA. (E) Immunofluorescent staining of VEC and pVEC Y685 of unstimulated or VEGFA-stimulated HUVECs (100 ng/mL, 5 min), silenced for PLCG1 (siPLCG1) or treated with control siRNA (siCtr). Nuclei stained with DAPI (blue). Scale bar: 20 μm. (F and G) Quantification of VEC area (F); n = 6 independent experiments, ≥ 3 fields of view/experiment and pVEC Y685 levels (G); n = 5 independent experiments, ≥ 3 fields of view/experiment from E. 1-way ANOVA. (H) Representative Western blot showing downstream VEGFA-activated signaling in siCtr or siPLCG1-treated HUVECs. (IM) Quantification of at least 3 independent experiments from H, for pVEC Y685 (I), pVEGFR2 Y1175 (J), pFAK (K), pSFK Y418 (L), and pERK (M), shown as fold change of unstimulated samples. 1-way ANOVA. Data represent mean ± SD. *P < 0.05, **P < 0.01, ***P < 0.001.
Figure 5
Figure 5. PLCγ activates eNOS in a Ca2+-dependent manner to induce VEGF-dependent vascular leakage.
(A) Representative VE-cadherin (VEC) and pVEC Y685 immunostainings of HUVECs pretreated for 15 minutes with DMSO (control) or 5 μM MAPTAM prior to VEGFA stimulation (100 ng/ml, 5 min). Nuclei stained with DAPI (blue). Scale bar: 20 μm. (B and C) Quantification of VEC area (B) and pVEC Y685 levels (C) from A; n = 6 independent experiments, ≥ 3 fields of view/experiment. 1-way ANOVA. (D and E) Representative Western blot (D) and quantification (E) of peNOS S1177 levels in VEGFA-stimulated isolated lung ECs from WT and Vegfr2Y1173F/+ (Y1173F/+) mice; n = 4 mice/genotype. 1-way ANOVA. (F and G) Representative immunostaining (F) and mean fluorescent intensity (MFI) quantification (G) of eNOS and peNOS S1176 in B16F10 melanomas from Vegfr2+/+ (WT) and Vegfr2Y1173F/+ (Y1173F/+) mice; n = 5 (WT) and 3 (Y1173F/+) mice, ≥ 2 fields of view/tumor. Scale bar: 100 μm. Scale bar inset: 20 μm. Unpaired 2-tailed Students’ t test. (H) Immunofluorescent staining with antibodies against VEC and pVEC Y685 in the back skin of NOS3+/+ (WT) and Nos3S1176A/S1167A (S1176A) mice after intradermal injection of PBS or VEGFA. Scale bar: 20 μm. (I) Quantification of MFI values for vascular pVEC Y685 from H; n = 3 mice/genotype, ≥ 2 fields of view/mouse. 1-way ANOVA. (J) Representative time-lapse image of VEGFA-stimulated vascular extravasation of a 2,000 kDa FITC-dextran in the ear dermis of WT and S1176A mice. Scale bar: 50 μm. (K and L) Number of leakage sites/100 μm in WT and S1176A mice in ear dermis veins (K) and capillaries (L); n = 4–5 mice/genotype, ≥ 2 fields of view/mouse. Unpaired 2-tailed Students’ t test. Data represent mean ± SD. *P < 0.05, **P < 0.01, ***P < 0.001.
Figure 6
Figure 6. TG rescues activation of Src and VE-cadherin phosphorylation in response to VEGFA, after removal of PLCγ.
(AC) PLA using antibodies against Src and pSFK Y418, visualizing phosphorylation of Src on Y418, in HUVECs treated for 5 min with DMSO, 100 ng/ml VEGFA or 100 ng/ml VEGFA + 1uM TG, and pretreated with siCtr (A), siPLCG1 (B), or siNOS3 (C). Junctions are stained for VE-cadherin (VEC) and nuclei with DAPI (blue). Scale bar: 20 μm. Boxed regions in left panels are magnified in panels to the right. Scale bar: 5 μm. (D) MFI quantifications of junctional PLA signals representing Src phosphorylated on Y418 from AC; n = 3 independent experiments, ≥ 3 fields of view/experiment. 1-way ANOVA. (E) Representative images of immunofluorescent stainings with antibodies against VEC and pVEC Y685, of HUVECs treated with VEGFA or VEGFA+TG, pretreated with siCtr, siPLCG1 or siNOS3. Scale bar: 20 μm. (F) MFI quantification of data from E shown as fold of DMSO-treated siCtr; n = 3 independent experiments, ≥ 3 fields of view/experiment. 1-way ANOVA. Data represent mean ± SD. *P < 0.05, **P < 0.01, ***P < 0.001.
Figure 7
Figure 7. VEGF-induced PKC signaling mediates eNOS activation and junctional tyrosine nitration of Src.
(A) Western blot showing VEGFA-activated signaling in HUVECs pretreated with DMSO (control) or the PKC inhibitor Go6983. (BE) Quantification of at least 3 independent experiments from A, for peNOS S1177 (B), pSFK Y418 (C), pERK (D), and pPLCγ Y783 (E), shown as fold change of unstimulated samples. 1-way ANOVA. (F) PLA using antibodies against 3-nitrotyrosine and pSFK Y418, in HUVECs stimulated with VEGFA (100 ng/mL, 5 minutes), pretreated with siCtr or siNOS3. Junctions are stained for VE-cadherin (VEC). Scale bar: 20 μm. Boxed regions in left panels are magnified in panels to the right. Scale bar: 5 μm. (G) MFI quantification of junctional 3-nitrotyrosine/pSFK Y418 PLA signals from F; n = 3 independent experiments, ≥ 3 fields of view/experiment. 1-way ANOVA. Data represent mean ± SD. *P < 0.05, ***P < 0.001.
Figure 8
Figure 8. NO donor rescue of VE-cadherin phosphorylation and vascular leakage in the absence of PLCγ/eNOS signaling.
(A) Representative images of immunostainings with antibodies against VE-cadherin (VEC) and pVEC Y685 of HUVECs treated with VEGFA + DMSO or VEGFA + SNAP for 5 minutes, pretreated with siCtr, siPLCG1, or siNOS3. Scale bar: 20 μm. (B) MFI quantification of data from A shown as fold of DMSO-treated siCtr. n= 3 independent experiments, ≥3 fields of view/experiment. 1-way ANOVA. (C) Miles assay showing Evans blue leakage in the back skin after intradermal injection of PBS or VEGFA, combined with DMSO (control) or the NO-donor SNAP, in tamoxifen-treated Plcg1fl/fl; Cdh5-Cre (WT), and Plcg1fl/fl; Cdh5-Cre+ (Plcg1iECKO) mice. (D) Quantification of extravasated Evans blue from C shown as fold change of PBS-treated WT mice, normalized to tissue weight; n = 5/genotype. 1-way ANOVA. (E and F) Quantification (E) and representative images (F) of Evans blue leakage in the back skin, in response to intradermal injection of PBS or VEGFA, cotreated with DMSO or SNAP, in Nos3+/+ (WT) and Nos3S1176A/S1167A (S1176A) mice; n = 5/genotype. 1-way ANOVA. Data represent mean ± SD. *P < 0.05, **P < 0.01, ***P < 0.001.

Similar articles

Cited by

References

    1. Jain RK. Antiangiogenesis strategies revisited: from starving tumors to alleviating hypoxia. Cancer Cell. 2014;26(5):605–622. doi: 10.1016/j.ccell.2014.10.006. - DOI - PMC - PubMed
    1. Simons M, et al. Mechanisms and regulation of endothelial VEGF receptor signalling. Nat Rev Mol Cell Biol. 2016;17(10):611–625. doi: 10.1038/nrm.2016.87. - DOI - PubMed
    1. Baluk P, et al. Cellular abnormalities of blood vessels as targets in cancer. Curr Opin Genet Dev. 2005;15(1):102–111. doi: 10.1016/j.gde.2004.12.005. - DOI - PubMed
    1. Claesson-Welsh L, et al. Permeability of the endothelial barrier: identifying and reconciling controversies. Trends Mol Med. 2021;27(4):314–331. doi: 10.1016/j.molmed.2020.11.006. - DOI - PMC - PubMed
    1. Carmeliet P, Jain RK. Principles and mechanisms of vessel normalization for cancer and other angiogenic diseases. Nat Rev Drug Discov. 2011;10(6):417–427. doi: 10.1038/nrd3455. - DOI - PubMed

Publication types

MeSH terms

Substances