. 2023 Nov 1;133(21):e167951.
doi: 10.1172/JCI167951.

Targeting TREM1 augments antitumor T cell immunity by inhibiting myeloid-derived suppressor cells and restraining anti-PD-1 resistance

Affiliations

Targeting TREM1 augments antitumor T cell immunity by inhibiting myeloid-derived suppressor cells and restraining anti-PD-1 resistance

Ashwin Ajith et al. J Clin Invest. .

Abstract

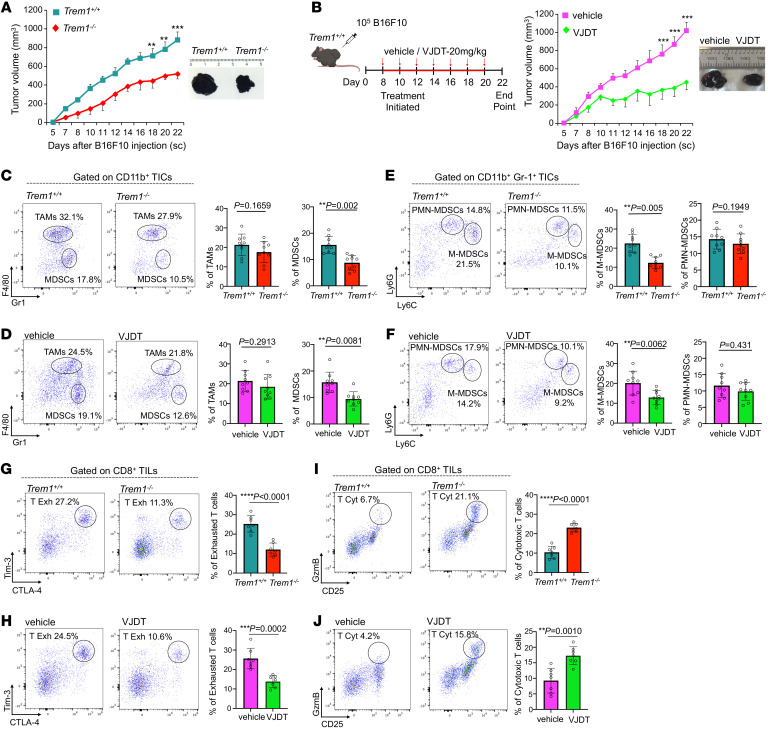
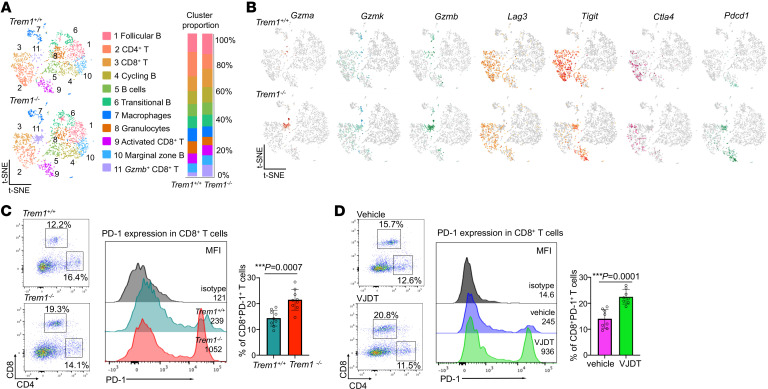
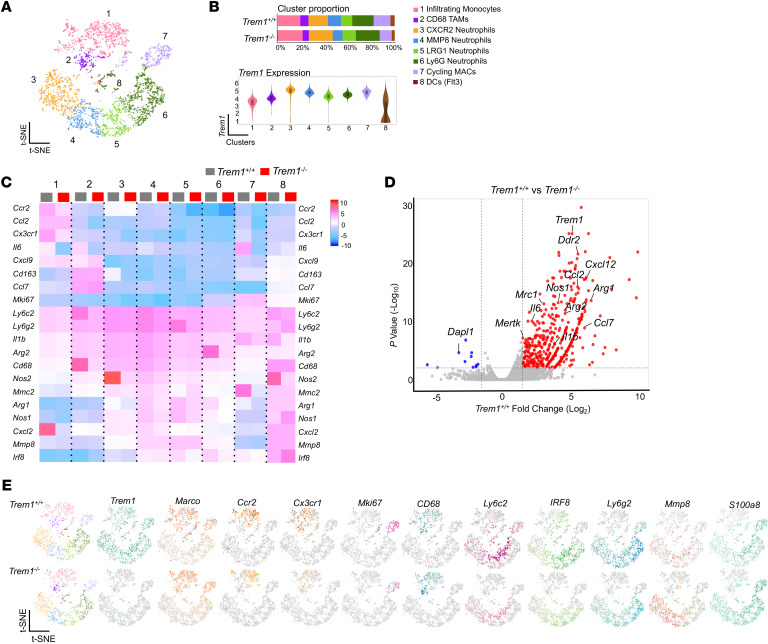
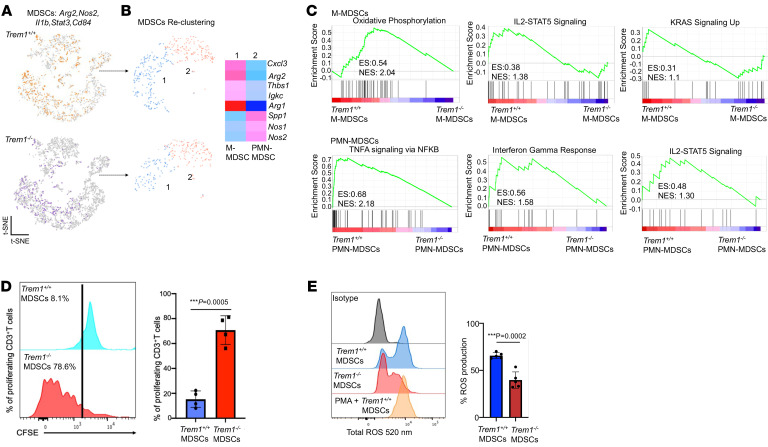
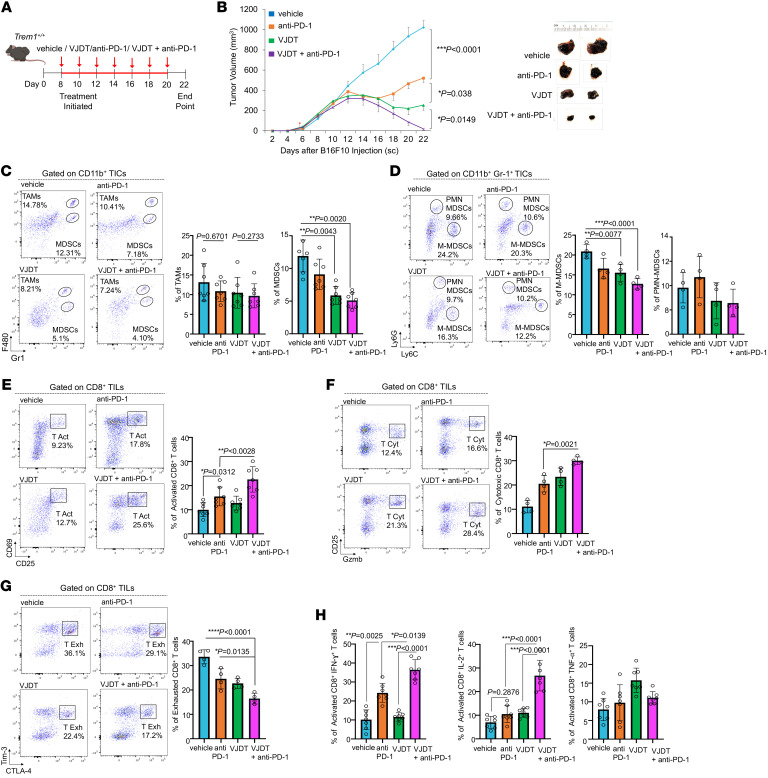
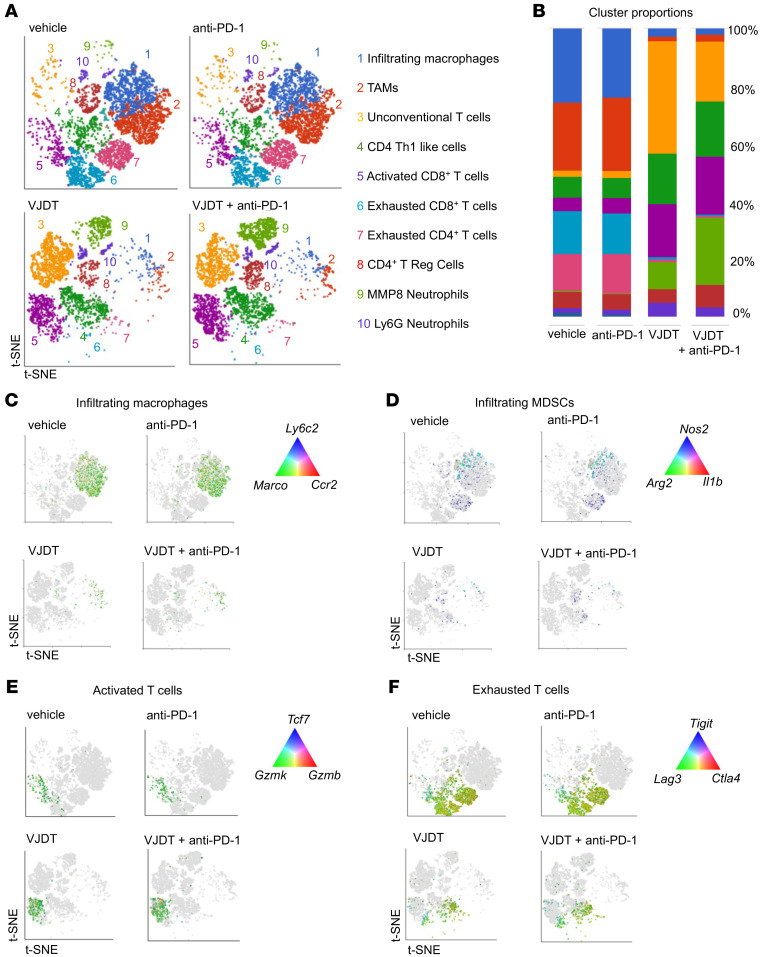
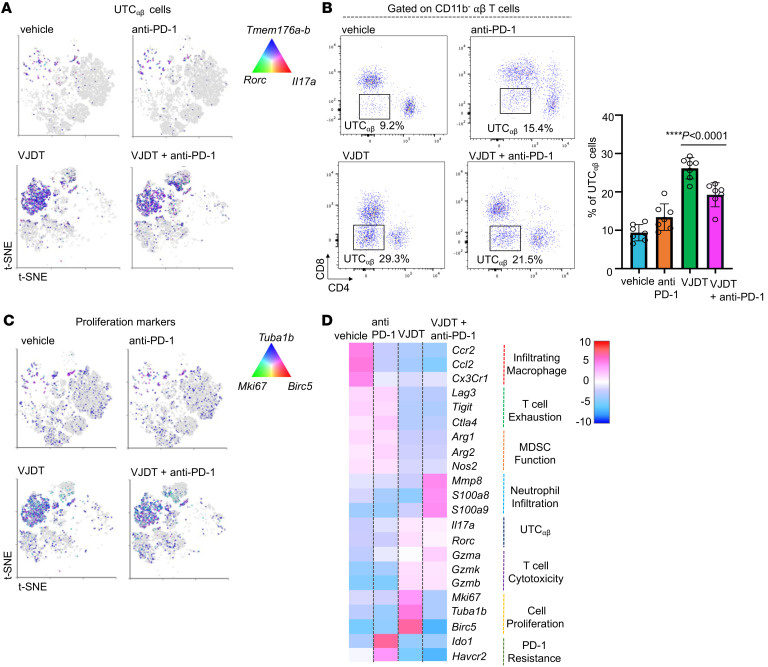
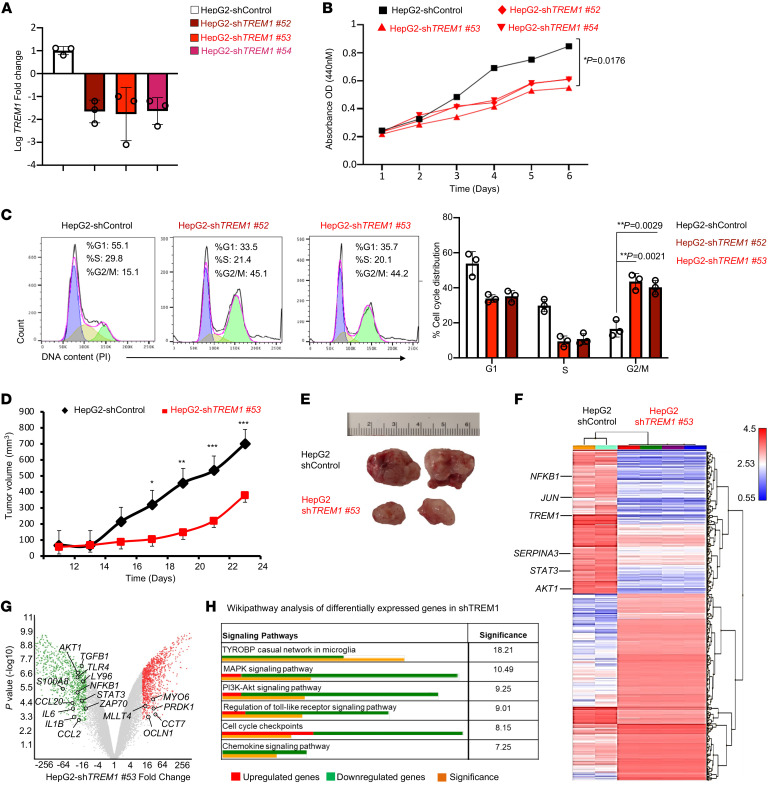
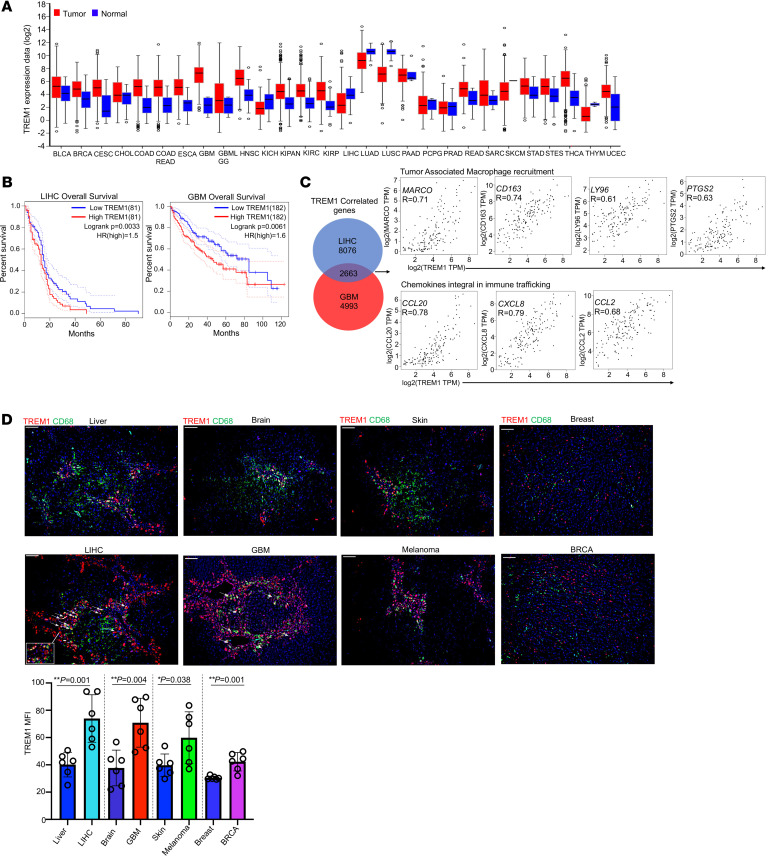
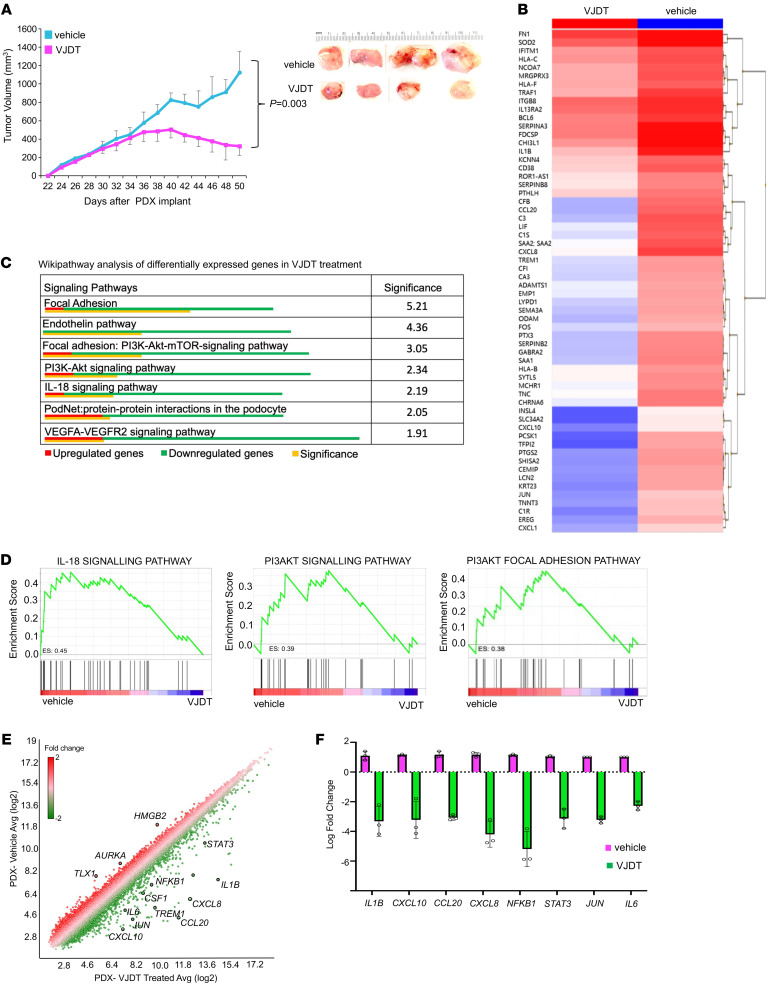
The triggering receptor expressed on myeloid cell 1 (TREM1) plays a critical role in development of chronic inflammatory disorders and the inflamed tumor microenvironment (TME) associated with most solid tumors. We examined whether loss of TREM1 signaling can abrogate the immunosuppressive TME and enhance cancer immunity. To investigate the therapeutic potential of TREM1 in cancer, we used mice deficient in Trem1 and developed a novel small molecule TREM1 inhibitor, VJDT. We demonstrated that genetic or pharmacological TREM1 silencing significantly delayed tumor growth in murine melanoma (B16F10) and fibrosarcoma (MCA205) models. Single-cell RNA-Seq combined with functional assays during TREM1 deficiency revealed decreased immunosuppressive capacity of myeloid-derived suppressor cells (MDSCs) accompanied by expansion in cytotoxic CD8+ T cells and increased PD-1 expression. Furthermore, TREM1 inhibition enhanced the antitumorigenic effect of anti-PD-1 treatment, in part, by limiting MDSC frequency and abrogating T cell exhaustion. In patient-derived melanoma xenograft tumors, treatment with VJDT downregulated key oncogenic signaling pathways involved in cell proliferation, migration, and survival. Our work highlights the role of TREM1 in cancer progression, both intrinsically expressed in cancer cells and extrinsically in the TME. Thus, targeting TREM1 to modify an immunosuppressive TME and improve efficacy of immune checkpoint therapy represents what we believe to be a promising therapeutic approach to cancer.

Keywords: Cancer immunotherapy; Cellular immune response; Melanoma; Oncology; Therapeutics.


Conflict of interest statement

Conflict of interest: AA, IL, and AH are inventors on a patent application (US patent no.US21/51072) submitted by Augusta University that covers compositions and methods for inhibiting TREM1.

Figures

Figure 1
Figure 1. TREM1 deficiency and anti-TREM1 treatment diminish B16F10 tumor growth by altering tumor immune infiltrates.
(A) Tumor growth curves for B16F10 melanoma in Trem1+/+ and Trem1–/– mice (mean ± SEM, n = 9 mice/group). Representative microscopic images of tumors from indicated groups on day 22. (B) Schematic illustration describes treatment protocol with TREM1 inhibitor VJDT on B16F10 melanoma in Trem1+/+ mice. Treatment initiated on eighth day of tumor growth followed every alternate day with VJDT (20 mg/kg) or vehicle (DMSO) until day 20. Tumor growth curves calculated by individual measurements recorded every alternate day (n = 9 mice/group, mean ± SEM). Representative microscopic images of tumors from indicated groups on day 22. (CJ) Tumors harvested on day 22. Flow cytometry analysis and frequency of cells in gated immune subsets are depicted (dot plots show a representative experiment performed in triplicate, n = 7–9 mice/group, mean ± SD shown). (C) Frequency of CD11b+F4/80+Gr-1 TAMs and CD11b+F4/80Gr-1+ MDSC infiltrates in Trem1+/+ or Trem1–/– mice and (D) in Trem1+/+ mice with indicated treatment. (E) Frequency of CD11b+Gr-1+Ly6ChiLy6G M-MDSC and CD11b+Gr1+Ly6CloLy6G+ PMN-MDSCs in Trem1+/+ or Trem1–/– mice and (F) in Trem1+/+ mice with indicated treatment. (G) Frequency of exhausted CD8+Tim-3+CTLA-4+ T cells in Trem1+/+ or Trem1–/– mice and (H) in Trem1+/+ mice with indicated treatment. (I) Frequency of cytotoxic CD8+GzmB+CD25+ T cells in Trem1+/+ or Trem1–/– mice and (J) in Trem1+/+ with indicated treatment. **P < 0.01; ***P < 0.001; ****P < 0.0001 assessed by 2-way ANOVA for multiple comparison of longitudinal tumor growth between groups (A and B [tumor growth]) or 2-tailed Student’s t test for comparison between 2 groups (CH).
Figure 2
Figure 2. scRNA-Seq analysis reveals alterations in immune landscape of TREM1-deficient TME in B16F10 melanoma.
scRNA-Seq analysis of tumor-infiltrating CD45+ cells from melanoma-bearing Trem1+/+ and Trem1–/– mice at day 22. For each experimental group, 4 biological replicates were pooled. (A) Data analyzed by Loupe browser and Seurat to generate t-SNE plot depicting differential cell clusters and their frequencies. Cluster identities based on expression of key gene signatures described in Methods. Bar graphs depict cluster proportions in each condition (Trem1+/+ and Trem1–/–). (B) t-SNE plots characterize expression of specific cluster markers for TICs in Trem1+/+ and Trem1–/– tumor-bearing mice. (C) Flow cytometry histogram plots depict PD-1 expression in tumor-infiltrating CD8+ and CD4+ T cells of Trem1+/+ or Trem1–/– mice and (D) in Trem1+/+ mice with indicated treatment (dot plots show a representative experiment performed in triplicate, n = 8–9 mice/group, mean ± SD). ***P < 0.001 assessed by 2-tailed Student’s t test for comparison between 2 groups (C and D).
Figure 3
Figure 3. TREM1 deficiency alters the myeloid landscape in B16F10 tumors.
scRNA-Seq analysis of tumor-infiltrating CD45+CD11b+ cells from melanoma-bearing Trem1+/+ and Trem1–/– mice at day 22. For each experimental group, 5 biological replicates were pooled. (A) Data analyzed by Loupe browser and Seurat to generate t-SNE plot depicting differential cell clusters and their frequencies within tumor myeloid populations from merged conditions. Clusters classified based on expression of key genes described in Methods. (B) Bar graphs represent cluster proportions in each condition (Trem1+/+ and Trem1–/–). Violin plots characterize Trem1 expression among different clusters in Trem1+/+ mice. (C) Heatmap shows expression of selected genes of interest in each myeloid cluster for Trem1+/+ and Trem1–/– tumor-bearing mice. (D) Volcano plot shows differentially expressed genes of Trem1+/+ TICs compared with Trem1–/–. Red dots represent upregulated genes with fold change greater than 1.5 and P < 0.05; blue dots show downregulated genes. Y axis denotes -Log10 P, while X axis shows Log2 fold change. (E) t-SNE plots characterize expression profile of cluster markers in TICs from Trem1+/+ and Trem1–/– tumor-bearing mice.
Figure 4
Figure 4. TREM1 deficiency restricts immunosuppressive capacity of MDSCs in B16F10 melanoma.
(A) t-SNE plots describe distribution of Arg2, Nos2, Il1b, Stat3, and Cd84–expressing tumor-infiltrating MDSCs in melanoma-bearing Trem1+/+ and Trem1–/– mice. For each experimental group, 5 biological replicates were pooled. (B) t-SNE plots describe reclustering analysis of MDSCs into 2 subsets. Heatmap depicts expression profile of specific genes in the M-MDSC and PMN-MDSC clusters. (C) GSEA depicts enrichment of hallmark pathways in tumor-infiltrating M-MDSCs and PMN-MDSCs of Trem1+/+ mice compared with Trem1–/–. Top enriched pathways shown with enrichment score (ES) and normalized enrichment score (NES). (D) MDSC suppression assay using CFSE-labeled T cells from Trem1+/+ mice primed with anti-CD3 and anti-CD28, cocultured with CD11b+Gr-1+ MDSCs from Trem1+/+ (blue) or Trem1–/– (red) tumor-bearing mice. (E) ROS formation assay of CD11b+Gr-1+ MDSCs from Trem1+/+ (blue) or Trem1–/– (red) tumor-bearing mice (n = 5 mice/group, mean ± SD), assessed by flow cytometry. ***P < 0.001 assessed by 2-tailed Student’s t test for comparison between 2 groups (D and E).
Figure 5
Figure 5. TREM1 inhibition enhances anti-PD-1 response by attenuating MDSC frequency and augments CD8+T cell immunity.
(A) Schematic illustrates various treatment regimens on B16F10 tumors in Trem1+/+ mice. Melanoma-bearing Trem1+/+ mice were treated with either vehicle (combination of DMSO and IgG2a Isotype) or 200 μg anti-PD-1 antibody or 20 mg/kg VJDT or a combination of both from day 8 until day 20, on every alternate day of tumor progression. (B) Tumor growth curves expressed as overall tumor volume monitored every alternate day (n = 7 mice/group, mean ± SEM). Representative microscopic images of tumors from the indicated groups on day 22 are shown. (CH) Tumors were harvested on day 22. Flow cytometry analysis of gated immune subset cells are shown (plots depict 1 representative experiment performed in triplicate, n = 4–7mice/group, mean ± SD). (C) Frequency of CD11b+F4/80+Gr-1 TAMs, CD11b+F4/80Gr-1+ MDSCs, and (D) CD11b+Gr-1+Ly6ChiLy6G M-MDSCs and CD11b+ Gr1+Ly6CloLy6G+ PMN-MDSCs in the TME of the indicated groups. (E) Frequency of activated CD8+CD69+CD25+ T cells, (F) cytotoxic CD8+GzmB+CD25+ T cells, and (G) exhausted CD8+Tim-3+CTLA-4+ T cells within the TME. (H) Frequency of tumor-infiltrating CD8+CD25+ T cells expressing either IFN-γ, IL-2, or TNF-α. **P < 0.01; ***P < 0.001; ****P < 0.0001 by 2-way ANOVA for multiple comparison of longitudinal tumor growth between groups (B [tumor growth]) or 2-tailed Student’s t test for comparison between 2 groups (CH).
Figure 6
Figure 6. scRNA-Seq analysis reveals alterations of TICs in TREM1 inhibition with anti-PD-1 treatment of B16F10 melanoma.
scRNA-Seq of tumor-infiltrating CD45+ immune cells sorted from TME of B16F10 melanoma-bearing Trem1+/+ mice receiving either VJDT, anti-PD-1, both in combinational treatment, or vehicle. For each experimental group, 3 biological replicates were pooled. (A) scRNA-Seq data analyzed using Partek Flow to generate t-SNE plot showing differential cell clusters and their frequencies within the TME. Cluster identities were annotated based on expression of key gene signatures as described in Methods. (B) Bar graph depicts cluster proportions associated with each treatment group. (CF) t-SNE plots characterize changes during treatment in the expression profile of key genes involved in (C) infiltrating macrophages, (D) infiltrating MDSCs, (E) activated T cells, and (F) exhausted T cells across the indicated groups.
Figure 7
Figure 7. scRNA-Seq analysis of tumor infiltrating UTCαβ cells in TREM1-inhibited TME of B16F10 melanoma.
(A) t-SNE plot describes expression profile of key gene markers for UTCαβ cells in melanoma-bearing Trem1+/+ mice receiving either VJDT, anti-PD-1, both in combinational treatment, or vehicle. For each experimental group, 3 biological replicates were pooled. (B) Flow cytometry analysis shows frequency of UTCαβ cells within the TME of Trem1+/+ mice across indicated groups (n = 7 mice/group, mean ± SD). (C) t-SNE plot describes global expression profile of proliferation markers across indicated groups. (D) Heatmap depicts differential transcription profiles of tumor-infiltrating CD45+ immune cells sorted from TME of indicated groups. The differentially expressed genes associated with effector function are shown. ****P < 0.0001 by 1-way ANOVA using Dunnett’s multiple comparison test (B).
Figure 8
Figure 8. TREM1 silencing in HepG2 cells inhibits cell proliferation, migration, and tumor growth in xenograft model.
(A) RT-qPCR confirmation of TREM1 knockdown in HepG2 cells following transfection with shTREM1 clones nos. 52, 53, and 54 in comparison to shControl-scrambled vector. Data represent 3 independent experiments performed in triplicate (n = 3/group, mean ± SD). (B) Line graph shows WST-1 assay to assess cell proliferation in TREM1 knockdown HepG2 clones (shTREM1 nos. 52, 53, and 54) and its shControl clone for 6 days (n = 3/group, mean ± SD). (C) Flow cytometry histogram plots depict cell cycle progression of TREM1 knockdown HepG2 clones (shTREM1 nos. 52 and 53) and shControl over 24 hours. Representative plot from 3 independent experiments performed in triplicate (mean ± SD shown). (D) Tumor growth curves for TREM1 knockdown shTREM1 clone no. 53 in NSG mice and its shControl described as overall tumor volume measured every alternate day (n = 8 mice/group, mean ± SEM). (E) Representative microscopic images of tumors from the indicated groups at day 23. (F) Transcriptomic analysis by Clariom S Microarray used to plot heatmap depicting hierarchical clustering of differentially expressed genes between shTREM1 no. 53 knockdown tumors (n = 4) and the shControl HepG2 tumors (n = 2). (G) Volcano plots depict differentially expressed genes of the shTREM1 no. 53 knockdown tumors compared with shControl HepG2 tumors. Red dots represent upregulated genes with fold change greater than 10 and P < 0.001, green dots show downregulated genes. (H) Wikipathway analysis depicts significantly affected pathways in TREM1 knockdown HepG2 clone in comparison to control. *P < 0.05; **P < 0.01; ***P < 0.001 by 2-way ANOVA with Tukey’s correction t test for comparing cell proliferation (B), by 2-tailed Student’s t test for comparison between 2 groups (C), 2-way ANOVA for multiple comparison of longitudinal tumor growth between various groups (D [tumor growth]), or using 2-sided Fisher’s exact t test in pathway analysis (H).
Figure 9
Figure 9. TREM1 expression is associated with poor prognosis in selected human tumors.
(A) TREM1 mRNA expression between 28 human neoplastic and corresponding nonneoplastic tissues. (B) Kaplan-Meier survival curves describe correlation between TREM1 expression and overall patient survival in LIHC (n = 162) and GBM (n = 364) cohorts. (C) Venn diagram showing TREM1-correlating genes in LIHC and GBM cohorts. Correlation data for TREM1 expression (X axis) and the indicated genes (Y axis) for LIHC cohort. (D) Fluorescent multiplex IHC images of human samples from people in the control group and people diagnosed with primary carcinomas in liver, brain, skin, and breast. Original magnification, ×10; scale bar: 100μm. TREM1 (red), DAPI (blue), and CD68 (green). Quantification of overall TREM1 expression as MFI in different zones of tumor and control tissues (n = 6 zones per tissue section). *P < 0.05; **P < 0.01 by 2-tailed Student’s t test for comparison between 2 groups.
Figure 10
Figure 10. TREM1 inhibition by VJDT treatment restrains tumor growth in PDX models.
(A) Tumor growth curve of PDX melanoma xenograft in NSG mice receiving vehicle (DMSO) or VJDT (20 mg/kg) treatment every alternate day from 30 to 48 days (n = 4 mice/group, mean ± SEM). (B) Heatmap depicts hierarchical clustering of differentially expressed genes in PDX tumors between VJDT-treated versus vehicle. (C) Wikipathway analysis identify signaling pathways in PDX tumors significantly affected by VJDT treatment. (D) GSEA analysis showing downregulated signaling pathways during VJDT treatment. Enrichment score (ES) are shown. (E) Scatter plot depicts expression profile of specific genes of interest in VJDT-treated versus vehicle control. (F) Custom RT-qPCR confirmation of expression profile for key genes altered by VJDT treatment. Data from 3 independent experiments performed in triplicate (mean ± SD shown). P value calculated by 2-way ANOVA with Tukey’s correction t test for multiple comparison of longitudinal tumor growth between various groups (A [tumor growth]) or using 2-sided Fisher’s exact t test in pathway analysis (C).

References

    1. Bouchon A, et al. Cutting edge: inflammatory responses can be triggered by TREM-1, a novel receptor expressed on neutrophils and monocytes. J Immunol. 2000;164(10):4991–4995. doi: 10.4049/jimmunol.164.10.4991. - DOI - PubMed
    1. Colonna M. The biology of TREM receptors. Nat Rev Immunol. 2023;23(9):580–594. doi: 10.1038/s41577-023-00837-1. - DOI - PMC - PubMed
    1. Bouchon A, et al. TREM-1 amplifies inflammation and is a crucial mediator of septic shock. Nature. 2001;410(6832):1103–1107. doi: 10.1038/35074114. - DOI - PubMed
    1. Tammaro A, et al. TREM-1 and its potential ligands in non-infectious diseases: from biology to clinical perspectives. Pharmacol Ther. 2017;177:81–95. doi: 10.1016/j.pharmthera.2017.02.043. - DOI - PubMed
    1. Nguyen AH, et al. Chronic inflammation and cancer: emerging roles of triggering receptors expressed on myeloid cells. Expert Rev Clin Immunol. 2015;11(7):849–857. doi: 10.1586/1744666X.2015.1043893. - DOI - PMC - PubMed

Publication types

Substances