

Human neuronal excitation/inhibition balance explains and predicts neurostimulation induced learning benefits
- PMID: 37651315
- PMCID: PMC10470965
- DOI: 10.1371/journal.pbio.3002193
Human neuronal excitation/inhibition balance explains and predicts neurostimulation induced learning benefits
Abstract
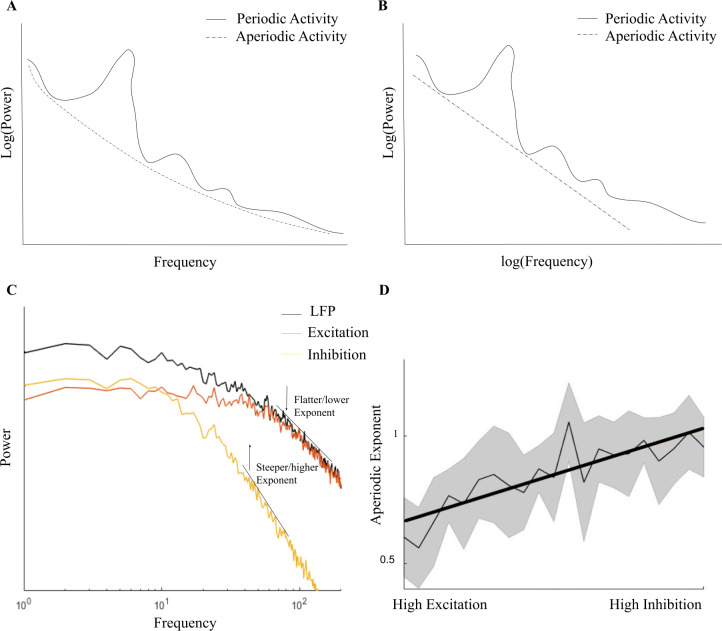
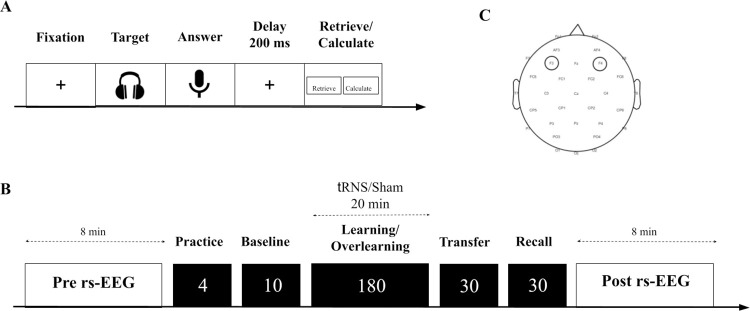
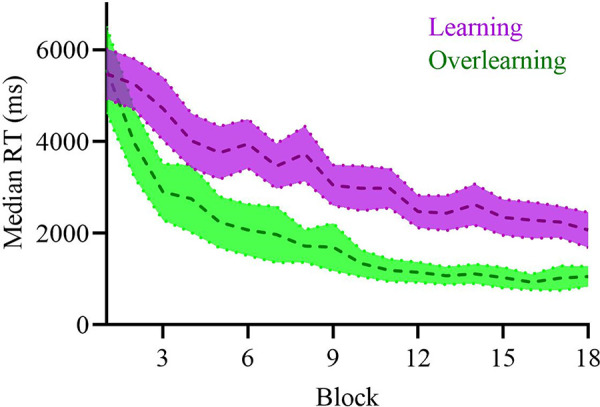
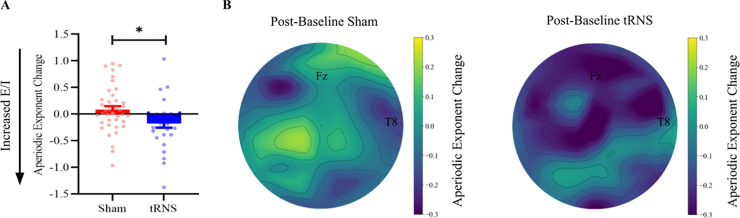
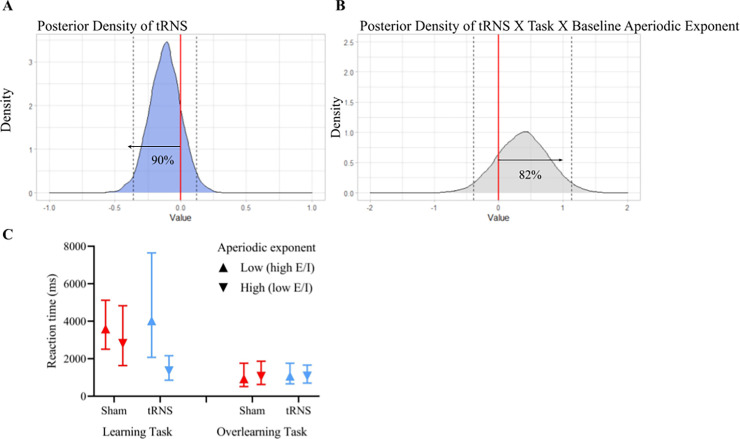
Previous research has highlighted the role of the excitation/inhibition (E/I) ratio for typical and atypical development, mental health, cognition, and learning. Other research has highlighted the benefits of high-frequency transcranial random noise stimulation (tRNS)-an excitatory form of neurostimulation-on learning. We examined the E/I as a potential mechanism and studied whether tRNS effect on learning depends on E/I as measured by the aperiodic exponent as its putative marker. In addition to manipulating E/I using tRNS, we also manipulated the level of learning (learning/overlearning) that has been shown to influence E/I. Participants (n = 102) received either sham stimulation or 20-minute tRNS over the dorsolateral prefrontal cortex (DLPFC) during a mathematical learning task. We showed that tRNS increased E/I, as reflected by the aperiodic exponent, and that lower E/I predicted greater benefit from tRNS specifically for the learning task. In contrast to previous magnetic resonance spectroscopy (MRS)-based E/I studies, we found no effect of the level of learning on E/I. A further analysis using a different data set suggest that both measures of E/I (EEG versus MRS) may reflect, at least partly, different biological mechanisms. Our results highlight the role of E/I as a marker for neurostimulation efficacy and learning. This mechanistic understanding provides better opportunities for augmented learning and personalized interventions.
Copyright: © 2023 van Bueren et al. This is an open access article distributed under the terms of the Creative Commons Attribution License, which permits unrestricted use, distribution, and reproduction in any medium, provided the original author and source are credited.
Conflict of interest statement
I have read the journal’s policy and the authors of this manuscript have the following competing interests: RCK serves on the scientific advisory boards of Neuroelectrics Inc. and Tech InnoSphere Engineering Ltd. RCK and NERB filed a UK Patent which is managed by the University of Surrey for ”method for obtaining personalized parameters for transcranial stimulation, transcranial system, method of applying transcranial stimulation”. RCK is a founder, director, and shareholder of Cognite Neurotechnology Ltd. The current paper is not related to the patent or work with these companies. RCK is part of the PLOS Biology Editorial Board. The manuscript went through the same peer-review process as if this were not the case.
Figures
Similar articles
-
Transcranial random noise stimulation is more effective than transcranial direct current stimulation for enhancing working memory in healthy individuals: Behavioural and electrophysiological evidence.Brain Stimul. 2020 Sep-Oct;13(5):1370-1380. doi: 10.1016/j.brs.2020.07.001. Epub 2020 Jul 10. Brain Stimul. 2020. PMID: 32659482 Clinical Trial.
-
Potential impact of bifrontal transcranial random noise stimulation (tRNS) on the semantic Stroop effect and its resting-state EEG correlates.Neurophysiol Clin. 2019 Jun;49(3):243-248. doi: 10.1016/j.neucli.2019.03.002. Epub 2019 Mar 28. Neurophysiol Clin. 2019. PMID: 30930187 Clinical Trial.
-
Three repeated sessions of transcranial random noise stimulation (tRNS) leads to long-term effects on reaction time in the Go/No Go task.Neurophysiol Clin. 2019 Feb;49(1):27-32. doi: 10.1016/j.neucli.2018.10.066. Epub 2018 Nov 7. Neurophysiol Clin. 2019. PMID: 30414823
-
Transcranial random noise stimulation mitigates increased difficulty in an arithmetic learning task.Neuropsychologia. 2016 Jan 29;81:255-264. doi: 10.1016/j.neuropsychologia.2015.12.028. Epub 2015 Dec 28. Neuropsychologia. 2016. PMID: 26731199 Free PMC article.
-
Using noise for the better: The effects of transcranial random noise stimulation on the brain and behavior.Neurosci Biobehav Rev. 2022 Jul;138:104702. doi: 10.1016/j.neubiorev.2022.104702. Epub 2022 May 17. Neurosci Biobehav Rev. 2022. PMID: 35595071 Review.
Cited by
-
Transcranial random noise stimulation combined with cognitive training for treating ADHD: a randomized, sham-controlled clinical trial.Transl Psychiatry. 2023 Aug 2;13(1):271. doi: 10.1038/s41398-023-02547-7. Transl Psychiatry. 2023. PMID: 37528107 Free PMC article. Clinical Trial.
-
Modulating excitation/inhibition balance through transcranial electrical stimulation: physiological mechanisms in animal models.Front Neurosci. 2025 Jul 15;19:1609679. doi: 10.3389/fnins.2025.1609679. eCollection 2025. Front Neurosci. 2025. PMID: 40735292 Free PMC article. Review.
-
Assessing the balance between excitation and inhibition in chronic pain through the aperiodic component of EEG.Elife. 2025 Jan 13;13:RP101727. doi: 10.7554/eLife.101727. Elife. 2025. PMID: 39804154 Free PMC article.
-
Functional connectivity and GABAergic signaling modulate the enhancement effect of neurostimulation on mathematical learning.PLoS Biol. 2025 Jul 1;23(7):e3003200. doi: 10.1371/journal.pbio.3003200. eCollection 2025 Jul. PLoS Biol. 2025. PMID: 40591518 Free PMC article.
-
Aperiodic slope reflects glutamatergic tone in the human brain.bioRxiv [Preprint]. 2025 May 20:2025.05.15.654118. doi: 10.1101/2025.05.15.654118. bioRxiv. 2025. PMID: 40475547 Free PMC article. Preprint.
References
Publication types
MeSH terms
LinkOut - more resources
Full Text Sources
