. 2023 Aug 31;21(8):e3002246.
doi: 10.1371/journal.pbio.3002246. eCollection 2023 Aug.

An interactive deep learning-based approach reveals mitochondrial cristae topologies

Affiliations

An interactive deep learning-based approach reveals mitochondrial cristae topologies

Shogo Suga et al. PLoS Biol. .

Abstract

The convolution of membranes called cristae is a critical structural and functional feature of mitochondria. Crista structure is highly diverse between different cell types, reflecting their role in metabolic adaptation. However, their precise three-dimensional (3D) arrangement requires volumetric analysis of serial electron microscopy and has therefore been limiting for unbiased quantitative assessment. Here, we developed a novel, publicly available, deep learning (DL)-based image analysis platform called Python-based human-in-the-loop workflow (PHILOW) implemented with a human-in-the-loop (HITL) algorithm. Analysis of dense, large, and isotropic volumes of focused ion beam-scanning electron microscopy (FIB-SEM) using PHILOW reveals the complex 3D nanostructure of both inner and outer mitochondrial membranes and provides deep, quantitative, structural features of cristae in a large number of individual mitochondria. This nanometer-scale analysis in micrometer-scale cellular contexts uncovers fundamental parameters of cristae, such as total surface area, orientation, tubular/lamellar cristae ratio, and crista junction density in individual mitochondria. Unbiased clustering analysis of our structural data unraveled a new function for the dynamin-related GTPase Optic Atrophy 1 (OPA1) in regulating the balance between lamellar versus tubular cristae subdomains.


Conflict of interest statement

I have read the journal’s policy and the authors of this manuscript have the following competing interests: HK is an employee of LPIXEL Inc.

Figures

Fig 1
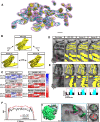
Fig 1. Relationship between F1 score and proofreading time.
(A) A diagram explaining the F1 score. (B) Times required for proofreading 100 × 512 × 512 voxel mitochondrial predictions with various F1 scores until the scores exceed 0.96 were measured. Note that the y-axis is presented in log scale. When the F1 score is less than 0.94 (highlighted with gray), the proofreading time jumps up. Source data can be found in S1 Data. (C, D) Representative images from stacks with high (C) and low (D) F1 score. Yellow arrows indicate areas requiring manual correction. Images with high F1 score have less and simpler mis-prediction than images with low F1 score. The F1 score of each crop is shown at the right bottom. The raw EM data are deposited in the EMPIAR (EMPIAR-11449). EMPIAR, Electron Microscopy Public Image Archive; EM, electron microscopy.
Fig 2
Fig 2. TAP method enables a precise segmentation at the periphery of mitochondria.
(A) A diagram explaining the TAP method. A model trained with sparse annotation on xy-plane images was applied for the virtual yz (red)- and zx (green)-plane images as well as xy (blue)-plane images. Therefore, each voxel has 3 prediction results from 3 axes. An example of 3 predictions (green, red, and blue) visualized from 3 axes are shown in the middle. A majority vote was taken from the 3 predictions, and the result was adopted as the true value. (B) The IoU overlap with the next slice was measured for mitochondria segmentation of each slice from manual segmentation (black) or in the prediction either using the TAP + DL baseline (red) or only DL baseline (pink). The variances of the IoU are shown in the bottom table. Source data can be found in S2 Data. (C, D) 3D reconstructions of a part of mitochondria segmented by a human (C) and TAP method (D). (E) An overlay of cross-sectional views at the zx-plane (blue plane in C, D). Note that the human annotations missed the right-top area and were anomalous at the left. Scale bar, 100 nm. The raw EM data are deposited in the EMPIAR (EMPIAR-11449). EMPIAR, Electron Microscopy Public Image Archive; EM, electron microscopy; TAP, three-axes prediction; 3D, three-dimensional; IoU, intersection over union; DL, deep learning.
Fig 3
Fig 3. The HITL-TAP method on PHILOW improved the segmentation efficiency.
(A) A diagram showing the HITL iterative workflow. The green rectangle indicates processes performed iteratively with human intervention. (B) Comparison of F1 scores between the HITL-mediated iterative learning and conventional DL. Crops of raw image only (left) or overlaid with predictions for mitochondria (magenta) are shown. The F1 score of each crop is shown at the right bottom. In the HITL-mediated iterative learning, annotations of 3 randomly picked areas were used as an initial training dataset. After the first prediction, the annotations on 3 image crops, including image (i), were corrected and combined with the initial training dataset. F1 scores of second prediction with this new training dataset were improved not only in the image (i) but also in the image (ii)–(iv). Four image crops including image (ii) were corrected after the second predictions and combined with the training dataset for the second prediction. After these cycles, the F1 scores were above 0.98 in (i)–(iv). In contrast, without HITL, even with the same number of training datasets, the F1 scores reached only 0.81–0.97. Magnifications of the areas marked with orange rectangles are shown in the bottom. Low confidence areas were highlighted in green to draw attention of the annotators for the manual correction. (C) Times required for correcting the mitochondrial prediction results obtained either inside (0–100 Mvoxel) and outside (100–150 Mvoxel) of the volume used for generating the training data by indicated methods. Magenta: HITL + TAP + DL baseline learning. Green: HITL + DL baseline learning. Dark blue: DL baseline (2D UNet++) only. Gray: without DL (Manual). The speed was calculated from the actual time required for correcting 150 Mvoxel (HITL + TAP + DL baseline, HITL + DL baseline, and DL baseline) or the time estimated from 0.3 Mvoxel of manual correction (Manual). Bars below the graph show the time required for making the training datasets. Numbers below each line indicate voxels visually inspected and corrected in 1 min (Mvoxel/minute). Source data can be found in S3 Data. (D) Representative 3D mitochondrial structures reconstructed from segmentations generated using HITL-TAP method on PHILOW. Scale bar, 500 nm. The raw EM data are deposited in the EMPIAR (EMPIAR-11449). EMPIAR, Electron Microscopy Public Image Archive; EM, electron microscopy; HITL, human-in-the-loop; TAP, three-axes prediction; 3D, three-dimensional; DL, deep learning; 2D, two-dimensional; PHILOW, Python-based human-in-the-loop workflow.
Fig 4
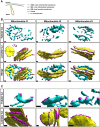
Fig 4. Prediction of crista structures with superhuman accuracy.
(A) Representative crista structures in the mitochondria shown in Fig 3D. Yellow: lamellar structure, Cyan: tubular structure. Scale bar, 500 nm. Three random images of 24 mitochondria were prepared as initial training data for both lamellar and tubular cristae prediction. (B) Comparison of F1 scores among an HITL-TAP prediction and annotations by 2 human experts. Corresponding 3D reconstructed lamellar images are shown. The F1 scores between the HITL-TAP prediction and the annotations by human experts #1 and #2 are 0.787 and 0.817, respectively. This value is higher than the score between human experts (0.780). (C) IoU, F1 score, and precision/recall on tubular structures or lamellar structures between the prediction by the HITL-TAP algorithm and one of the 2 annotations by human experts. (D, E) Segmentation of lamellar structures by HITL-TAP algorithm and human annotators shown in xy-planes (D) and yz-planes (E). The lower panels show areas indicated by rectangles in the upper panels. Yellow: segmentations of lamellar structures. Note that segmentations by human annotators are broader. The narrower HITL-TAP segmentation is more accurate at the voxels highlighted with cyan judging from the continuity in the z-axis (E). (F) Z-axis continuities of lamellar structures segmented by HITL-TAP algorithm (red), human annotator #1 (black) and human annotator #2 (gray) were indicated by IoU between neighboring xy-planes. Source data can be found in S4 Data. (G) Segmentation of crista structures by HITL-TAP algorithm (transparent magenta) and a human annotator (green). The rectangle shows the area shown in (H). (H) Reconstruction of tubular cristae is shown with a slice of serial EM images. Note that the human annotation missed the structures HITL-TAP algorithm segmented (arrowheads). (I, J) yz-view EM images corresponding to the slice in (H) annotated by a human annotator (I) and HITL-TAP algorithm (J). Arrowheads are corresponding to those pointing the tubular structures in (H). The raw EM data are deposited in the EMPIAR (EMPIAR-11449). EMPIAR, Electron Microscopy Public Image Archive; HITL, human-in-the-loop; TAP, three-axes prediction; 3D, three-dimensional; IoU, intersection over union; EM, electron microscopy.
Fig 5
Fig 5. 3D structure of crista junctions reconstructed from FIB-SEM images.
(A) Diagram of mitochondrial subdomains. (B) 3D reconstructions of CJs (magenta) overlaid with tubular (cyan) or lamellar (yellow) cristae. Scale bars, 100 nm. (C) Magnified images of 3D reconstructed CJs and cristae. Scale bars, 100 nm. The raw EM data are deposited in the EMPIAR (EMPIAR-11449). CJ, crista junction; EMPIAR, Electron Microscopy Public Image Archive; EM, electron microscopy; FIB-SEM, focused ion beam-scanning electron microscopy.
Fig 6
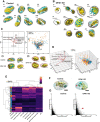
Fig 6. Unsupervised analyses of mitochondria and crista structure in the control and OPA1 KD cells.
(A, B) Representative crista structures of the control (A) or OPA1 KD (B) mitochondria. Scale bars, 300 nm. (C) PCA of individual mitochondria. Parameters of the control mitochondria were used to fit the model. The mitochondria in the control cells are shown as orange dots and mitochondria in OPA1 KD cells are shown as blue dots (Control n = 134; OPA1 KD n = 324). Representative reconstructed 3D mitochondrial and crista structures in the area (i) and (ii) are shown. Scale bars, 300 nm. Source data can be found in S5 Data and S6 Data. (D) 3D view of the PCA result shown in (C). (E) Hierarchical clustering using Ward’s method. Clustering revealed that there are a cluster with a high tubular cristae ratio and enriched with control-derived mitochondria and a cluster with a low tubular cristae ratio characteristic of OPA1 KD. Source data can be found in S7 Data. (F, G) Spatial distribution analysis of the tubular and lamellar cristae. Transparent polygons are submitochondrial volumes divided by the K-means clustering. The ratio of lamellar or tubular cristae in each volume is indicated by the intensity of the blue or yellow colors, respectively (F). Note that there is a green compartment in OPA1 KD cells (arrowhead), while compartments in the control were either yellow or blue. The horizontal axis shows the percentage of tubular cristae in mitochondrial subvolume and the vertical axis shows the percentage of lamellar cristae (G). Each dot represents a mitochondrial subvolume. The arrowhead indicates a dot corresponding to the green compartment in (F). Source data can be found in S8 Data. The raw EM data are deposited in the EMPIAR (EMPIAR-11449). EMPIAR, Electron Microscopy Public Image Archive; EM, electron microscopy; OPA1, optic atrophy 1; 3D, three-dimensional; PCA, principal components analysis, CJ, crista junction; MCI, mitochondrial complexity index.
Fig 7
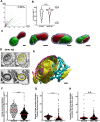
Fig 7. Phenotypes for OPA1-deficient crista structures.
(A) The light colored vectors indicate the angular direction between the vector perpendicular to each lamellar cristae and the mitochondrial long-axis vector. The magnitude was normalized by the inverse of the eigenvalue. The dark colored vectors are the average of vectors from all mitochondria scaled by a factor of 4. Source data can be found in S9 Data. Green: Control; Magenta: OPA1 KD. (B) The average of the angles was calculated for each mitochondrion. Note that the angles are diverse in the control, while most of the angles are concentrated close to 90° in OPA1 KD. Source data can be found in S10 Data. ****p < 0.0001, Mann–Whitney test. (C) Four OPA1 KD mitochondria with complete septa. Each mitochondrion was separated into the green and red compartments by inner membranes. These compartmentalized mitochondria were defined by a septa-detecting algorithm. Scale bars, 20 nm. (D) Representative EM images of onion-like structures in the OPA1 KD cells. Yellow: segmentations of lamellar structures. (E) 3D reconstruction of the onion-like crista structure shown in (D). Yellow: lamellar cristae; Cyan: tubular cristae; Magenta: CJ. Scale bar, 150 nm. (F–H) Statistical analysis of the CJ density in the control and OPA1 KD. CJ density is calculated by dividing the number of CJ by the crista surface area (F). Tubular CJ density is calculated by dividing the number of tubular crista by the tubular surface area, and lamellar CJ density is calculated in the same way (G, H). Source data can be found in S11–S13 Data. ****p < 0.0001, Mann–Whitney test. The raw EM data are deposited in the EMPIAR (EMPIAR-11449). EMPIAR, Electron Microscopy Public Image Archive; OPA1, optic atrophy 1; EM, electron microscopy; CJ, crista junction.

References

    1. West GB, Brown JH, Enquist BJ. The fourth dimension of life: fractal geometry and allometric scaling of organisms. Science. 1999;284(5420):1677–1679. doi: 10.1126/science.284.5420.1677 . - DOI - PubMed
    1. Davies KM, Strauss M, Daum B, Kief JH, Osiewacz HD, Rycovska A, et al.. Macromolecular organization of ATP synthase and complex I in whole mitochondria. Proc Natl Acad Sci U S A. 2011;108(34):14121–6. Epub 2011/08/11. doi: 10.1073/pnas.1103621108 ; PubMed Central PMCID: PMC3161574. - DOI - PMC - PubMed
    1. Friedman JR, Nunnari J. Mitochondrial form and function. Nature. 2014;505(7483):335–343. doi: 10.1038/nature12985 ; PubMed Central PMCID: PMC4075653 - DOI - PMC - PubMed
    1. Scorrano L, Ashiya M, Buttle K, Weiler S, Oakes SA, Mannella CA, et al.. A distinct pathway remodels mitochondrial cristae and mobilizes cytochrome c during apoptosis. Dev Cell. 2002;2(1):55–67. doi: 10.1016/s1534-5807(01)00116-2 . - DOI - PubMed
    1. Mannella CA, Lederer WJ, Jafri MS. The connection between inner membrane topology and mitochondrial function. J Mol Cell Cardiol. 2013;62:51–7. Epub 2013/05/12. doi: 10.1016/j.yjmcc.2013.05.001 ; PubMed Central PMCID: PMC4219563. - DOI - PMC - PubMed

Publication types