. 2023 Aug 31;21(8):e3002253.
doi: 10.1371/journal.pbio.3002253. eCollection 2023 Aug.

The microbiota conditions a gut milieu that selects for wild-type Salmonella Typhimurium virulence

Affiliations

The microbiota conditions a gut milieu that selects for wild-type Salmonella Typhimurium virulence

Ersin Gül et al. PLoS Biol. .

Abstract

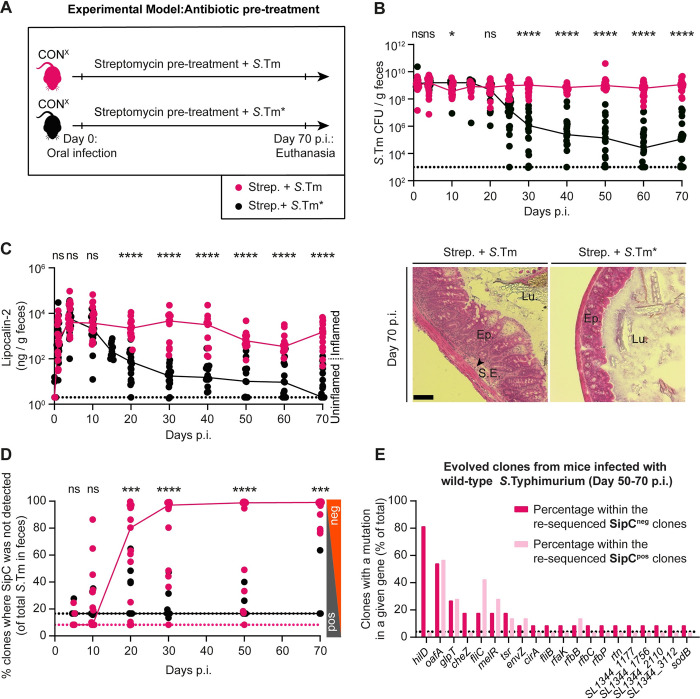
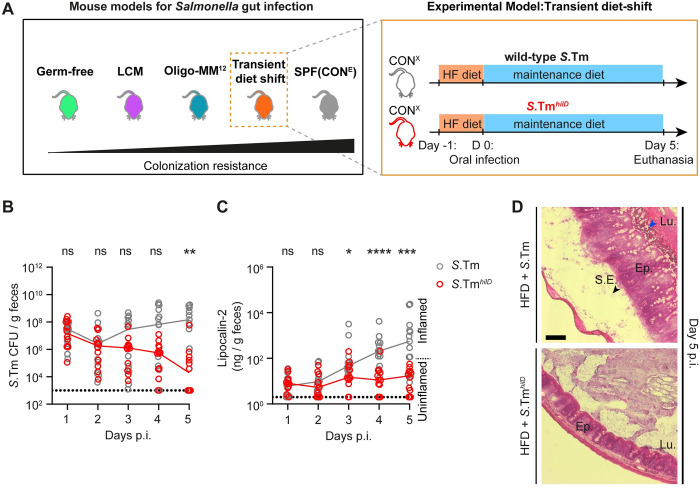
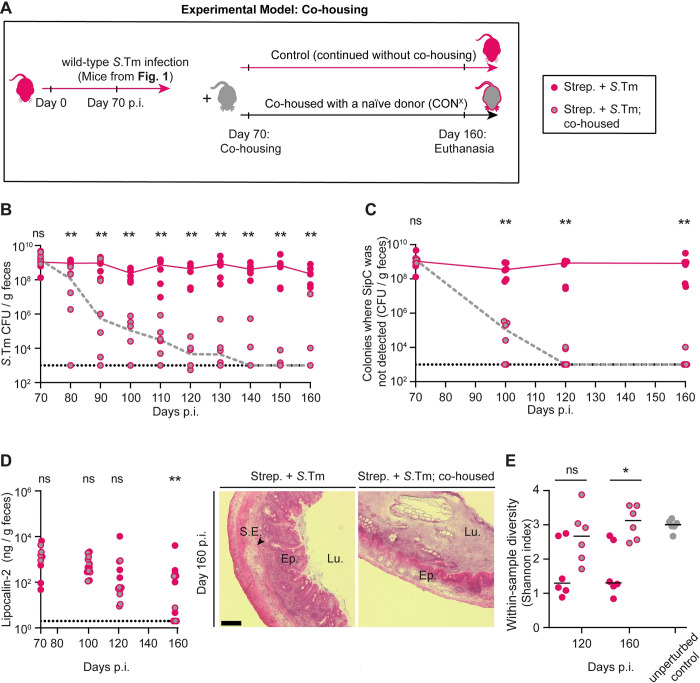
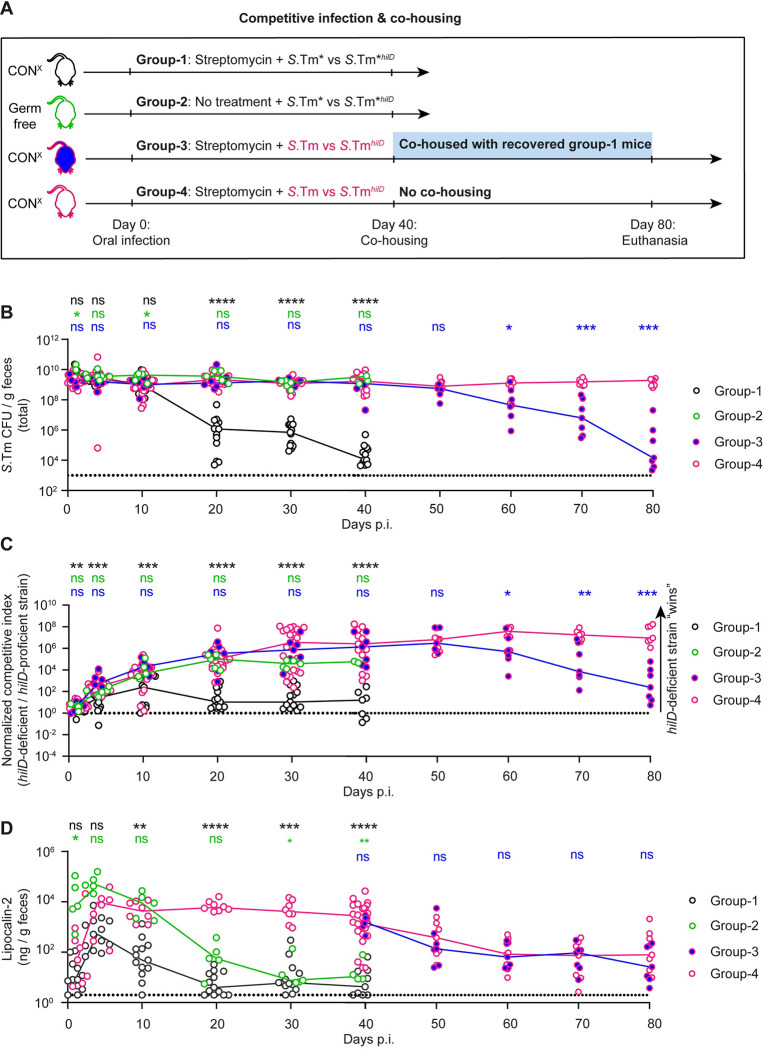
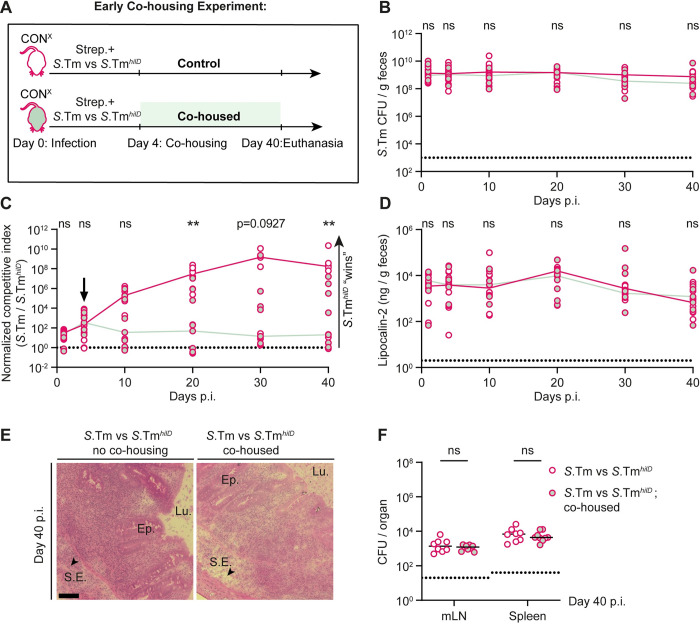
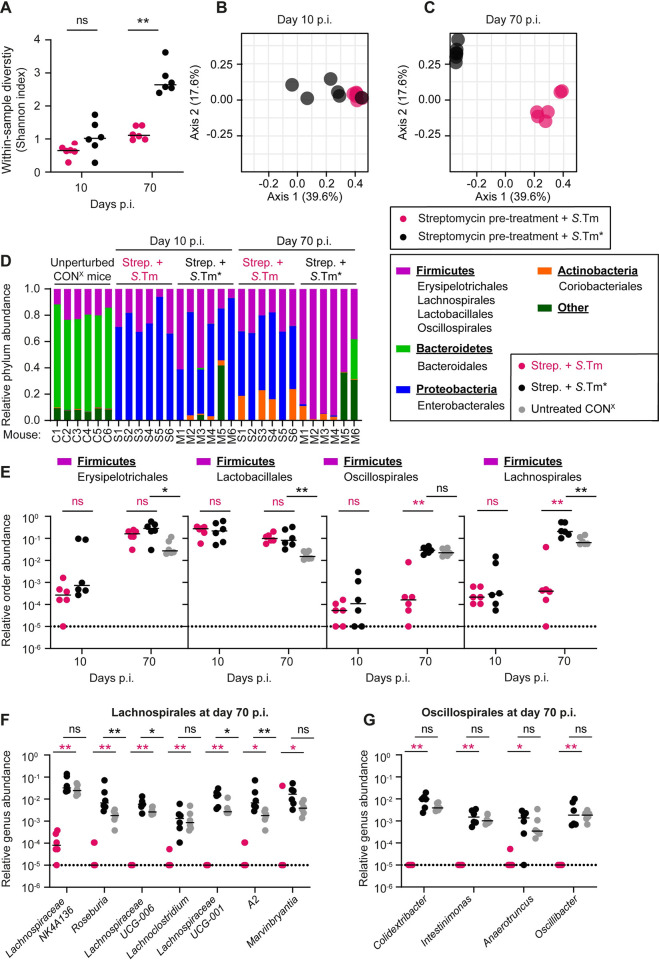
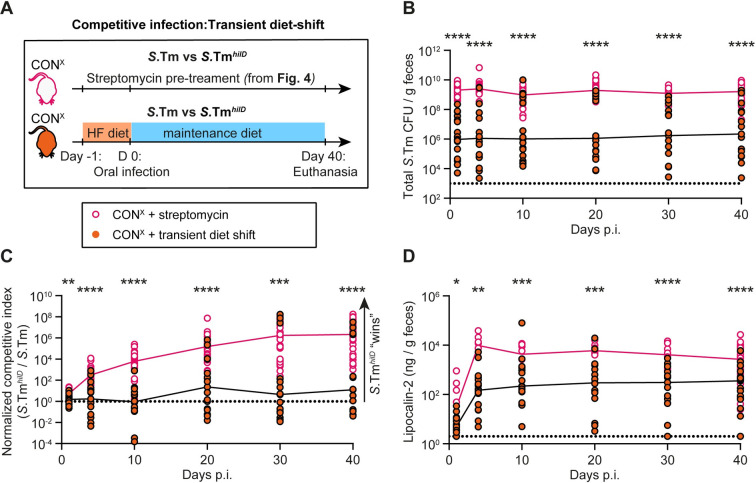
Salmonella Typhimurium elicits gut inflammation by the costly expression of HilD-controlled virulence factors. This inflammation alleviates colonization resistance (CR) mediated by the microbiota and thereby promotes pathogen blooms. However, the inflamed gut-milieu can also select for hilD mutants, which cannot elicit or maintain inflammation, therefore causing a loss of the pathogen's virulence. This raises the question of which conditions support the maintenance of virulence in S. Typhimurium. Indeed, it remains unclear why the wild-type hilD allele is dominant among natural isolates. Here, we show that microbiota transfer from uninfected or recovered hosts leads to rapid clearance of hilD mutants that feature attenuated virulence, and thereby contributes to the preservation of the virulent S. Typhimurium genotype. Using mouse models featuring a range of microbiota compositions and antibiotic- or inflammation-inflicted microbiota disruptions, we found that irreversible disruption of the microbiota leads to the accumulation of hilD mutants. In contrast, in models with a transient microbiota disruption, selection for hilD mutants was prevented by the regrowing microbiota community dominated by Lachnospirales and Oscillospirales. Strikingly, even after an irreversible microbiota disruption, microbiota transfer from uninfected donors prevented the rise of hilD mutants. Our results establish that robust S. Typhimurium gut colonization hinges on optimizing its manipulation of the host: A transient and tempered microbiota perturbation is favorable for the pathogen to both flourish in the inflamed gut and also minimize loss of virulence. Moreover, besides conferring CR, the microbiota may have the additional consequence of maintaining costly enteropathogen virulence mechanisms.


Conflict of interest statement

The authors have declared that no competing interests exist.

Figures

Fig 1
Fig 1. Selection for mutants with reduced virulence in streptomycin pretreated CONX mice infected with wild-type S.
Typhimurium or S.Tm*. (A) Scheme summarizing the experiment in Panels B–D. (B–D) Streptomycin pretreated CONX mice were infected with wild-type S. Typhimurium (SL1344 WT; pink, filled circles; n = 19; 4 independent experiments) or S.Tm* (SL1344 ΔssaV; black, filled circles; n = 22; 3 independent experiments) for 70 days. (B) Fecal Salmonella populations as determined using MacConkey plates with selective antibiotics. (C) Gut inflammation. Left: ELISA data measuring the Lipocalin-2 concentration in fecal pellets. We analyzed samples from at least n = 11 animals per time point. Dotted lines indicate the detection limit. Colored lines connect the medians. Right: representative images of HE-stained cecum tissue sections showing intestinal crypts to assess the severity of enteric disease [19]; scale bar 100 μm. (D) Percentage of colonies without detectable SipC (as measured by colony protein blot). Colored lines connect the medians. Two-tailed Mann–Whitney U tests were used to compare the wild-type S. Typhimurium to the S.Tm* data (p ≥ 0.05 not significant (ns), p < 0.05 (*), p < 0.01 (**), p < 0.001 (***), p < 0.0001 (****)). Source data can be found in S1 Data file. (E) Whole-genome sequencing was performed from clones re-isolated from mice in Panels B–D. A complete overview of non-synonymous mutations is summarized in S1–S6 Tables. The graph illustrates the 20 genes most frequently mutated in clones re-isolated from mice infected with wild-type S. Typhimurium at day 50–70 p.i. Dark pink: mutations from clones without detectable SipC expression (n = 11 independent clones were analyzed). Light pink: mutations from clones where SipC was detected (n = 11 independent clones were analyzed). The dotted line indicates the percentage that corresponds to a mutation which occurs in just 1 clone. Genes mutated only in mutS mutant strains (i.e., mutator clones) are excluded. Only non-synonymous mutations and genes disrupted by stop codons or frameshifts are shown.
Fig 2
Fig 2. Reduced virulence of S.TmhilD in the high-fat diet shift model.
(A) Experimental scheme. CONX mice that were shifted to high-fat diet for 1 day (and shifted back to maintenance diet on the day of infection) were infected for 5 days with wild-type S. Typhimurium (gray, empty circles; n = 13 mice) or S.TmhilD (red, empty circles; n = 12 mice; 5 × 10⁷ CFU, by gavage). (B) Salmonella loads in the feces, as determined using MacConkey plates with selective antibiotics. (C) Lipocalin-2 centration in the feces, as determined by ELISA. Dotted lines indicate the detection limit. Colored lines connect the medians. (D) Representative images of HE-stained cecum tissue sections; scale bar 100 μm. The data were obtained in 2 independent experiments. Two-tailed Mann–Whitney U tests were used to compare the wild-type S. Typhimurium to the S.TmhilD data (p ≥ 0.05 not significant (ns), p < 0.05 (*), p < 0.01 (**), p < 0.001 (***), p < 0.0001 (****)). Source data can be found in S1 Data file.
Fig 3
Fig 3. Microbiota transfer from uninfected CONX mice displaces mutant-dominated Salmonella populations from wild-type S.
Typhimurium infected mice. (A) Experimental scheme. After day 70 of infection with wild-type S. Typhimurium (from Fig 1A–1E; n = 12) the mice were either co-housed with an untreated CONX mouse (pink, gray filled circles; n = 6 mice; each infected mouse was caged with a healthy mouse) or kept under hygienic isolation (pink filled circles; n = 6 mice). (B) Salmonella population sizes as determined using MacConkey plates with selective antibiotics. (C) Size of Salmonella population that did not yield SipC signals in the colony protein blot assay, as determined by multiplying the percentage of the colonies without detectable SipC signal with the pathogen population (as shown in B). (D) Gut inflammation. Left: Lipocalin-2 concentration in the feces, as determined by ELISA (fecal pellets from at least n = 6 mice analyzed per time point). Dotted lines indicate the detection limit. Lines connect the median values at the days of analysis. Right: representative images of HE-stained cecum tissue sections; scale bar 100 μm. (E) Microbial community analysis of fecal samples at day 120 and day 160 p.i. The within-sample diversity was measured using the Shannon Index (pink circles: no co-housing, pink, gray filled circles: co-housed; gray circles; feces from donor mice (that is unperturbed CONX animals)). The data shown was obtained from 2 independent experiments including comparing both groups. Two-tailed Mann–Whitney U tests were used to compare the data from mice with or without co-housing at each time point (p ≥ 0.05 not significant (ns), p < 0.05 (*), p < 0.01 (**), p < 0.001 (***), p < 0.0001 (****)). Source data can be found in S1 Data file.
Fig 4
Fig 4. Microbiota transfer from S.Tm*-infected mice can displace the mutant-dominated pathogen population selected for during wild-type S.
Typhimurium infection. (A) Experimental scheme. We employed 4 groups of mice: 1. Streptomycin pretreated CONX mice were infected for 40 days with a 1:10 (n = 6 mice) or a 100:1 (n = 7 mice) S.Tm* vs. S.Tm*hilD (black symbols with white filling; n = 13 mice; 5 × 10⁷ CFU, by gavage). By day 40 p.i., this group yielded the donor mice (black). 2. Germ-free C57BL/6 mice were infected for 40 days with a 100:1 mix of S.Tm* vs. S.Tm*hilD (green symbols with white filling; n = 5 mice; 5 × 10⁷ CFU, by gavage). 3. and 4. Streptomycin pretreated CONX mice were infected for 40 days with a 1:10 (n = 8 mice) or a 100:1 (n = 20 mice) mix of S.Tm* vs. S.Tm*hilD (pink symbols with blue filling, or pink symbols with white filling respectively; 5 × 10⁷ CFU, by gavage). By day 40 p.i., this yielded the 2 experimental groups. 3. At day 40, we co-housed mice from group 3 (n = 7 mice) with mice from group 1 and followed the infection until day 80. 4. The mice remained under hygienic isolation (n = 7 mice) until day 80 p.i. (B) Total Salmonella loads in the feces, as determined using MacConkey plates with selective antibiotics. (C) Competitive index of the hilD-deficient vs. the hilD-proficient strains in the respective groups, as calculated from selective plating data. (D) Lipocalin-2 concentration in the feces, as determined by ELISA (fecal pellets from 5 to 14 mice per group, as indicated per group and per time point). Colored lines connect the medians. For each group, we show the pooled data from at least 2 independent experiments. Group 2 shows data from 1 experiment with 2 cohorts. Two-tailed Mann–Whitney U tests were used to compare the indicated groups: black symbols: group 1 vs. groups 4 (between days 0–40 p.i.); green symbols: group 2 vs. group 4 (between days 0–40 p.i.); blue symbols: group 3 vs. group 4 (between days 0–80 p.i.). (p ≥ 0.05 not significant (ns), p < 0.05 (*), p < 0.01 (**), p < 0.001 (***), p < 0.0001 (****)). Source data can be found in S1 Data file.
Fig 5
Fig 5. Early microbiota transfer experiment to test the effect of the microbiota transfer before hilD mutants dominate the fecal population.
(A) Experimental scheme. (B–F) Streptomycin pretreated CONX mice (n = 8 or n = 9 per group) were infected with a 106:1 mixture of wild-type S. Typhimurium and an isogenic hilD mutant (5 × 10⁷ CFU, by gavage). The first group remained in hygienic isolation (control; pink empty circles; n = 8), while the second group was co-housed from day 4 on with a naïve CONX mouse (pink, light green filled circles; n = 9). The groups were kept as such until the end of the experiment (day 40 p.i.). (B) Total Salmonella loads detected in the feces by selective plating. Dotted lines indicate the detection limit. Colored lines connect the medians. (C) The C.I. as determined using MacConkey plates with selective antibiotics and shown for wild-type S. Typhimurium versus S.TmhilD. The dotted line indicates a C.I. of 1. (D) An ELISA for fecal lipocalin-2 was used to compare gut inflammation between the 2 groups. (E) Representative images of HE-stained cecum tissue sections; scale bar 100 μm. (F) Total Salmonella organ loads. Lines indicate the median. mLN = mesenteric lymph node. The data shown was obtained from 2 independent experiments including comparing both groups. Two-tailed Mann–Whitney U tests were used for statistical analysis (p ≥ 0.05 not significant (ns), p < 0.05 (*), p < 0.01 (**), p < 0.001 (***), p < 0.0001 (****)).Source data can be found in S1 Data file.
Fig 6
Fig 6. Long-lasting effect of wild-type S.
Typhimurium on the gut microbiota composition of streptomycin pretreated CONX mice. 16S sequencing was performed to analyze the microbial community in fecal samples from unperturbed CONX mice sampled at day 10 and day 70 p.i. in the experiment shown in Fig 1B–1D. (A) Within-sample diversity measured using Shannon Index (pink circles: wild-type S. Typhimurium infection; black circles: S.Tm* infection). (B, C) Principal coordinate analysis based on Bray–Curtis dissimilarities between samples (after the square-root transformation of abundances). Data points represent individual mice, and a colored border defines the grouping of data points within each sample group. (PERMANOVA R2 = 0.397 and p = 0.0045 for day 10 p.i. and R2 = 0.661 and p = 0.0024 for day 70 p.i. (D) Relative abundances ASVs at the phylum level. The 4 most abundant phyla are shown, with the rest of the community shown as “other”. (E) Relative abundances of most abundant orders belonging to the phylum of Firmicutes. Orders were compared at day 10 and 70 p.i. Fecal microbiota from unperturbed CONX mice (gray circles), which served as donors in Fig 3, were used as controls. (F, G) Relative abundances of most abundant genera belonging to the orders of Lachnospirales and Oscillospirales, respectively. Genera were compared at day 10 and 70 p.i. between wild-type S. Typhimurium and S.Tm*-infected mice; fecal microbiota from unperturbed CONX mice (gray circles) were used as controls. (E–G) Dotted line indicates the detection limit. Lines indicate the median. Two-tailed Mann–Whitney U tests were used to compare wild-type S. Typhimurium to S.Tm*-infected samples (Panel A black stars, Panel E–G pink stars) or S.Tm* infected to untreated CONX mice (Panel E–G; black stars) (p ≥ 0.05 not significant (ns), p < 0.05 (*), p < 0.01 (**), p < 0.001 (***), p < 0.0001 (****)). Source data can be found in S1 Data file.
Fig 7
Fig 7. After high-fat diet shift, selection for hilD mutants is reduced compared to streptomycin pretreated mice.
(A) Experimental scheme. (B–D) CONX were shifted from their normal plant based diet to a high-fat diet for the day before the infection (and switched back to the normal diet) with a 100:1 mixture of wild-type S. Typhimurium vs. S.TmhilD (orange symbols; 5 × 10⁷ CFU, by gavage; n = 17 mice 2 independent experiments). The equivalent data for streptomycin pretreated mice is shown as a control (black symbols; re-plotted from Fig 4A). (B) Total Salmonella loads detected in the feces by selective plating. Dotted lines indicate the detection limit. Colored lines connect the medians. (C) Normalized C.I. as determined using MacConkey plates with selective antibiotics for wild-type S. Typhimurium vs. S.TmhilD. The dotted line indicates a C.I. of 1. (D) An ELISA for fecal lipocalin-2 was used to compare gut inflammation between the 2 groups. The data shown was obtained from 2 independent experiments including comparing both groups. Two-tailed Mann–Whitney U tests were used for statistical analysis (p ≥ 0.05 not significant (ns), p < 0.05 (*), p < 0.01 (**), p < 0.001 (***), p < 0.0001 (****)). Source data can be found in S1 Data file.

Similar articles

Cited by

References

    1. Jandhyala SM, Talukdar R, Subramanyam C, Vuyyuru H, Sasikala M, Reddy DN. Role of the normal gut microbiota. World J Gastroentero. 2015;21(29):8787–8803. doi: 10.3748/wjg.v21.i29.8787 WOS:000360189600005 - DOI - PMC - PubMed
    1. Valdes AM, Walter L, Segal E, Spector TD. Role of the gut microbiota in nutrition and health. Bmj-Brit Med J. 2018;361. ARTN j2179 doi: 10.1136/bmj.k2179 WOS:000435635800004. - DOI - PMC - PubMed
    1. Stecher B, Berry D, Loy A. Colonization resistance and microbial ecophysiology: using gnotobiotic mouse models and single-cell technology to explore the intestinal jungle. Fems Microbiol Rev. 2013;37(5):793–829. doi: 10.1111/1574-6976.12024 WOS:000322228500007. - DOI - PubMed
    1. Kreuzer M, Hardt WD. How food affects colonization resistance against enteropathogenic bacteria. Annu Rev Microbiol. 2020;74:787–813. doi: 10.1146/annurev-micro-020420-013457 WOS:000613937400037. - DOI - PubMed
    1. Anderson RM, May RM. Coevolution of Hosts and Parasites. Parasitology. 1982;85(Oct):411–26. doi: 10.1017/s0031182000055360 WOS:A1982PP03200017. - DOI - PubMed

Publication types

Substances

LinkOut - more resources