. 2023 Aug 31;17(8):e0011607.
doi: 10.1371/journal.pntd.0011607. eCollection 2023 Aug.

Iron-overload-induced ferroptosis in mouse cerebral toxoplasmosis promotes brain injury and could be inhibited by Deferiprone

Affiliations

Iron-overload-induced ferroptosis in mouse cerebral toxoplasmosis promotes brain injury and could be inhibited by Deferiprone

Chong Wang et al. PLoS Negl Trop Dis. .

Abstract

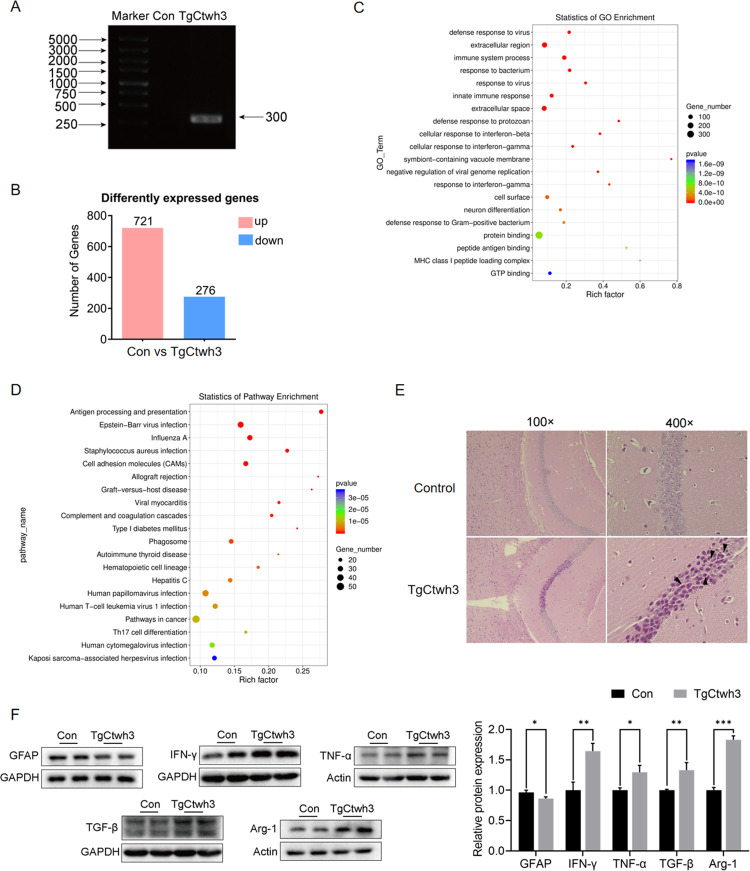
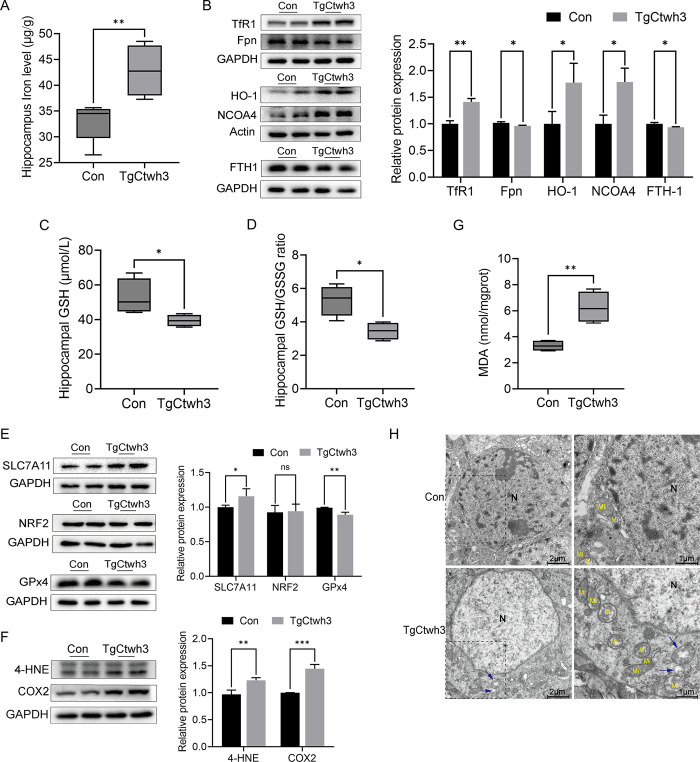
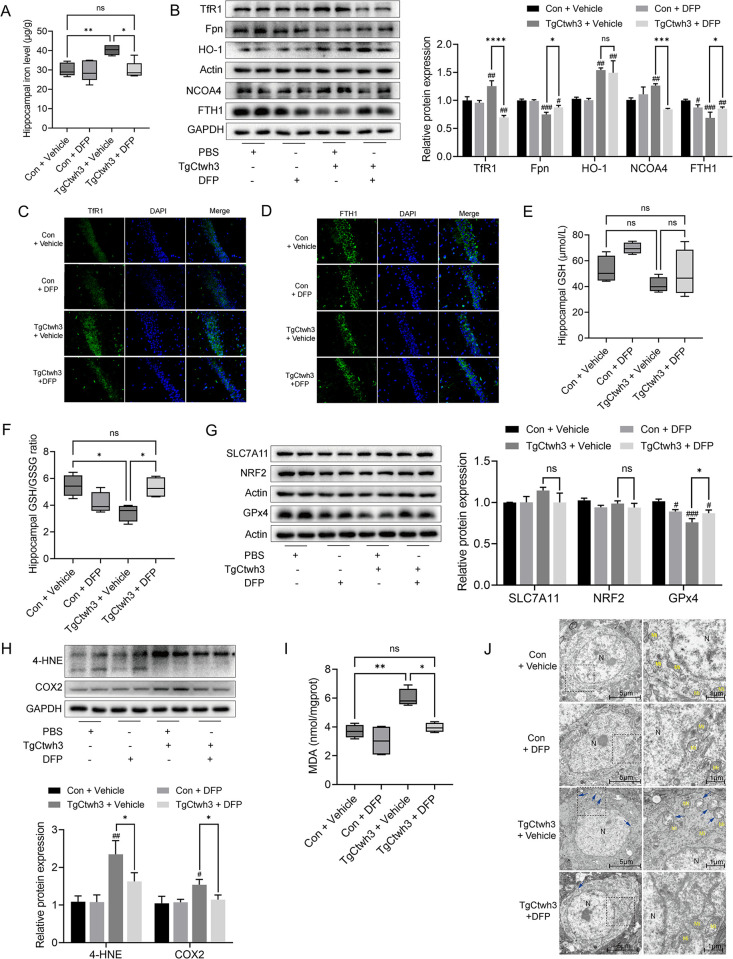
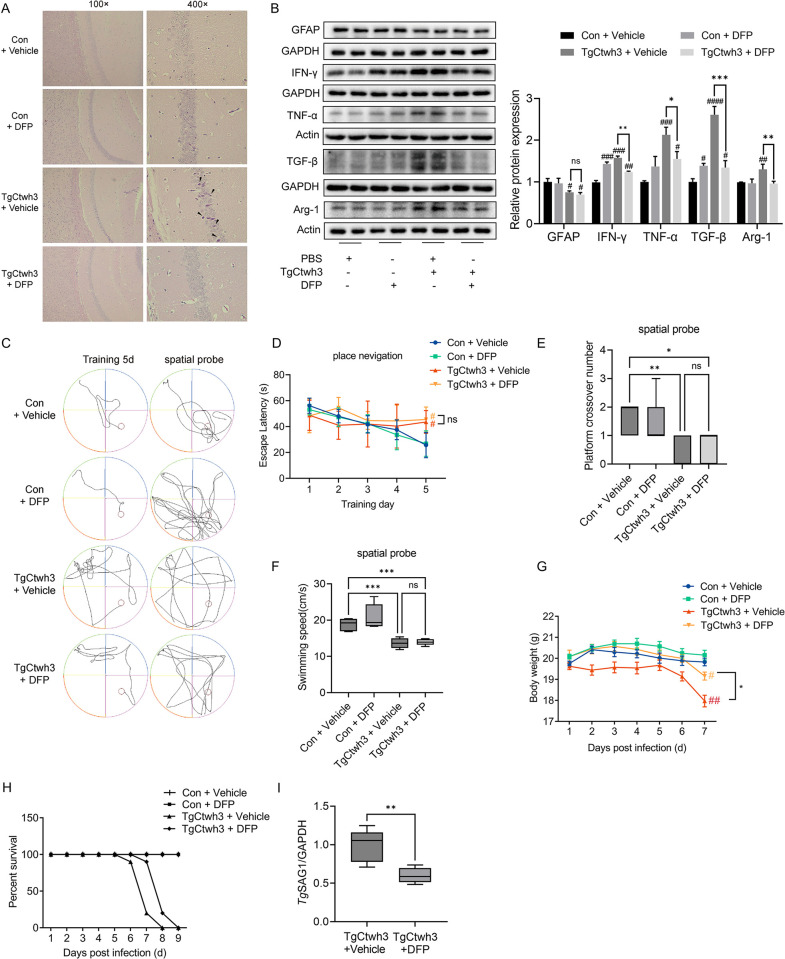
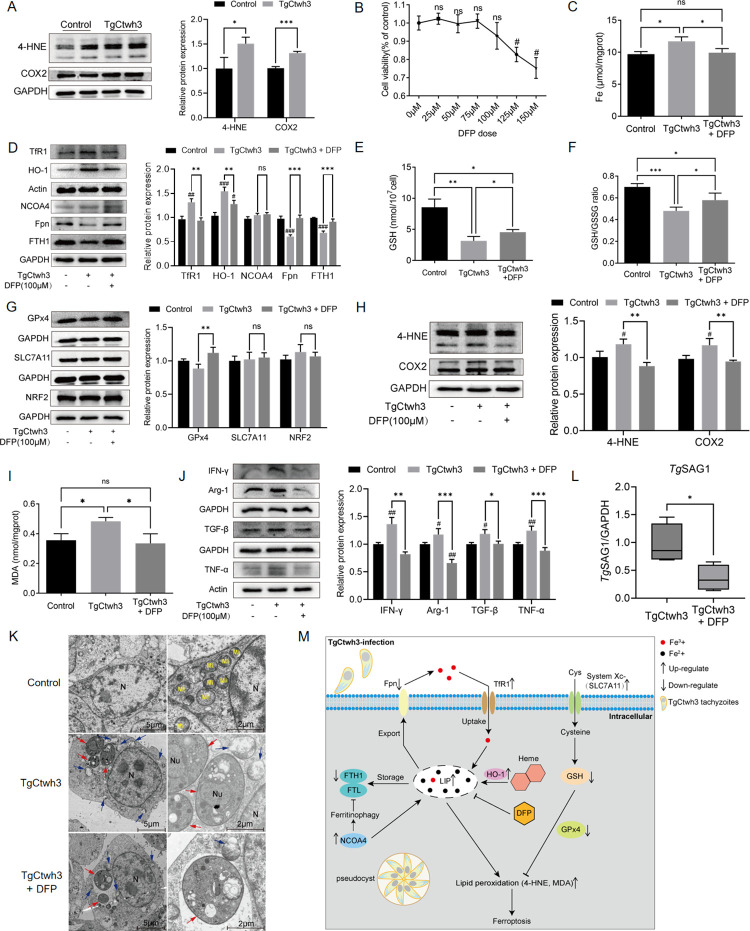
Iron is a trace metal element that is essential for the survival of cells and parasites. The role of iron in cerebral toxoplasmosis (CT) is still unclear. Deferiprone (DFP) is the orally active iron chelator that binds iron in a molar ratio of 3:1 (ligand:iron) and promotes urinary iron excretion to remove excess iron from the body. The aims of this experiment were to observe the alterations in iron in brains with Toxoplasma gondii (T. gondii) acute infections and to investigate the mechanism of ferroptosis in CT using DFP. We established a cerebral toxoplasmosis model in vivo using TgCtwh3, the dominant strains of which are prevalent in China, and treated the mice with DFP at a dose of 75 mg/kg/d. Meanwhile, we treated the HT-22 cells with 100 μM DFP for half an hour and then infected cells with TgCtwh3 in vitro. A qRT-PCR assay of TgSAG1 levels showed a response to the T. gondii burden. We used inductively coupled plasma mass spectrometry, an iron ion assay kit, Western blot analysis, glutathione and glutathione disulfide assay kits, a malonaldehyde assay kit, and immunofluorescence to detect the ferroptosis-related indexes in the mouse hippocampus and HT-22 cells. The inflammatory factors interferon-γ, tumor necrosis factor-α, transforming growth factor-β, and arginase 1 in the hippocampus and cells were detected using the Western blot assay. Hematoxylin and eosin staining, electron microscopy, and the Morris water maze experiment were used to evaluate the brain injuries of the mice. The results showed that TgCtwh3 infection is followed by the activation of ferroptosis-related signaling pathways and hippocampal pathological damage in mice. The use of DFP led to ferroptosis resistance and attenuated pathological changes, inflammatory reactions and T. gondii burden of the mice, prolonging their survival time. The HT-22 cells with TgCtwh3 activated the ferroptosis pathway and was inhibit by DFP in vitro. In TgCtwh3-infected cells, inflammatory response and mitochondrial damage were severe, but these effects could be reduced by DFP. Our study elucidates the mechanism by which T. gondii interferes with the host's iron metabolism and activates ferroptosis, complementing the pathogenic mechanism of CT and further demonstrating the potential value of DFP for the treatment of CT.


Conflict of interest statement

The authors have declared that no competing interests exist.

Figures

Fig 1
Fig 1. Construction and detection of the TgCtwh3 cerebral toxoplasmosis model.
(A) Electrophoretic map of the hippocampal DNA of uninfected and infected mice. (B) RNA-seq data-based differentially expressed gene analysis between uninfected and infected mice hippocampus. Data of n = 3 biological replicates. (C) GO analyses of RNA-seq data showed the top 20 enriched GO terms pre- and post-infection. (D) KEGG analyses of RNA-seq data showed the top 20 enriched pathways in the hippocampus between pre- and post-infection. (E) Representative H&E images of hippocampal formation CA1 from uninfected and infected mice. Single black arrowheads, necrotic cells. (F) Western blot analysis of GFAP, IFN-γ, TNF-α, TGF-β and Arg-1 expression in hippocampus. *P<0.05, ** P<0.01, *** P<0.001. Mice were infected with TgCtwh3 for seven days.
Fig 2
Fig 2. The expression of ferroptosis-related indicators and mitochondrial ultrastructural changes in the hippocampus of mice.
(A) Determination of iron levels in the hippocampus of mice between uninfected and TgCtwh3 infected by ICP-MS. Data represent mean ± SD of n = 5 biological replicates. Statistical significance was calculated by two-tailed Student’s t-test. (B) Western blot analysis of TfR1, Fpn, HO-1, NCOA4, FTH1 expression in hippocampus. Hippocampal GSH (C) and GSH/GSSG ratio (D). Data represent mean ± SD of n = 4 biological replicates. Statistical significance of GSH was calculated by two-tailed Student’s t-test, and the data of GSH/GSSG ratio were analyzed using Mann Whitney U test. (E) Western blot analysis of SLC7A11, NRF2, GPx4 expression in hippocampus. (F) Western blot analysis of 4-HNE, COX2 expression in hippocampus. (G) MDA level in hippocampus. Data represent mean ± SD of n = 4 biological replicates. Statistical significance was calculated by Mann Whitney U test. (H) Electron micrographs showing mitochondria in hippocampus tissues obtained from uninfected and TgCtwh3 infected mice. N: nucleus; Mi: normal mitochondria; Blue arrow: damaged mitochondria. *P<0.05, ** P<0.01, *** P<0.001; ns, not significant. Mice were infected with TgCtwh3 for seven days.
Fig 3
Fig 3. DFP inhibited ferroptosis and lipid peroxidation in the hippocampus of TgCtwh3-infected mice.
(A) The iron levels in the hippocampus of mice in the con + vehicle, con + DFP, TgCtwh3 + vehicle and TgCtwh3 + DFP groups were determined using ICP-MS. Data represent mean ± SD of n = 5 biological replicates. (B) Western blot analysis of TfR1, Fpn, HO-1, NCOA4, FTH1 expression in the hippocampus. (C) Immunofluorescent images indicating TfR1 (green) in the CA1 region of the hippocampus at 400× with DAPI (blue). (D) Immunofluorescent images indicating FTH1 (green) in the CA1 region of the hippocampus at 400× with DAPI (blue). Hippocampal GSH (E) and GSH/GSSG ratio (F). Data represent mean ± SD of n = 4 biological replicates. (G) Western blot analysis of SLC7A11, NRF2, GPx4 expression in hippocampus. (H) Western blot analysis of 4-HNE, COX2 expression in hippocampus. (I) MDA level in hippocampus. Data represent mean ± SD of n = 4 biological replicates. (J) Electron micrographs of hippocampal tissue from uninfected mice, uninfected DFP-applied mice, TgCtwh3-infected mice, and TgCtwh3-infected DFP-applied mice. N, nucleus of TH-22 cells; Mi, normal mitochondria; blue single arrow, damaged mitochondria. Statistical significance was calculated by Brown-Forsythe and Welch’s ANOVA with Dunnett’s T3 multiple comparison test. #P<0.05, ##P< 0.01, ###P<0.001 versus control; *P<0.05, **P<0.01, ***P<0.001, ****P<0.0001; ns, not significant. Mice were infected with TgCtwh3 for seven days.
Fig 4
Fig 4. To detect the pathology, inflammation, behavior, survival, and T. gondii burden in mice after the use of DFP.
(A) Representative H&E images of the hippocampal formation of CA1 from mice in the con + vehicle, con + DFP, TgCtwh3 + vehicle, and TgCtwh3 + DFP groups. Single black arrowheads, necrotic cells. (B) Western blot analysis of GFAP, IFN-γ, TNF-α, TGF-β and Arg-1 expression in hippocampus. (C) Morris water maze trajectory diagram of mice arriving at the platform on the fifth day of place navigation and the spatial probe test. (D) Escape latency of the place navigation. (E) Platform crossover number of the spatial probe. (F) Swimming speed of the spatial probe. (G) Body weight changes of mice in the above four groups. (H) Percent survival of mice in the above four groups, n = 10 mine. (I) QRT-PCR was used to detect the mRNA expression level of TgSAG1 in hippocampus of TgCtwh3 infected mice, and GAPDH was used as reference mRNA, and statistical significance was calculated by two-tailed Student’s t-test, n = 6 mice. Data represent mean ± SD of n = 7 biological replicates. Statistical significance was calculated by Brown-Forsythe and Welch’s ANOVA with Dunnett’s T3 multiple comparison test. #P<0.05, ##P<0.01, ###P<0.001, ####P<0.0001 versus control; *P<0.05, **P<0.01, ***P<0.001; ns, not significant. Mice were infected with TgCtwh3 for seven days.
Fig 5
Fig 5. The iron-overload induced ferroptosis of TgCtwh3-infected HT-22 cells in vitro could be inhibited by DFP.
(A) Western blot analysis of 4-HNE and COX2 expression in the HT-22 cells uninfected and infected with the TgCtwh3. (B) The CCK-8 test detects the cell viability of HT-22 cells after applying doses of 0, 25, 50, 75, 100, 125, and 150 μM of DFP. Data represent mean ± SD of n = 6 biological replicates. Statistical significance was calculated by Brown-Forsythe and Welch’s ANOVA with Dunnett’s T3 multiple comparison test. #P<0.05, ns, not significant versus 0μM DFP dose. (C) Iron was measured in the cells of control, TgCtwh3, and TgCtwh3 + DFP groups via an Intracellular Iron Colorimetric Assay. Data represent mean ± SD of n = 3 biological replicates. Statistical significance was calculated by one-way ANOVA. (D) Western blot analysis of TfR1, HO-1, NCOA4, Fpn, FTH1 expression in the above three groups of cells. GSH (E) and GSH/GSSG ratio (F) in the above three groups of cells. Data represent mean ± SD of n = 4 biological replicates. Statistical significance was calculated by one-way ANOVA. (G) Western blot analysis of GPx4, SLC7A11, NRF2 expression in the above three groups of cells. (H) Western blot analysis of 4-HNE, COX2 expression in the above three groups of cells. (I) MDA level of cells. Data represent mean ± SD of n = 4 biological replicates. Statistical significance was calculated by Brown-Forsythe and Welch’s ANOVA with Dunnett’s T3 multiple comparison test. (J) Western blot analysis of IFN-γ, TNF-α, TGF-β and Arg-1 expression of cells. (K) Transmission electron microscopy was used to observe the ultrastructure of the cells. N, nucleus of HT-22 cells; Nu, nucleus of TgCtwh3 tachyzoites; Red single arrow, TgCtwh3 tachyzoites; Mi, normal mitochondria; Blue single arrow, damaged mitochondria. (L) QRT-PCR was used to detect the mRNA expression level of TgSAG1 in HT-22 cells, and GAPDH was used as a reference mRNA. Data of n = 4 biological replicates, and statistical significance was calculated by two-tailed Student’s t-test. (M) Schematic representation of the mechanism of action of ferroptosis in hippocampal cell damage due to TgCtwh3 infection. After the TgCtwh3 infection, LIP and overall cellular iron levels were elevated in response to TfR1, NCOA4, HO-1, Fpn, and FTH1, and excess iron promoted lipid peroxidation. GSH and GPx4 were downregulated after infection, and the antibody oxidation capacity of cells was decreased, which eventually led to lipid peroxidation and induced cellular ferroptosis. #P<0.05, ##P<0.01, ###P<0.001 versus control; *P<0.05, **P<0.01, ***P<0.001; ns, not significant. HT-22 cells were infected with TgCtwh3 for 24 h.

References

    1. Kochanowsky JA, Koshy AA. Toxoplasma gondii. Curr Biol. 2018;28(14):R770–R1. Epub 2018/07/25. doi: 10.1016/j.cub.2018.05.035 . - DOI - PubMed
    1. Elsheikha HM, Marra CM, Zhu XQ. Epidemiology, Pathophysiology, Diagnosis, and Management of Cerebral Toxoplasmosis. Clin Microbiol Rev. 2021;34(1):e00115–19. Epub 2020/11/27. doi: 10.1128/CMR.00115-19 ; PubMed Central PMCID: PMC7690944. - DOI - PMC - PubMed
    1. Azovtseva OV, Viktorova EA, Bakulina EG, Shelomov AS, Trofimova TN. Cerebral toxoplasmosis in HIV-infected patients over 2015–2018 (a case study of Russia). Epidemiol Infect. 2020;148:e142. Epub 2020/05/05. doi: 10.1017/S0950268820000928 ; PubMed Central PMCID: PMC7374806. - DOI - PMC - PubMed
    1. Robert-Gangneux F, Meroni V, Dupont D, Botterel F, Garcia JMA, Brenier-Pinchart MP, et al.. Toxoplasmosis in Transplant Recipients, Europe, 2010–2014. Emerg Infect Dis. 2018;24(8):1497–504. Epub 2018/07/18. doi: 10.3201/eid2408.180045 ; PubMed Central PMCID: PMC6056100. - DOI - PMC - PubMed
    1. Szewczyk-Golec K, Pawlowska M, Wesolowski R, Wroblewski M, Mila-Kierzenkowska C. Oxidative Stress as a Possible Target in the Treatment of Toxoplasmosis: Perspectives and Ambiguities. Int J Mol Sci. 2021;22(11):5705. Epub 2021/06/03. doi: 10.3390/ijms22115705 ; PubMed Central PMCID: PMC8198901. - DOI - PMC - PubMed

Publication types