Linking Local-Level Chronic Disease and Social Vulnerability Measures to Inform Planning Efforts: A COPD Example
- PMID: 37651645
- PMCID: PMC10487786
- DOI: 10.5888/pcd20.230025
Linking Local-Level Chronic Disease and Social Vulnerability Measures to Inform Planning Efforts: A COPD Example
Abstract
Introduction: Data are publicly available to identify geographic differences in health outcomes, including chronic obstructive pulmonary disease (COPD), and social vulnerability; however, examples of combining data across sources to understand disease burden in the context of community vulnerability are lacking.
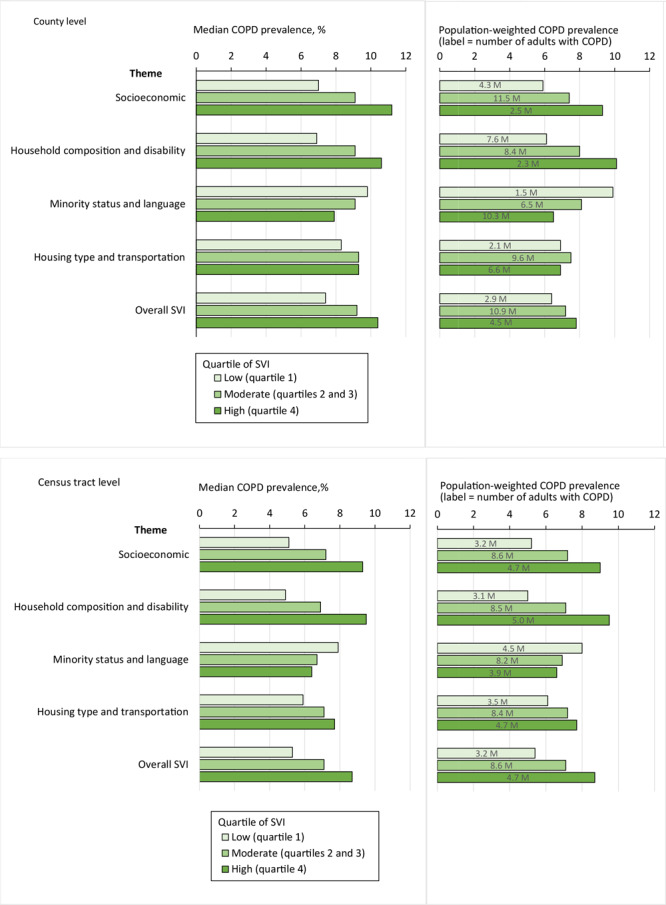
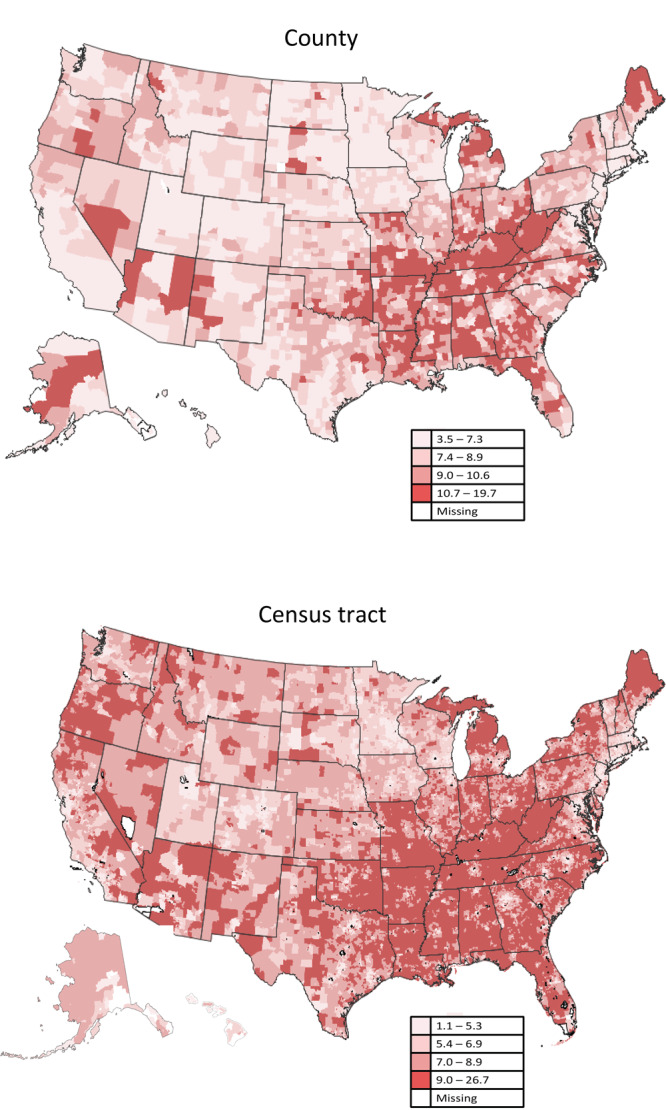
Methods: We merged county and census tract model-based estimates of COPD prevalence from PLACES (www.cdc.gov/PLACES) with social vulnerability measures from the Centers for Disease Control and Prevention/Agency for Toxic Substances and Disease Registry Social Vulnerability Index (https://www.atsdr.cdc.gov/placeandhealth/svi), including 4 themes (socioeconomic, household composition and disability, minority status and language, and housing type and transportation), and the overall Social Vulnerability Index (SVI). We used the merged data set to create vulnerability profiles by COPD prevalence, explore joint geographic patterns, and calculate COPD population estimates by vulnerability levels.
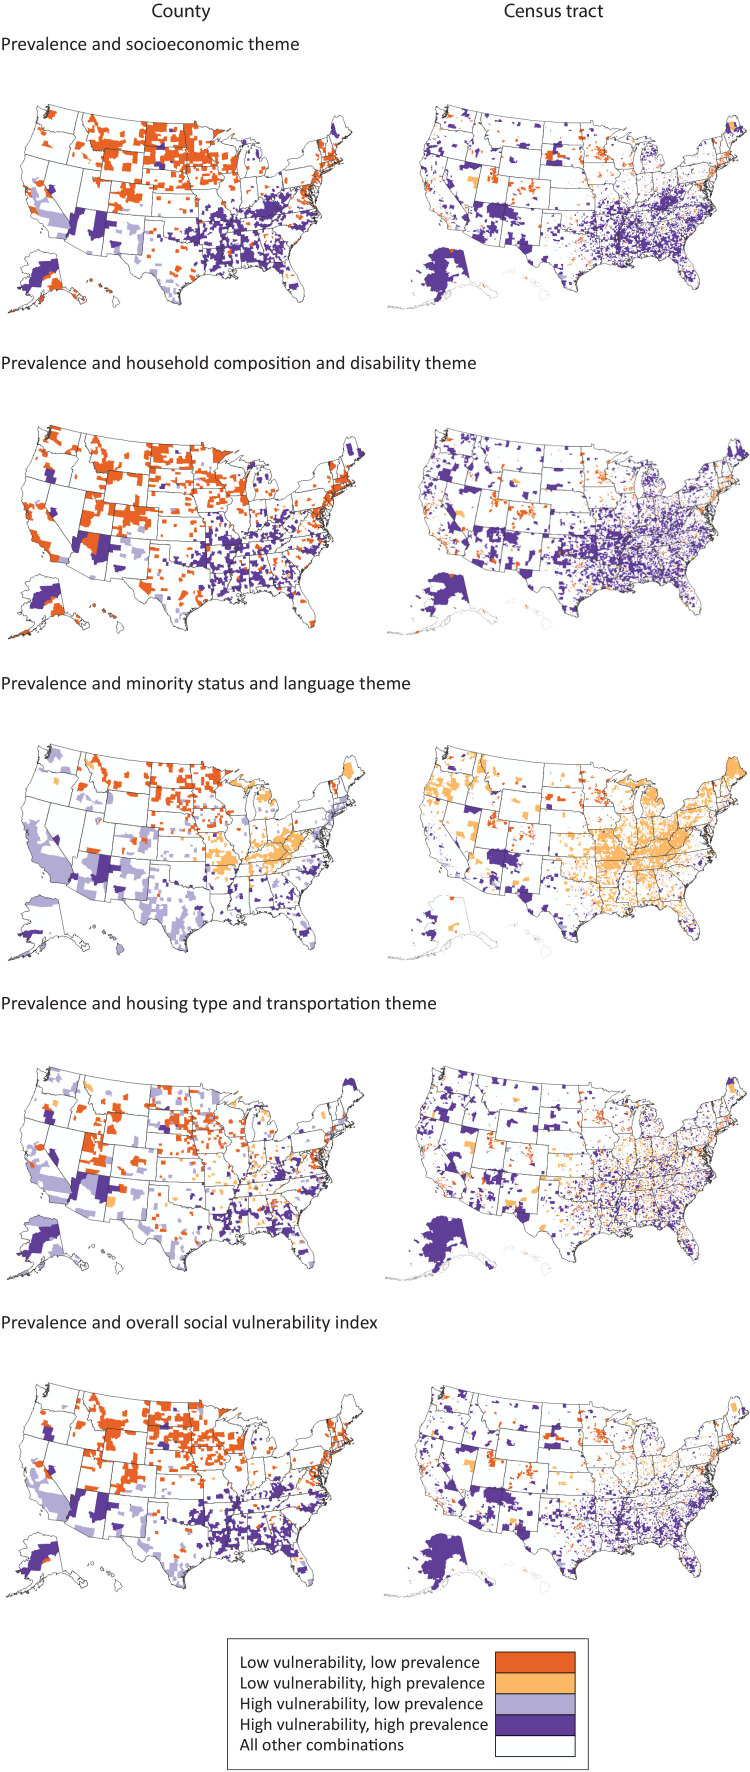
Results: Counties and census tracts with high COPD prevalence (quartile 4) had high median vulnerability rankings (range: 0-1) for 2 themes: socioeconomic (county, 0.81; tract, 0.77) and household composition and disability (county, 0.75; tract, 0.81). Concordant high COPD prevalence and vulnerability for these themes were clustered along the Ohio and lower Mississippi rivers. The estimated number of adults with COPD residing in counties with high vulnerability was 2.5 million (tract: 4.7 million) for the socioeconomic theme and 2.3 million (tract: 5.0 million) for the household composition and disability theme (high overall SVI: county, 4.5 million; tract, 4.7 million).
Conclusion: Data from 2 publicly available tools can be combined, analyzed, and visualized to jointly examine local COPD estimates and social vulnerability. These analyses can be replicated with other measures to expand the use of these cross-cutting tools for public health planning.
Figures
References
-
- US Department of Health and Human Services, Office of Disease Prevention and Health Promotion. Healthy People 2030: social determinants of health. Accessed January 5, 2023. https://health.gov/healthypeople/objectives-and-data/social-determinants...
-
- National Academies of Sciences, Engineering, and Medicine. Integrating social care into the delivery of health care: moving upstream to improve the nation’s health. Washington, DC: National Academies Press, 2019. - PubMed
-
- World Health Organization, Commission on Social Determinants of Health. Closing the gap in a generation: health equity through action on social determinants of health; 2008. - PubMed
MeSH terms
LinkOut - more resources
Full Text Sources
Medical