. 2023 Oct:301:122255.
doi: 10.1016/j.biomaterials.2023.122255. Epub 2023 Jul 26.

Maturation of iPSC-derived cardiomyocytes in a heart-on-a-chip device enables modeling of dilated cardiomyopathy caused by R222Q-SCN5A mutation

Affiliations

Maturation of iPSC-derived cardiomyocytes in a heart-on-a-chip device enables modeling of dilated cardiomyopathy caused by R222Q-SCN5A mutation

Marianne Wauchop et al. Biomaterials. 2023 Oct.

Abstract

To better understand sodium channel (SCN5A)-related cardiomyopathies, we generated ventricular cardiomyocytes from induced pluripotent stem cells obtained from a dilated cardiomyopathy patient harbouring the R222Q mutation, which is only expressed in adult SCN5A isoforms. Because the adult SCN5A isoform was poorly expressed, without functional differences between R222Q and control in both embryoid bodies and cell sheet preparations (cultured for 29-35 days), we created heart-on-a-chip biowires which promote myocardial maturation. Indeed, biowires expressed primarily adult SCN5A with R222Q preparations displaying (arrhythmogenic) short action potentials, altered Na+ channel biophysical properties and lower contractility compared to corrected controls. Comprehensive RNA sequencing revealed differential gene regulation between R222Q and control biowires in cellular pathways related to sarcoplasmic reticulum and dystroglycan complex as well as biological processes related to calcium ion regulation and action potential. Additionally, R222Q biowires had marked reductions in actin expression accompanied by profound sarcoplasmic disarray, without differences in cell composition (fibroblast, endothelial cells, and cardiomyocytes) compared to corrected biowires. In conclusion, we demonstrate that in addition to altering cardiac electrophysiology and Na+ current, the R222Q mutation also causes profound sarcomere disruptions and mechanical destabilization. Possible mechanisms for these observations are discussed.

Keywords: Arrhythmias; Cardiac tissue; Dilated cardiomyopathy; Mutation; Nav1.5; SCN5A; Sodium channel; iPSC.


Conflict of interest statement

Declaration of competing interest The authors declare the following financial interests/personal relationships which may be considered as potential competing interests: Peter H. Backx reports financial support was provided by Canadian Institutes for Health Research. Peter H. Backx reports financial support was provided by Peter Munk Cardiac Centre Innovation Committee Award. Kumaraswamy Nanthakumar reports financial support was provided by Heart and Stroke Foundation of Ontario. Brian J. Cox reports financial support was provided by Canadian Institutes for Health Research. Milica Radisic reports financial support was provided by Canadian Institutes for Health Research. Milica Radisic reports financial support was provided by National Institutes of Health. Yimu Zhao reports financial support was provided by Canadian Institutes for Health Research. Milica Radisic reports financial support and equipment, drugs, or supplies were provided by Canada Foundation for Innovation and the Ontario Research Fund. Milica Radisic is an inventor on a patent covering biowire heart-on-a-chip technology which is licensed to Valo Health. She receives royalties from Valo Health. Yimu Zhao is an inventor on a patent covering biowire heart-on-a-chip technology which is licensed to Valo Health. She receives royalties from Valo Health.

Figures

Figure 1:
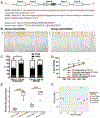
Figure 1:. Generation of iPSC-derived ventricular constructs.
A) Schematic of generation of R222Q-SCN5A iPSCs, CRISPR correction, iPSC-derived ventricular differentiations and the three systems used to study R222Q-SCN5A. B) Representative flow cytometry plots of mesoderm (PDGFRα and CD56) and ventricular mesoderm (CD235a) marker expression in cells dissociated from T3 EBs. C) Quantification of T3 mesoderm marker expression. D) Representative flow cytometry plots of CM (TnT) and ventricular CM (MLC2v) marker expression in cells dissociated from T20 EBs. E) Quantification of T20 CM marker expression. Plots show mean±SEM, *p<0.05 using unpaired student’s t-test.
Figure 2:
Figure 2:. Action potentials (APs) and sodium current INa in corrected and R222Q iPSC-derived ventricular CMs, from EBs and cell sheets.
A) Typical AP measurements in single CMs isolated from EBs cultured for 28 days using the current-clamp patch-clamp technique. The cardiomyocytes were held at −85mV for 1 second and then allowed to spontaneously depolarize (i.e. anode breaks). B) APs recorded using sharp microelectrodes (filled with 3M KCl) in cell sheets paced at 1 Hz after 28-35 days in culture. C) Summary of AP parameters for APs recorded in single CMs isolated from EBs (with spontaneous beating and following an anode break) as well as in cell sheets paced at 1 Hz. Representative INa recordings from single CMs isolated from E) EBs at day 28-35. These measurements were made using the voltage-clamp patch-clamp technique with the voltage protocol shown in the insert. Peak INa versus voltage in cardiomyocytes from corrected and R222Q CM isolated from G) EBs after 28-35 days in culture. Steady-state activation and inactivation of INa in corrected and R222Q CMs isolated from H) EBs after 28-35 days in culture. MDP=Minimum diastolic potential; APD90=AP duration at 90% repolarization; V1/2=voltage of half-maximal activation or inactivation; Data show mean±SEM. (Colour required in print).
Figure 3:
Figure 3:. Cardiac Troponin T expression patterns in isolated corrected and R222Q iPSC-derived ventricular CMs.
A) Representative images of TnT staining in isolated CMs dissociated from EBs at day 20 of the differentiation and plated at a low density for 5 days before imaging. B) Percentage of the area of CMs positive for TnT from day 21-25. Plots show mean±SEM. *p<0.05 using unpaired student’s t-test. (Colour required in print) C) Percentage of the area of CMs positive for TnT at day 25. D) Sarcomere disarray in CMs derived from corrected and R222Q iPSCs at 25. E) The alignment of the sarcomere proteins (quantified by eccentricity) and F) the amount of protein staining (quantified by density analysis) of cardiac TNT. Data show mean ± SEM. *p<0.05 using unpaired student’s t-test.
Figure 4:
Figure 4:. SCN5a isoform expression in iPSC-derived ventricular EBs, cell sheets and biowires.
A) A schematic illustrating a portion of the genomic structure of the SCN5A. In development, the fetal SCN5A mRNA variant incorporates exon 6A which is replaced by exon 6 in the adult SCN5A transcript. It is the adult SCN5A transcript, not the fetal form, that expresses the R222Q mutation found in patients presenting with arrhythmias and cardiomyopathy. B) Sequencing comparison of the qPCR products using primers to identify the fetal exon 6A versus the adult exon 6 results in cardiac tissues derived from iPSCs in our studies. C) Comparisons of the relative levels of adult versus fetal in embryoid bodies (at 2 time points) generated from R222Q and corrected iPSCs. Graphs show mean±SEM, *p<0.05 using paired student’s t-test. D) Results showing the time course of changes in the relative expression of the adult SCN5A isoform in cultured embryoid bodies (EBs) and cell sheets (CSs). P values for slopes (slope ≠ 0) were estimated from linear regression to assess the levels of the adult transcript changes with time in culture. E) A graph was generated using the percentage of spliced SCN5a transcript reads relative to the first exon (mutation carrying exon) in biowires. F) Principal component analysis of RNAseq measurements in Mutant and Control biowires after 3 days and 8 weeks of cultivation.
Figure 5:
Figure 5:. Electrophysiological properties of corrected and R222Q iPSC-derived ventricular biowires.
A) Representative intracellular AP recordings from biowires paced at 1 Hz. B) Quantification of actional potential (AP) parameters indicated for biowires paced at 1 Hz. MDP=Minimum diastolic potential. C) representative activation maps of conduction across corrected and R222Q biowires. D) Conduction velocity (CV) and maximum capture rate (MCR) across corrected and R222Q biowires. APD90=AP duration at 90% repolarization; Plots show mean±SEM, *p<0.05 using unpaired student’s t-test. Representative INa recordings from single CMs isolated from E) Biowires after 4 weeks in culture. These measurements were made using the voltage-clamp patch-clamp technique with the voltage protocol shown in the insert. Peak INa versus voltage in cardiomyocytes from corrected and R222Q CM isolated from F) Biowires after 4 weeks in culture. Steady-state activation and inactivation of INa in corrected and R222Q CMs isolated from G) Biowires after 4 weeks in culture. V1/2=voltage of half-maximal activation or inactivation; Data show mean±SEM. (Colour required in print).
Figure 6:
Figure 6:. Active force generation in corrected and R222Q biowires.
A) Representative force tracings in corrected and R222Q biowires paced from 1-3 Hz after 8 weeks of cultivation. B) and C) Absolute force and force relative to cross-sectional area paced from 1-3 Hz demonstrating contractile dysfunction in R222Q biowires. Plots show mean±SEM, p<0.0001 using a one-way ANOVA with Sidak’s multiple comparison test.
Figure 7:
Figure 7:. Structural protein expression in corrected and R222Q iPSC-derived ventricular biowire tissues after 8 weeks of culture.
A) Representative images of TnT staining in cross-sections of biowire tissue (first column); as well as the representative images of α-sarcomeric actin, f-actin, MLC2V, and cTNT in longitudinal view of biowire tissues, scale bars= 100μm B) The alignment of the sarcomere proteins (quantified by eccentricity) and amount of protein staining (quantified by density analysis) of each structural protein staining from left to right: α-sarcomeric actin, f-actin, myosin light chain 2V (MLC2V), and cTNT. Data show mean ± SEM. *p<0.05 using unpaired student’s t-test. C) Total TnT staining in the tissue per field of view (left) and TnT staining per cross-sectional area (right). D) Cross-sectional area (left) and percent compaction (right) in biowire tissue. E) Relationships between absolute force generation and TnT expression with slopes of linear regression lines in brackets (left) and mean absolute force and mean TnT expression (right). P values in E) compare the slopes of linear regression lines to zero (in brackets) and between cell lines (next to the plot). (Colour required in print).
Figure 8:
Figure 8:. Gene expression in Mutant and Control biowire cardiac tissues.
A) A heat map representation of the expression of genes that interact directly with Nav1.5 channels (primary interactome, genes listed in red) or interact indirectly with Nav1.5 channels (secondary interactome genes, black labels). Gene Ontology (GO) term enrichment were performed for biowires from Mutant and Control groups after 8 weeks of maturation, to identify sets of genes that were significantly upregulated in Mutant group compared to Control, including B) dystrophin-associated glycoproteins genes and dense body (desosome) genes, and C-E) gene sets associated with cytosolic calcium ion regulation and action potentials. In contrast, sarcomere structural protein expressions F) did not stand out in the GO term enrichment analysis.

References

    1. Bollen IAE et al. Genotype-specific pathogenic effects in human dilated cardiomyopathy. J Physiol 595, 4677–4693 (2017). 10.1113/JP274145 - DOI - PMC - PubMed
    1. Delicce AV & Makaryus AN in StatPearls (2020).
    1. Wilde AAM & Amin AS Clinical Spectrum of SCN5A Mutations: Long QT Syndrome, Brugada Syndrome, and Cardiomyopathy. JACC Clin Electrophysiol 4, 569–579 (2018). 10.1016/j.jacep.2018.03.006 - DOI - PubMed
    1. McNair WP et al. SCN5A mutation associated with dilated cardiomyopathy, conduction disorder, and arrhythmia. Circulation 110, 2163–2167 (2004). 10.1161/01.CIR.0000144458.58660.BB - DOI - PubMed
    1. Moreau A, Gosselin-Badaroudine P, Delemotte L, Klein ML & Chahine M Gating pore currents are defects in common with two Nav1.5 mutations in patients with mixed arrhythmias and dilated cardiomyopathy. The Journal of general physiology 145, 93–106 (2015). 10.1085/jgp.201411304 - DOI - PMC - PubMed

Publication types

Substances

LinkOut - more resources