. 2023 Sep 11;41(9):1637-1649.e11.
doi: 10.1016/j.ccell.2023.07.010. Epub 2023 Aug 30.

Machine learning identifies experimental brain metastasis subtypes based on their influence on neural circuits

Collaborators, Affiliations

Machine learning identifies experimental brain metastasis subtypes based on their influence on neural circuits

Alberto Sanchez-Aguilera et al. Cancer Cell. .

Abstract

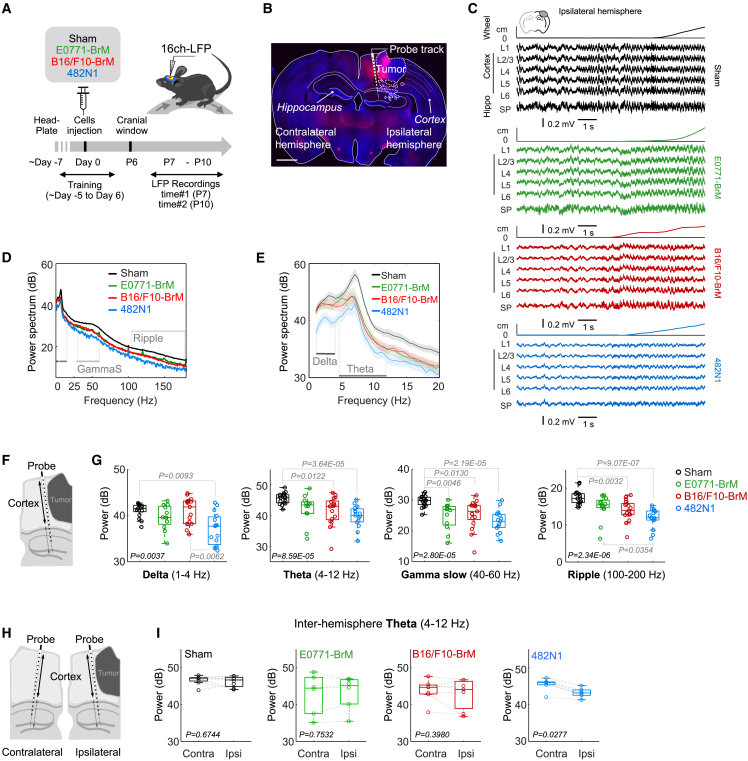
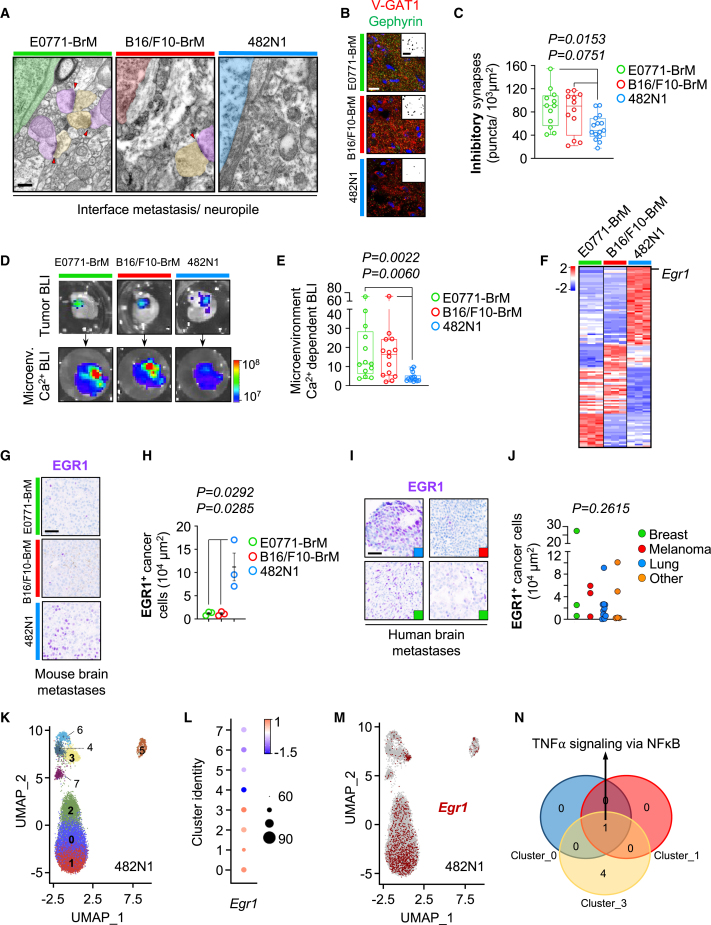
A high percentage of patients with brain metastases frequently develop neurocognitive symptoms; however, understanding how brain metastasis co-opts the function of neuronal circuits beyond a tumor mass effect remains unknown. We report a comprehensive multidimensional modeling of brain functional analyses in the context of brain metastasis. By testing different preclinical models of brain metastasis from various primary sources and oncogenic profiles, we dissociated the heterogeneous impact on local field potential oscillatory activity from cortical and hippocampal areas that we detected from the homogeneous inter-model tumor size or glial response. In contrast, we report a potential underlying molecular program responsible for impairing neuronal crosstalk by scoring the transcriptomic and mutational profiles in a model-specific manner. Additionally, measurement of various brain activity readouts matched with machine learning strategies confirmed model-specific alterations that could help predict the presence and subtype of metastasis.

Keywords: biomarkers; brain circuit impact; brain metastasis; cancer neuroscience; decision trees; electrophysiology; elta oscillations; gamma oscillations.


Conflict of interest statement

Declaration of interests The authors declare no conflicts of interest.

Figures

None
Graphical abstract
Figure 1
Figure 1
Effect of brain metastasis in electrophysiological brain activity (A) Schema of experimental design. Mice were implanted with head-bars and habituated to stay head-fixed in a wheel. After 7 days, brain metastatic cells from lung cancer (482N1), breast cancer (E0771-BrM), or melanoma (B16/F10-BrM) were inoculated intracranially in the right hemisphere. 7 days later, local field potential (LFP) recordings were obtained during 4 days using a 16-channel linear probe in each hemisphere. On day 10, animals were transcardially perfused with 4% PFA and the brains extracted and processed for histological analysis. (B) Representative coronal section of a mouse with a 482N1 metastasis. Scale bar: 1500 μm. The silicon probe was stained with Red-DiI to identify the probe track. (C) LFP signals recorded across cortical and hippocampal layers surrounding the tumor in a representative example from each group. LFP from the ipsilateral side is shown. The position in the wheel is shown at the top of each panel. (D) Mean power spectrum from ipsilateral cortical layers of the examples shown in C. (E) Enlarged 1 to 20 Hz band representing mean values of all data. (F) Schema of experimental design indicating analysis of LFP corresponding to cortical areas. (G) Differences of cortical LFP power in the delta (1–4 Hz; Chi.2 = 13.4, p = 0.0037), theta (4–12 Hz; Chi.2 = 21.4, p < 0.0001), gamma slow (40–60 Hz, Chi.2 = 23.8; p < 0.0001), and ripple (100–200 Hz; Chi.2 = 28.9, p < 0.0001) bands among mice without or with metastases from three different models, as evaluated during continuous running periods. Values are shown in box-and-whisker plots where every dot represents a different penetration and the line in the box corresponds to the median. The boxes go from the upper to the lower quartiles and the whiskers go 1.5 times the range between percentile 25 and 75 (down from percentile 25, up from percentile 75) (penetration sessions: 17 sham, 12 E0771-BrM, 17 B16/F10-BrM and 15 482N1). p value was calculated using Kruskal-Wallis with a post-hoc Tukey test. Only significant p values are shown. (H) Schema of experimental design indicating analysis of LFP corresponding to cortical areas at the ipsi- and contralateral sides respect to the location of the metastasis. (I) Analysis of the interhemispheric as measured by the theta power spectrum. Values are shown in box-and-whisker plots where every dot represents a different penetration and the line in the box corresponds to the median. The boxes go from the upper to the lower quartiles and the whiskers go from the minimum to the maximum. Data from 27 bilateral penetrations (sessions: 8 sham, 6 E0771-BrM, 7 B16/F10-BrM, 6 482N1). See also Figure S1.
Figure 2
Figure 2
Dissociation between altered local field potential and mass effect or inflammation (A) Representative brain sections affected by metastases from different models (Breast, cell line E0771-BrM; melanoma, B16/F10-BrM; lung, 482N1). Scale bar: 1mm. (B) Quantification of tumor area. Values are shown in box-and-whisker plots where every dot represents a different brain and the line in the box corresponds to the median. The boxes go from the upper to the lower quartiles and the whiskers go from the minimum to the maximum value (B16/F10-BrM n = 7; E0771-BrM n = 7; 482N1 n = 8 mice per experimental condition). One-way ANOVA (F(2,19) = 1.884, p = 0.1793). (C) Representative images of immunofluorescence staining labeling GFAP+ cells, Olig2+ cells, Iba1+ cells, and NeuN+ cells in the peritumoral areas (dotted line) of brains from mice inoculated with B16/F10-BrM, E0771-BrM, 482N1, or saline (sham). Blue channel is DAPI. Scale bar, 50μm. (D) Quantification of the relative GFAP+ area, number of Olig2+ cells, relative Iba1+ area, and number of NeuN+ cells. Values are shown in box-and-whisker plots where every dot represents a different brain and the line in the box corresponds to the median. The boxes go from the upper to the lower quartiles and whiskers go from the minimum to the maximum value (Sham n = 4; B16/F10-BrM n = 5; E0771-BrM n = 4; 482N1 n = 5 mice per experimental condition). One-way ANOVA (relative GFAP+ area: F(3,14) = 1.015, p = 0.4155/number of Olig2+ cells: F(3,14) = 0.9241, p = 0.4547/relative Iba1+ area: F(3,14) = 1.556, p = 0.2442/number of NeuN+ cells: F(3,14) = 0.5621, p = 0.6488). (E) Bar plot of the relative proportion of astrocytes (left), metastasis-associated macrophages Apoe+ (center), and metastasis-associated macrophages expressing S100a8 (right) against the rest of the cell types identified by CIBERSORTx from different mouse models (B16/F10-BrM n = 6; E0771-BrM n = 6 and 482N1 n = 6 mice). One-way ANOVA (astrocytes: F(2,15) = 0.03133, p = 0.9692). One-way ANOVA (metastasis-associated macrophages Apoe+: F(2,15) = 15,92, p = 0.0002) with a Tukey post hoc test (E0771-BrM Vs. B16/F10-BrM p = 0.0004; B16/F10-BrM Vs. 482N1 p = 0.0007; E0771-BrM Vs. 482N1 p = 0.9499). Kruskal-Wallis test (metastasis-associated macrophages expressing S100a8: H = 10.87, p = 0.0012) with a Dunn's post hoc test (E0771-BrM Vs. B16/F10-BrM p = 0.0044; B16/F10-BrM Vs. 482N1 p = 0.0573; E0771-BrM Vs. 482N1 p > 0.9999). See also Figure S2 and Table S1.
Figure 3
Figure 3
Correlation between electrophysiological impact and the transcriptomic profile of brain metastases (A) Electron microscopy images at the interface between the metastasis and the neuropile. Some synapses could be observed (red arrowheads). Green/red/blue: tumor cell (E0771-BrM/B16/F10-BrM/482N1, respectively); yellow: pre-synaptic terminal; purple: post-synaptic terminal. Scale bar: 0.4 μm. (B) Representative images of pre-synaptic (V-GAT1) and post-synaptic (Gephyrin) markers of inhibitory synapses and their colocalization indicative of mature synapsis. Scale bar: 15 μm. (C) Quantification of mature inhibitory synapses in the peritumoral area associated with different brain metastasis models. Values are shown in box-and-whisker plots where every dot represents a different field of view and the line in the box corresponds to the median. The boxes go from the upper to the lower quartiles and the whiskers go from the minimum to the maximum (E0771-BrM n = 12 field of view from 4 brains; B16/F10-BrM n = 12 field of view from 4 brains; 482N1 n = 15 field of view from 5 brains). One-way ANOVA (F(2,36) = 4.889, p = 0.0132) with a Tukey post hoc test (E0771-BrM Vs. B16/F10-BrM p = 0.7943; B16/F10-BrM Vs. 482N1 p = 0.0751; E0771-BrM Vs. 482N1 p = 0.0153). (D) Representative images of organotypic cultures established from the genetically engineered mice model LSL-CamBI containing firefly luciferase-expressing brain metastases at the experimental endpoint after being stimulated with appropriate substrates. Color bars show bioluminescence intensity in p s−1 cm−2 sr−1. (E) Quantification of microenvironment-derived calcium-dependent bioluminescence normalized for metastasis-derived bioluminescence. Values are shown in box-and-whisker plots where every dot represents a different organotypic culture and the line in the box corresponds to the median. The boxes go from the upper to the lower quartiles and the whiskers go from the minimum to the maximum (E0771-BrM n = 13 slices; B16/F10-BrM n = 14; 482N1 n = 14. Slices were obtained from four animals each group, and two independent experiments). Kruskal-Wallis test (H = 14.09, p = 0.0009) with a Dunn's post hoc test (E0771-BrM Vs. B16/F10-BrM p > 0.9999; B16/F10-BrM Vs. 482N1 p = 0.006; E0771-BrM Vs. 482N1 p = 0.0022). (F) RNA-seq from the three different brain metastasis models where genes previously reported in synaptic signatures significantly upregulated in 482N1 are shown. Scale bar corresponds to Z Score. (G) Validation of increased levels of EGR1 in 482N1 compared to E0771-BrM and B16/F10-BrM. Scale bar: 50 μm. (H) Quantification of EGR1 levels in metastatic cells in situ. Every dot represents an individual mouse where 4 fields of view were analyzed. The line represents the mean and the error bars the sem. (n = 3 brains). p value was calculated using unpaired t test. (I) Representative images of human brain metastases showing EGR1 levels. Selected samples illustrate the heterogeneity among patients as well as the primary tumor source (colored squares in the lower right corner). Blue square: lung cancer brain metastasis; red square: melanoma brain metastasis; green square: breast cancer brain metastasis. Scale bar: 50 μm. (J) Quantification of EGR1 levels in metastatic cells in situ. Every dot represents an individual patient where 4 fields of view were analyzed. Samples are grouped according to the primary source of the brain metastasis. Other: additional primary tumor types. Kruskal-Wallis test (H = 1.202, p = 0.7526). (K) Uniform manifold approximation and projection (UMAP) labeling clusters identified at 0.75 resolution (clusters 0–7) for the 482N1 cancer cells. Each cluster is represented by a different color. Clusters labeled in bold correspond to the Egr1 enriched ones. (L) Dotplot showing Egr1 enriched cells, split by cluster. Average expression is indicated by a colored scale: low in blue, high in red. Dot size represents the percentage of cells with Egr1 expression by cluster. (M) Projection of Egr1 gene expression of 481N1 cancer cells. Pre-defined Egr1-positive cells are highlighted in red. (N) Venn diagram of gene hallmarks significantly upregulated in Egr1-positive cells within clusters 0, 1, and 3 identified by GSEA. See also Figure S3 and Table S2.
Figure 4
Figure 4
A generalized linear model identifies key components defining the diversity of electrophysiological profiles among brain metastases (A) Weights of the different LFP features contributing to the different principal components (PC). The scale bar indicates PC weights. (B) Variance of data from different experimental groups as projected over PCs. The scale bar indicates PC weights. (C–E) 2D projections of data over different PC pairs that illustrate distribution of categorical variables (C), oscillations (D), and metastasis models (E). (F) Results of a generalized linear model (GLM) analysis fitted to distinguish E0771-BrM in data from all sessions (n = 492). Beta values (βi) shown in magenta to blue represent the GLM coefficients. Positive numbers represent a positive correlation and negative numbers represent a negative correlation. P-values represent the significance of factors explaining the GLM output. The discontinuous line represents the threshold at p < 0.05. (G) Same as in F for B16/F10-BrM. H. Same as in F for 482N1. See also Figure S4 and Table S3.
Figure 5
Figure 5
Machine learning identifies experimental brain metastasis subtypes (A) Scheme of the training and test approach. (B) An example of one Decision Tree Classifier trained on data projected in the PC space used to predict the group classes. (C) Class predictor applied to data generated from sessions 9–10 days post implantation of brain metastatic cells. The model is able to classify the presence of different metastasis subtypes using PC analysis of LFP spectral features with a p value of 0.00001. (D) Class predictor applied to early data obtained 7 days post implantation of brain metastatic cells. The model is able to identify the presence of a tumor with a p value < 0.00001. (E) Scheme of the prediction strategy. The model (4 Decision Trees) trained with previous data was used to classify new data from the two additional brain metastasis cell lines from lung cancer 393N1 and 2691N1. Note that new data will be ascribed to one of the four categories resulting from the previous training. (F) Mean output of all decision trees when data from new lung cancer lines 393N1 (dark blue) and 2691N1 (light blue) were evaluated with the already trained predictors. Most trees (3 out of 4) correctly classified all samples from both 393N1 and 2691N1 lines as 482N1 (lung), while 1 decision tree misclassified samples as B16/F10-BrM (melanoma). Local field potential (LFP) data from 22 ipsilateral and 17 contralateral recordings from 3 mice injected with 393N1 cells; 26 ipsilateral and 24 contralateral sessions from 3 mice injected with 2691N1 cells. (G) Same as in F for the most-voted output of the 4 decision trees. Here, all 393N1 samples and all 2691N1 samples but 1 were correctly classified as 482N1 (lung). See also Figure S5 and Table S4.

Comment in

  • Tumors on different wavelengths.
    Shamardani K, Monje M. Shamardani K, et al. Cancer Cell. 2023 Sep 11;41(9):1541-1543. doi: 10.1016/j.ccell.2023.07.009. Epub 2023 Aug 30. Cancer Cell. 2023. PMID: 37652004

References

    1. Moss N.S., Beal K., Tabar V. Brain metastasis—a distinct oncologic disease best served by an integrated multidisciplinary team approach. JAMA Oncol. 2022;8:1252–1254. - PMC - PubMed
    1. Gerstenecker A., Nabors L.B., Meneses K., Fiveash J.B., Marson D.C., Cutter G., Martin R.C., Meyers C.A., Triebel K.L. Cognition in patients with newly diagnosed brain metastasis: profiles and implications. J. Neuro Oncol. 2014;120:179–185. - PMC - PubMed
    1. Anderson S.W., Damasio H., Tranel D. Neuropsychological impairments associated with lesions caused by tumor or stroke. Arch. Neurol. 1990;47:397–405. - PubMed
    1. Jena A., Taneja S., Talwar V., Sharma J.B. Magnetic resonance (MR) patterns of brain metastasis in lung cancer patients: correlation of imaging findings with symptom. J. Thorac. Oncol. 2008;3:140–144. - PubMed
    1. Zeng Q., Michael I.P., Zhang P., Saghafinia S., Knott G., Jiao W., McCabe B.D., Galván J.A., Robinson H.P.C., Zlobec I., et al. Synaptic proximity enables NMDAR signalling to promote brain metastasis. Nature. 2019;573:526–531. - PMC - PubMed

Publication types