. 2023 Sep 13;31(9):1450-1468.e8.
doi: 10.1016/j.chom.2023.08.002. Epub 2023 Aug 30.

Antimicrobial overproduction sustains intestinal inflammation by inhibiting Enterococcus colonization

Affiliations

Antimicrobial overproduction sustains intestinal inflammation by inhibiting Enterococcus colonization

Kyung Ku Jang et al. Cell Host Microbe. .

Abstract

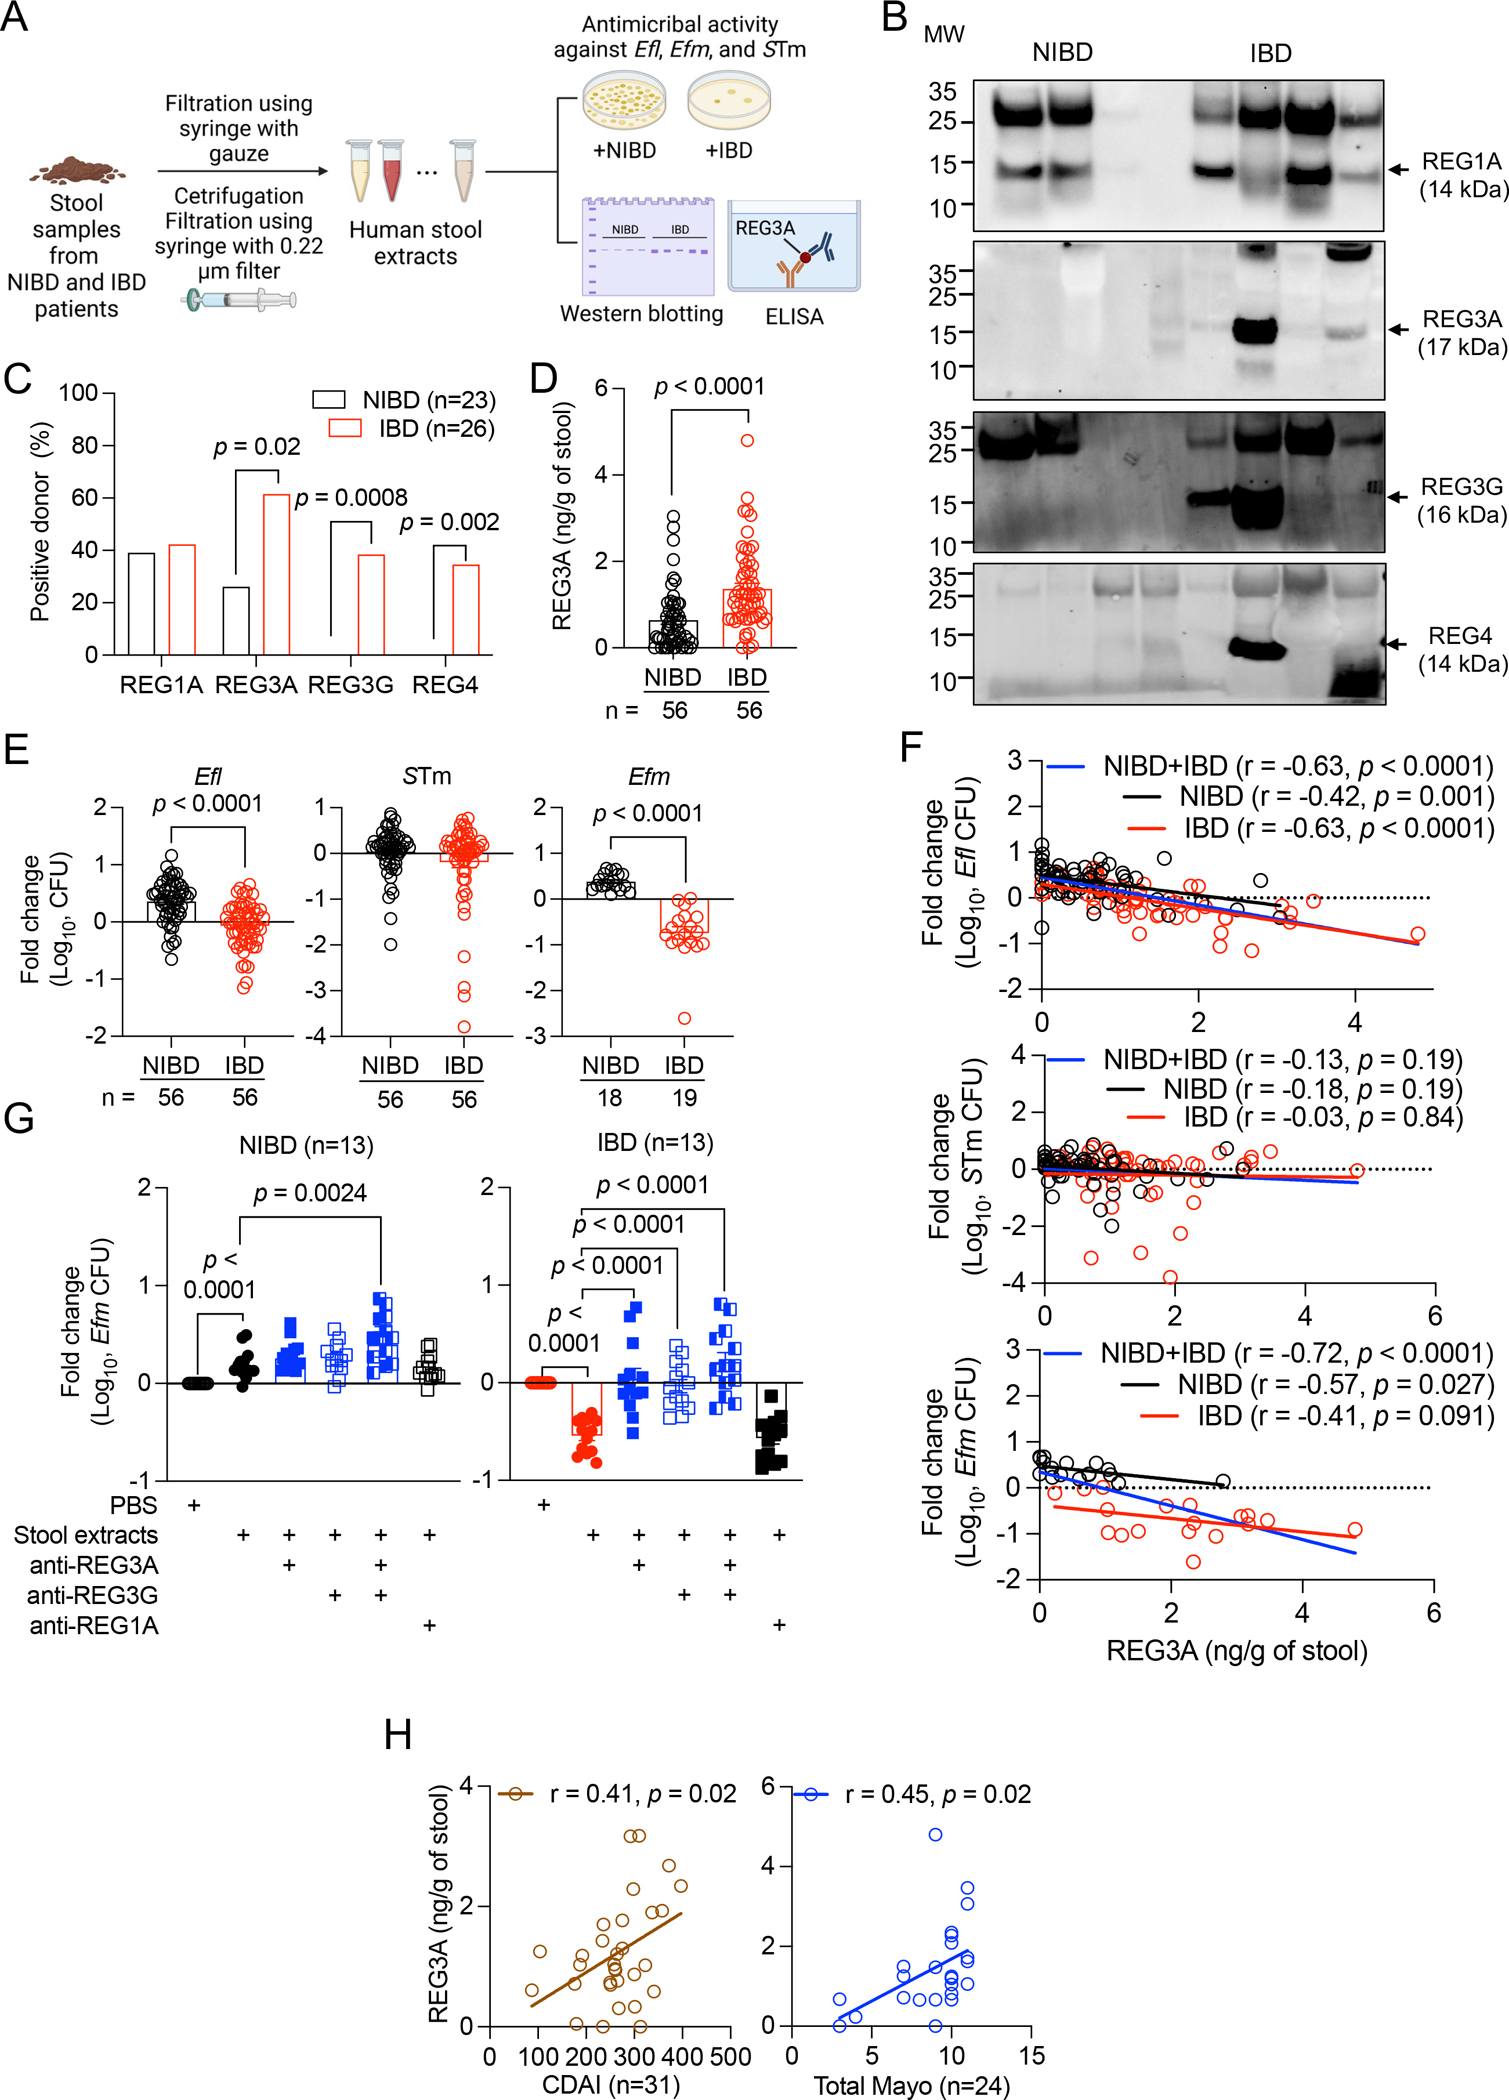
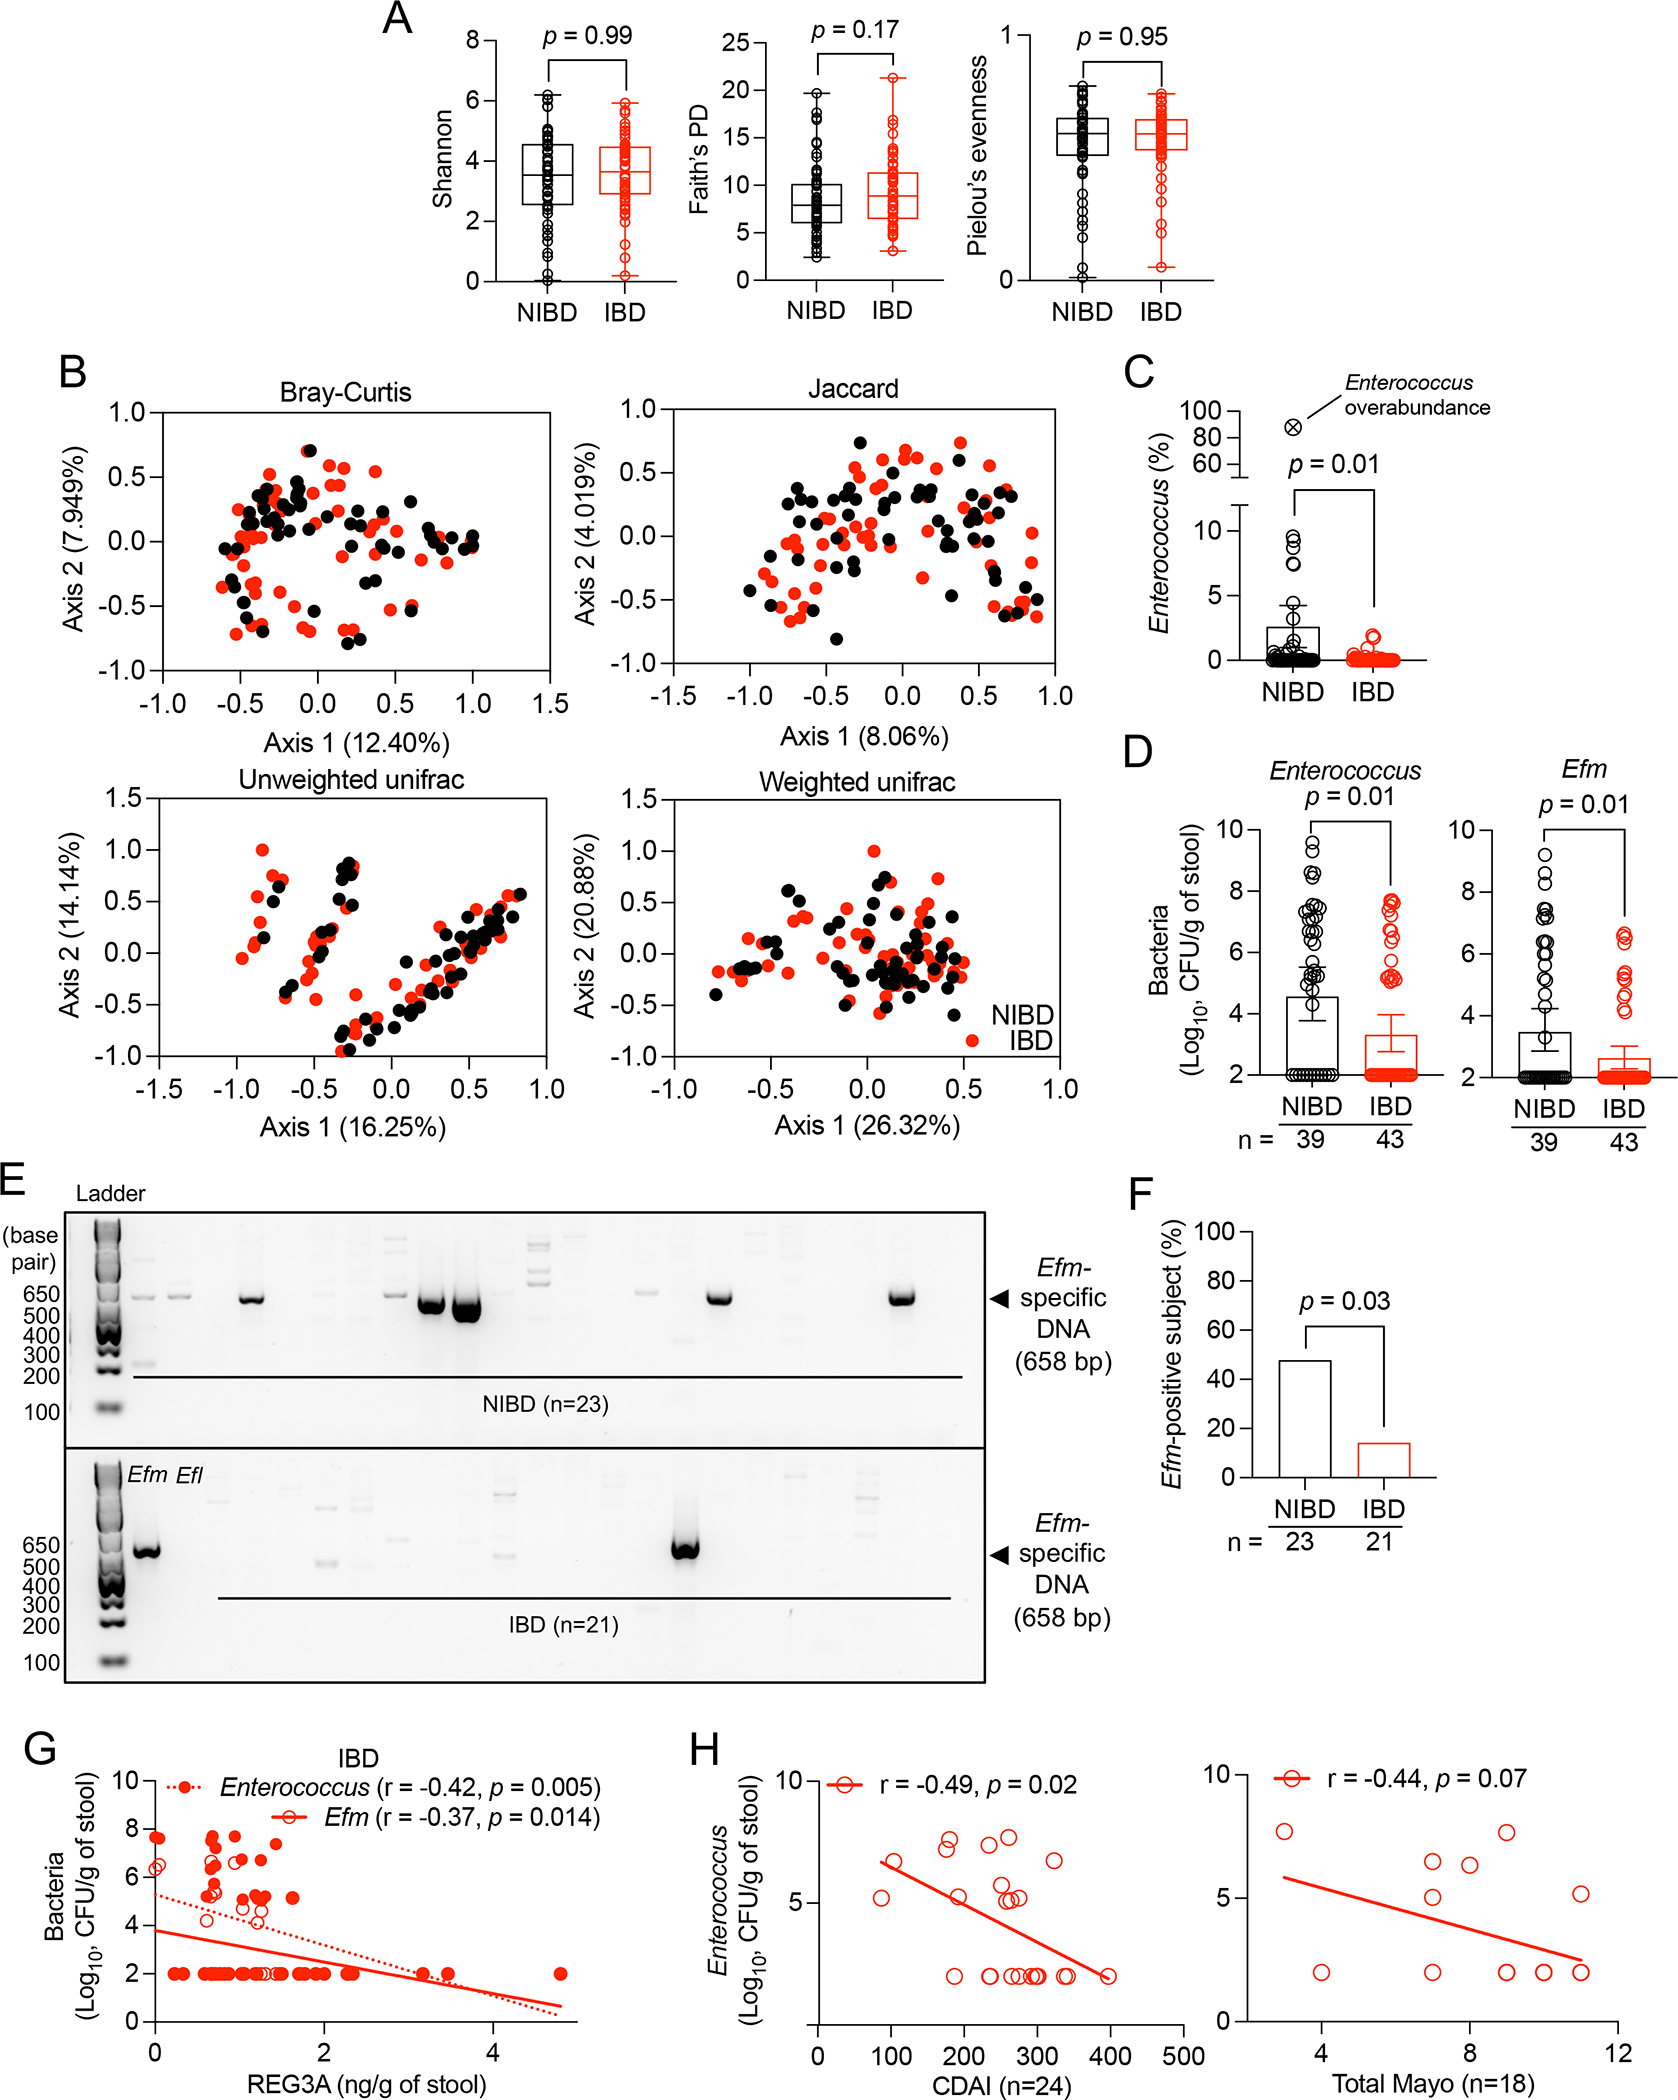
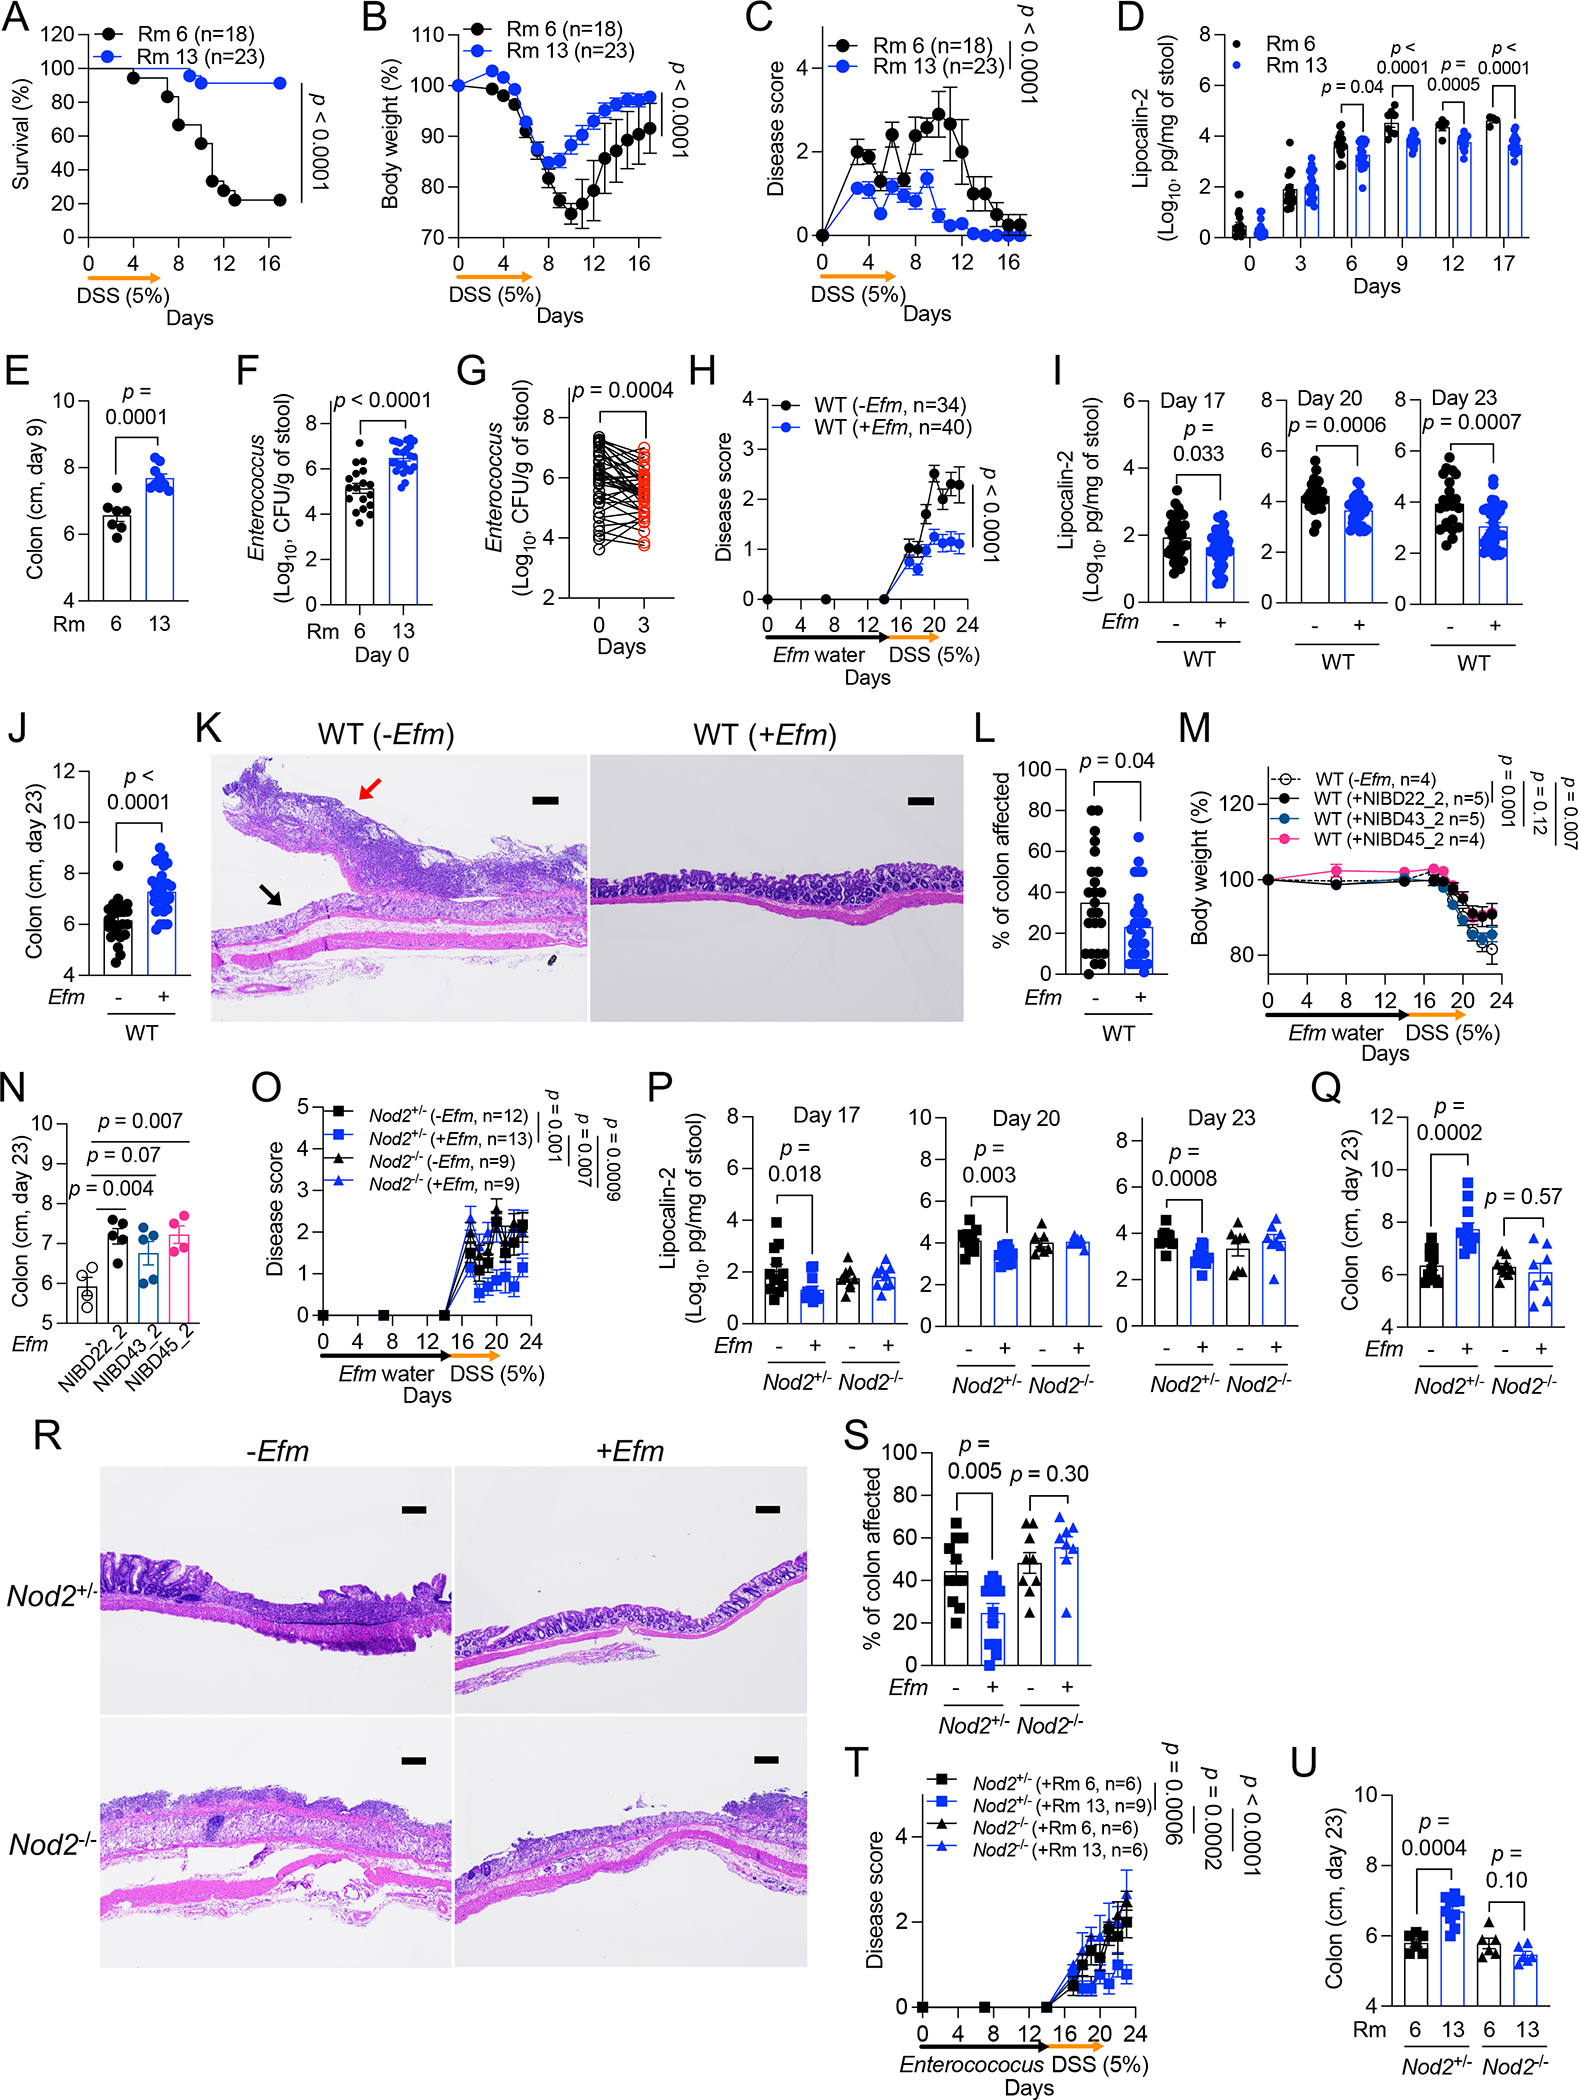
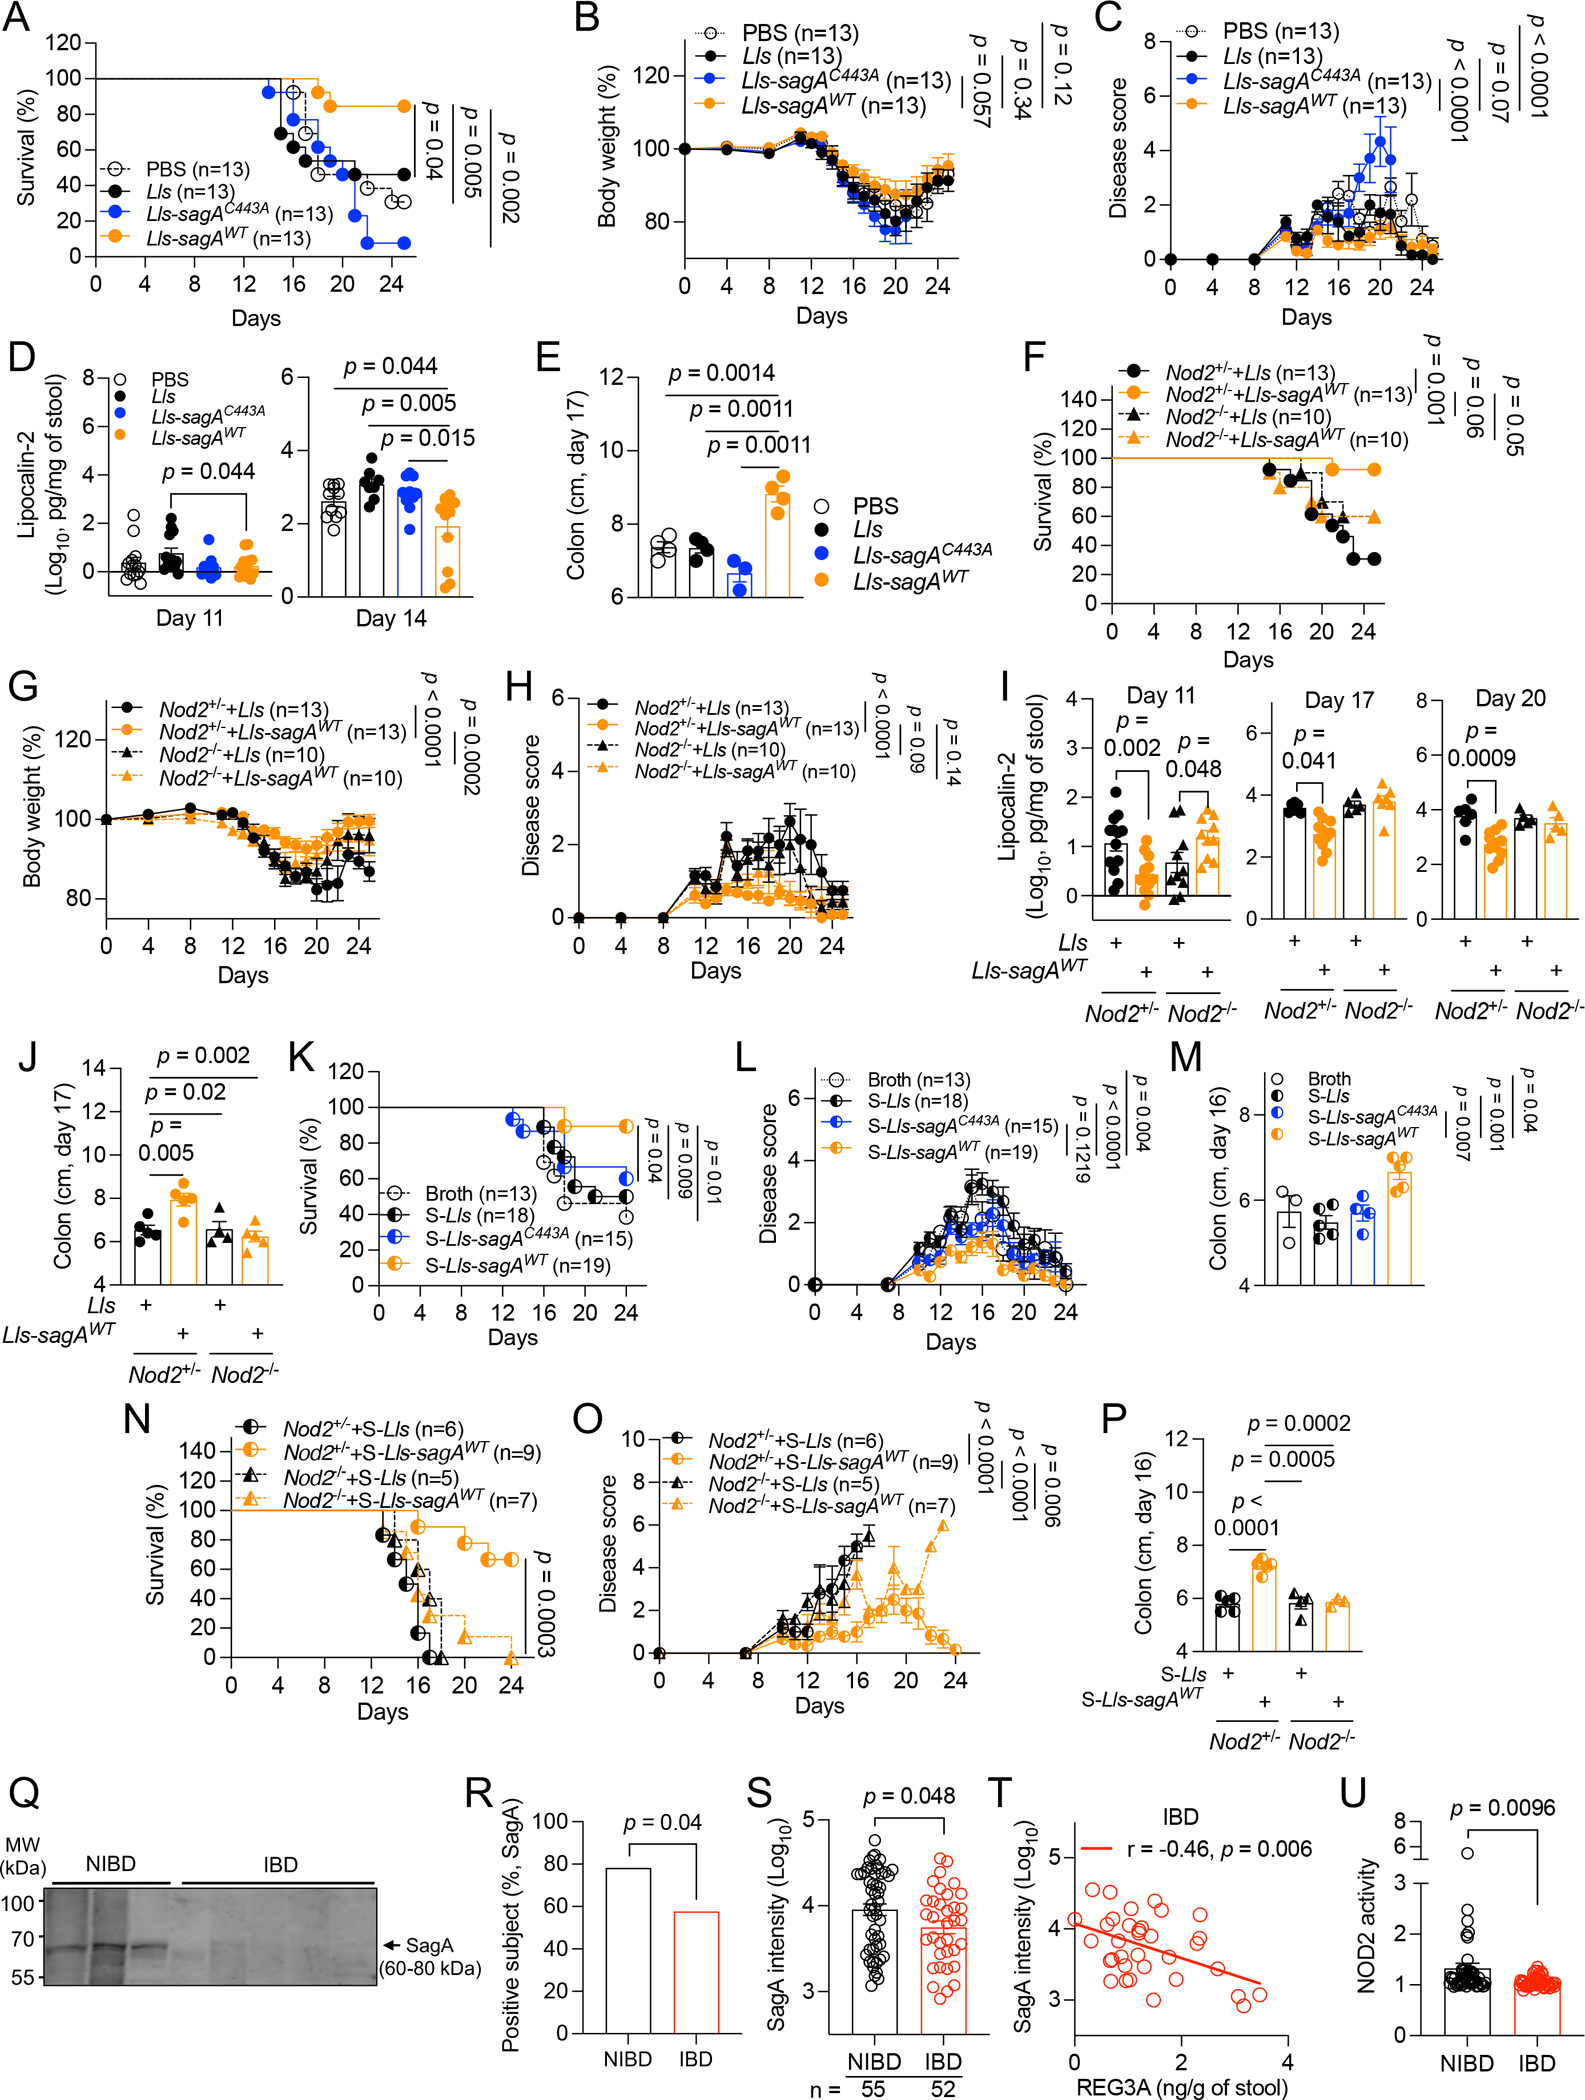
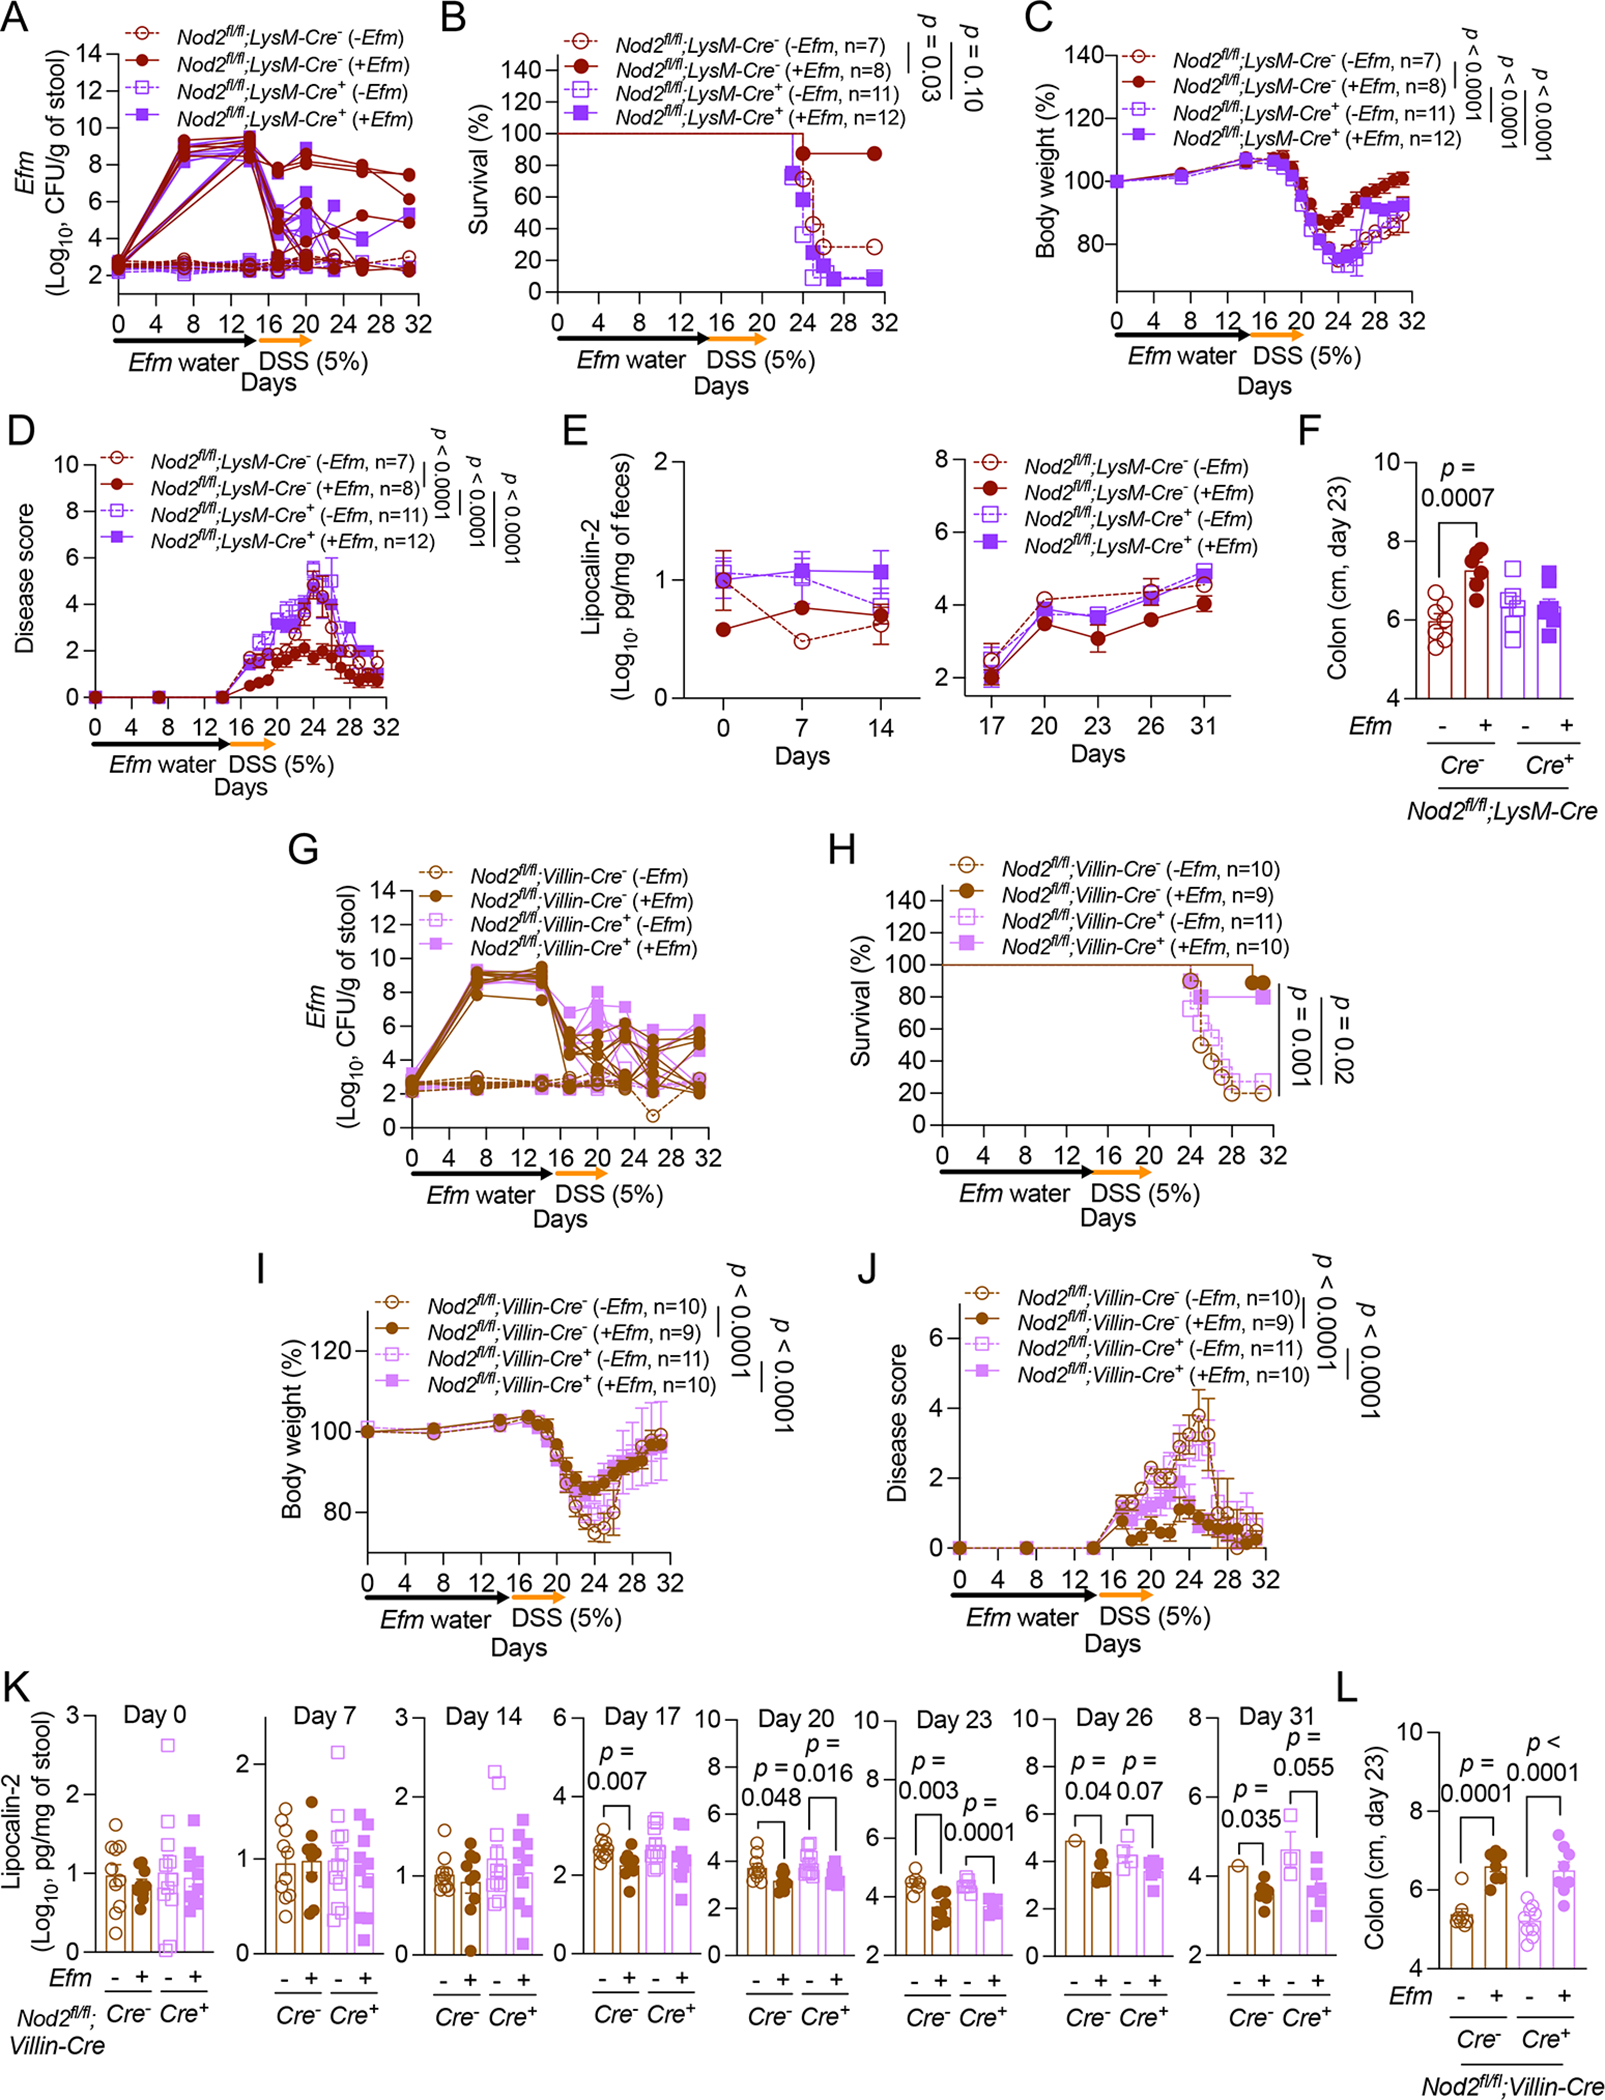
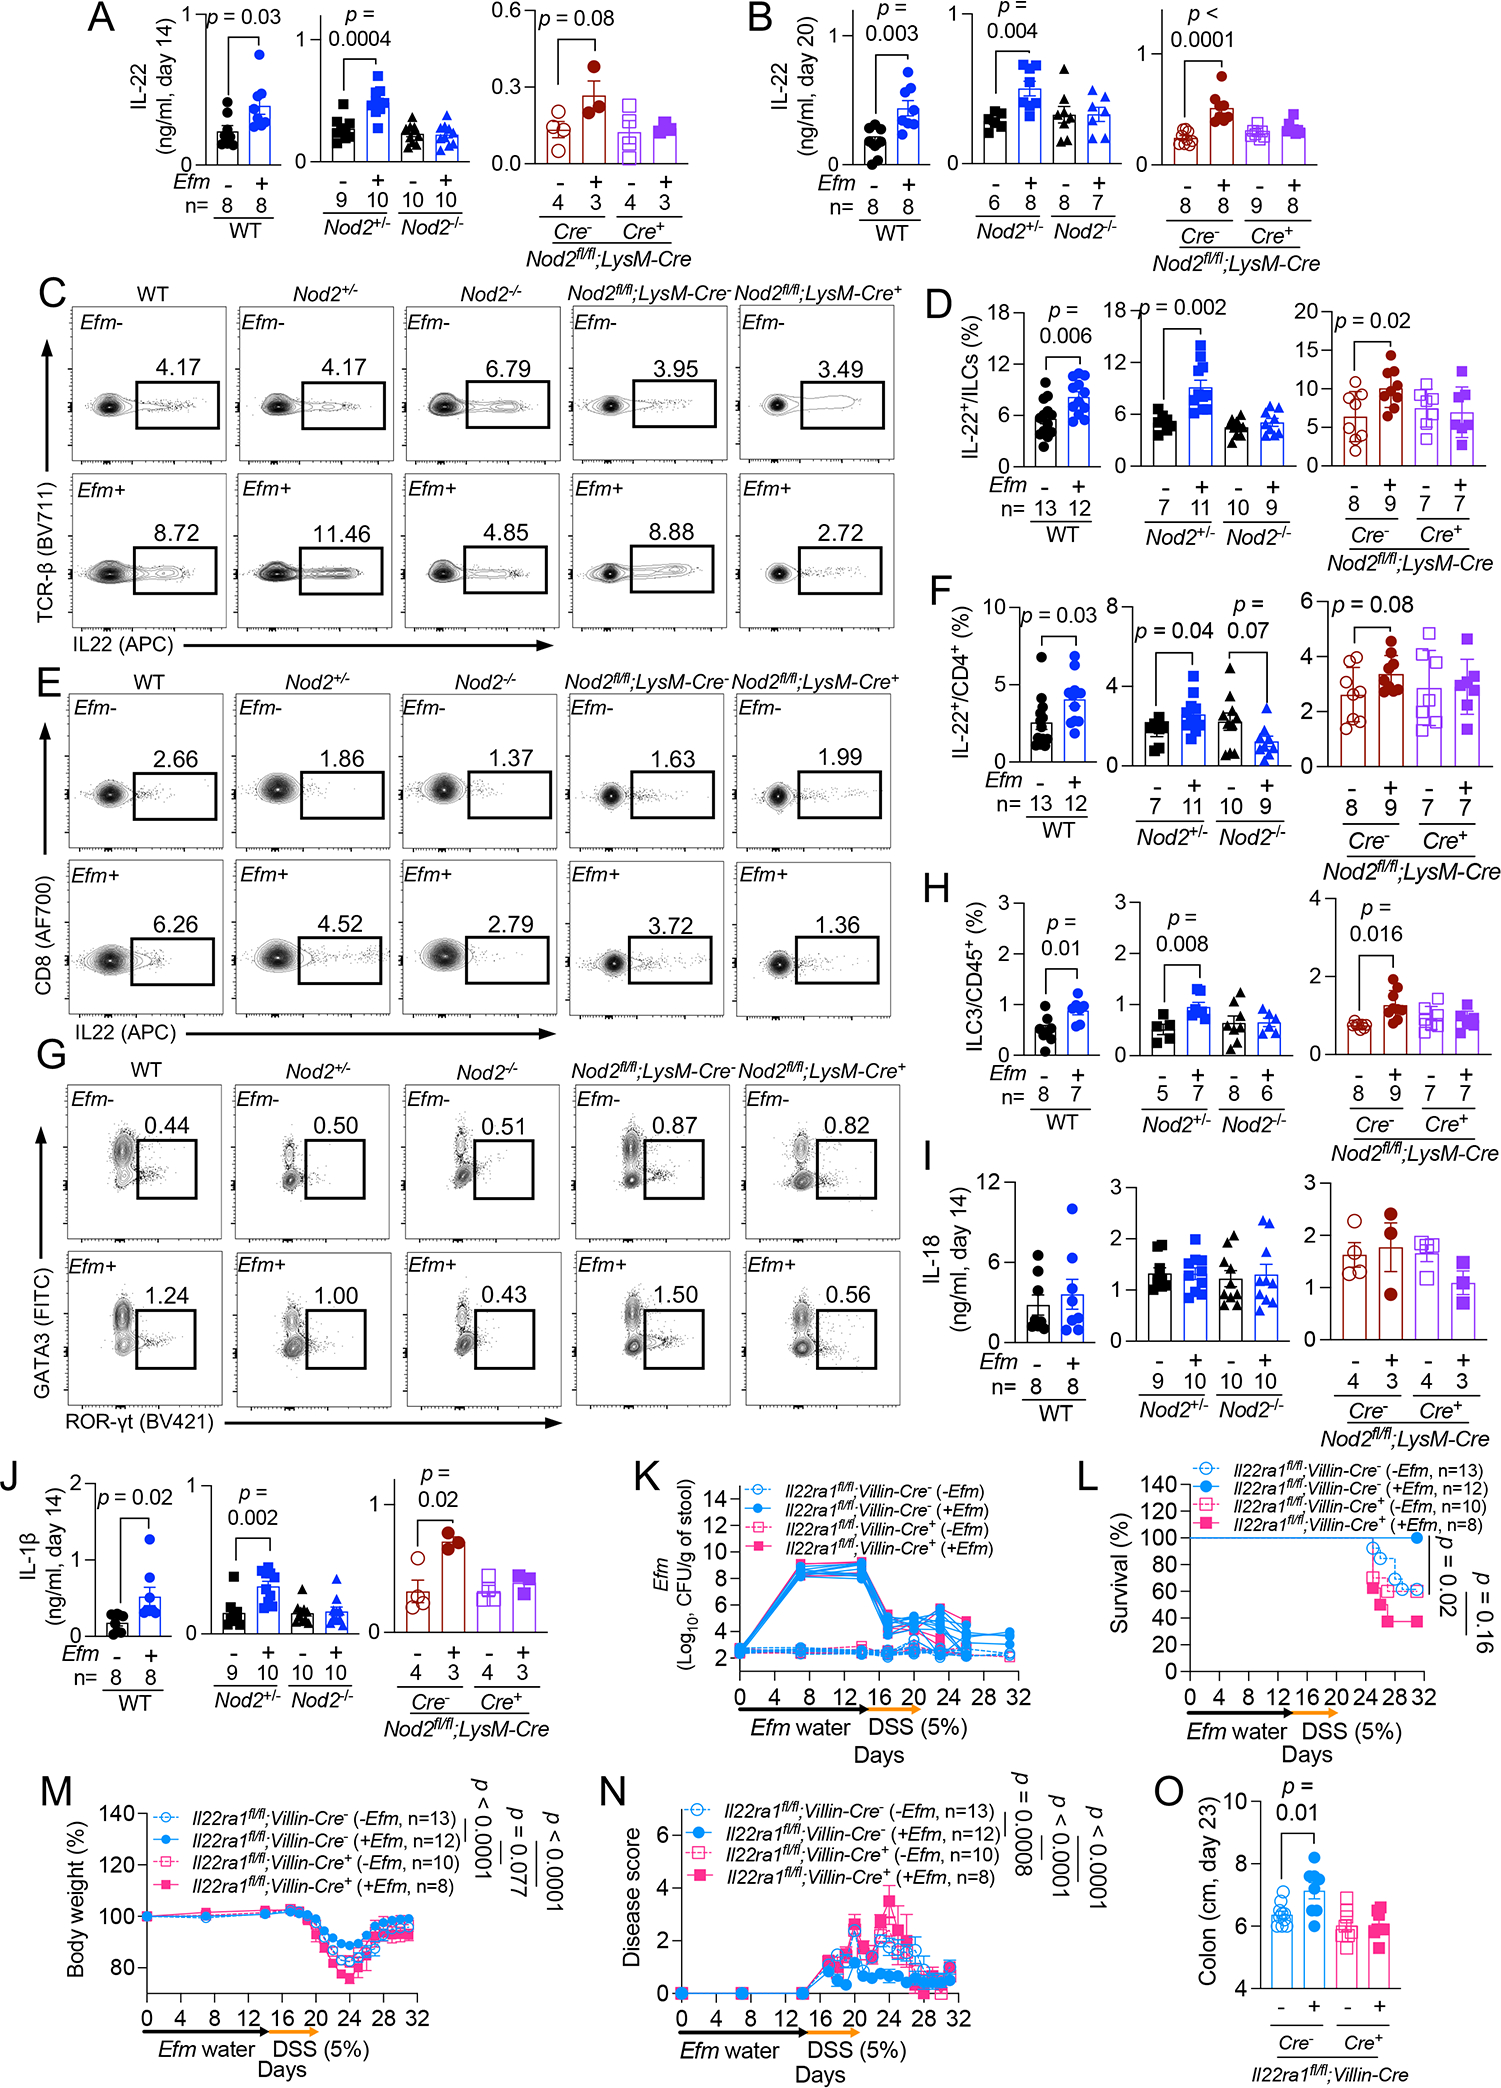
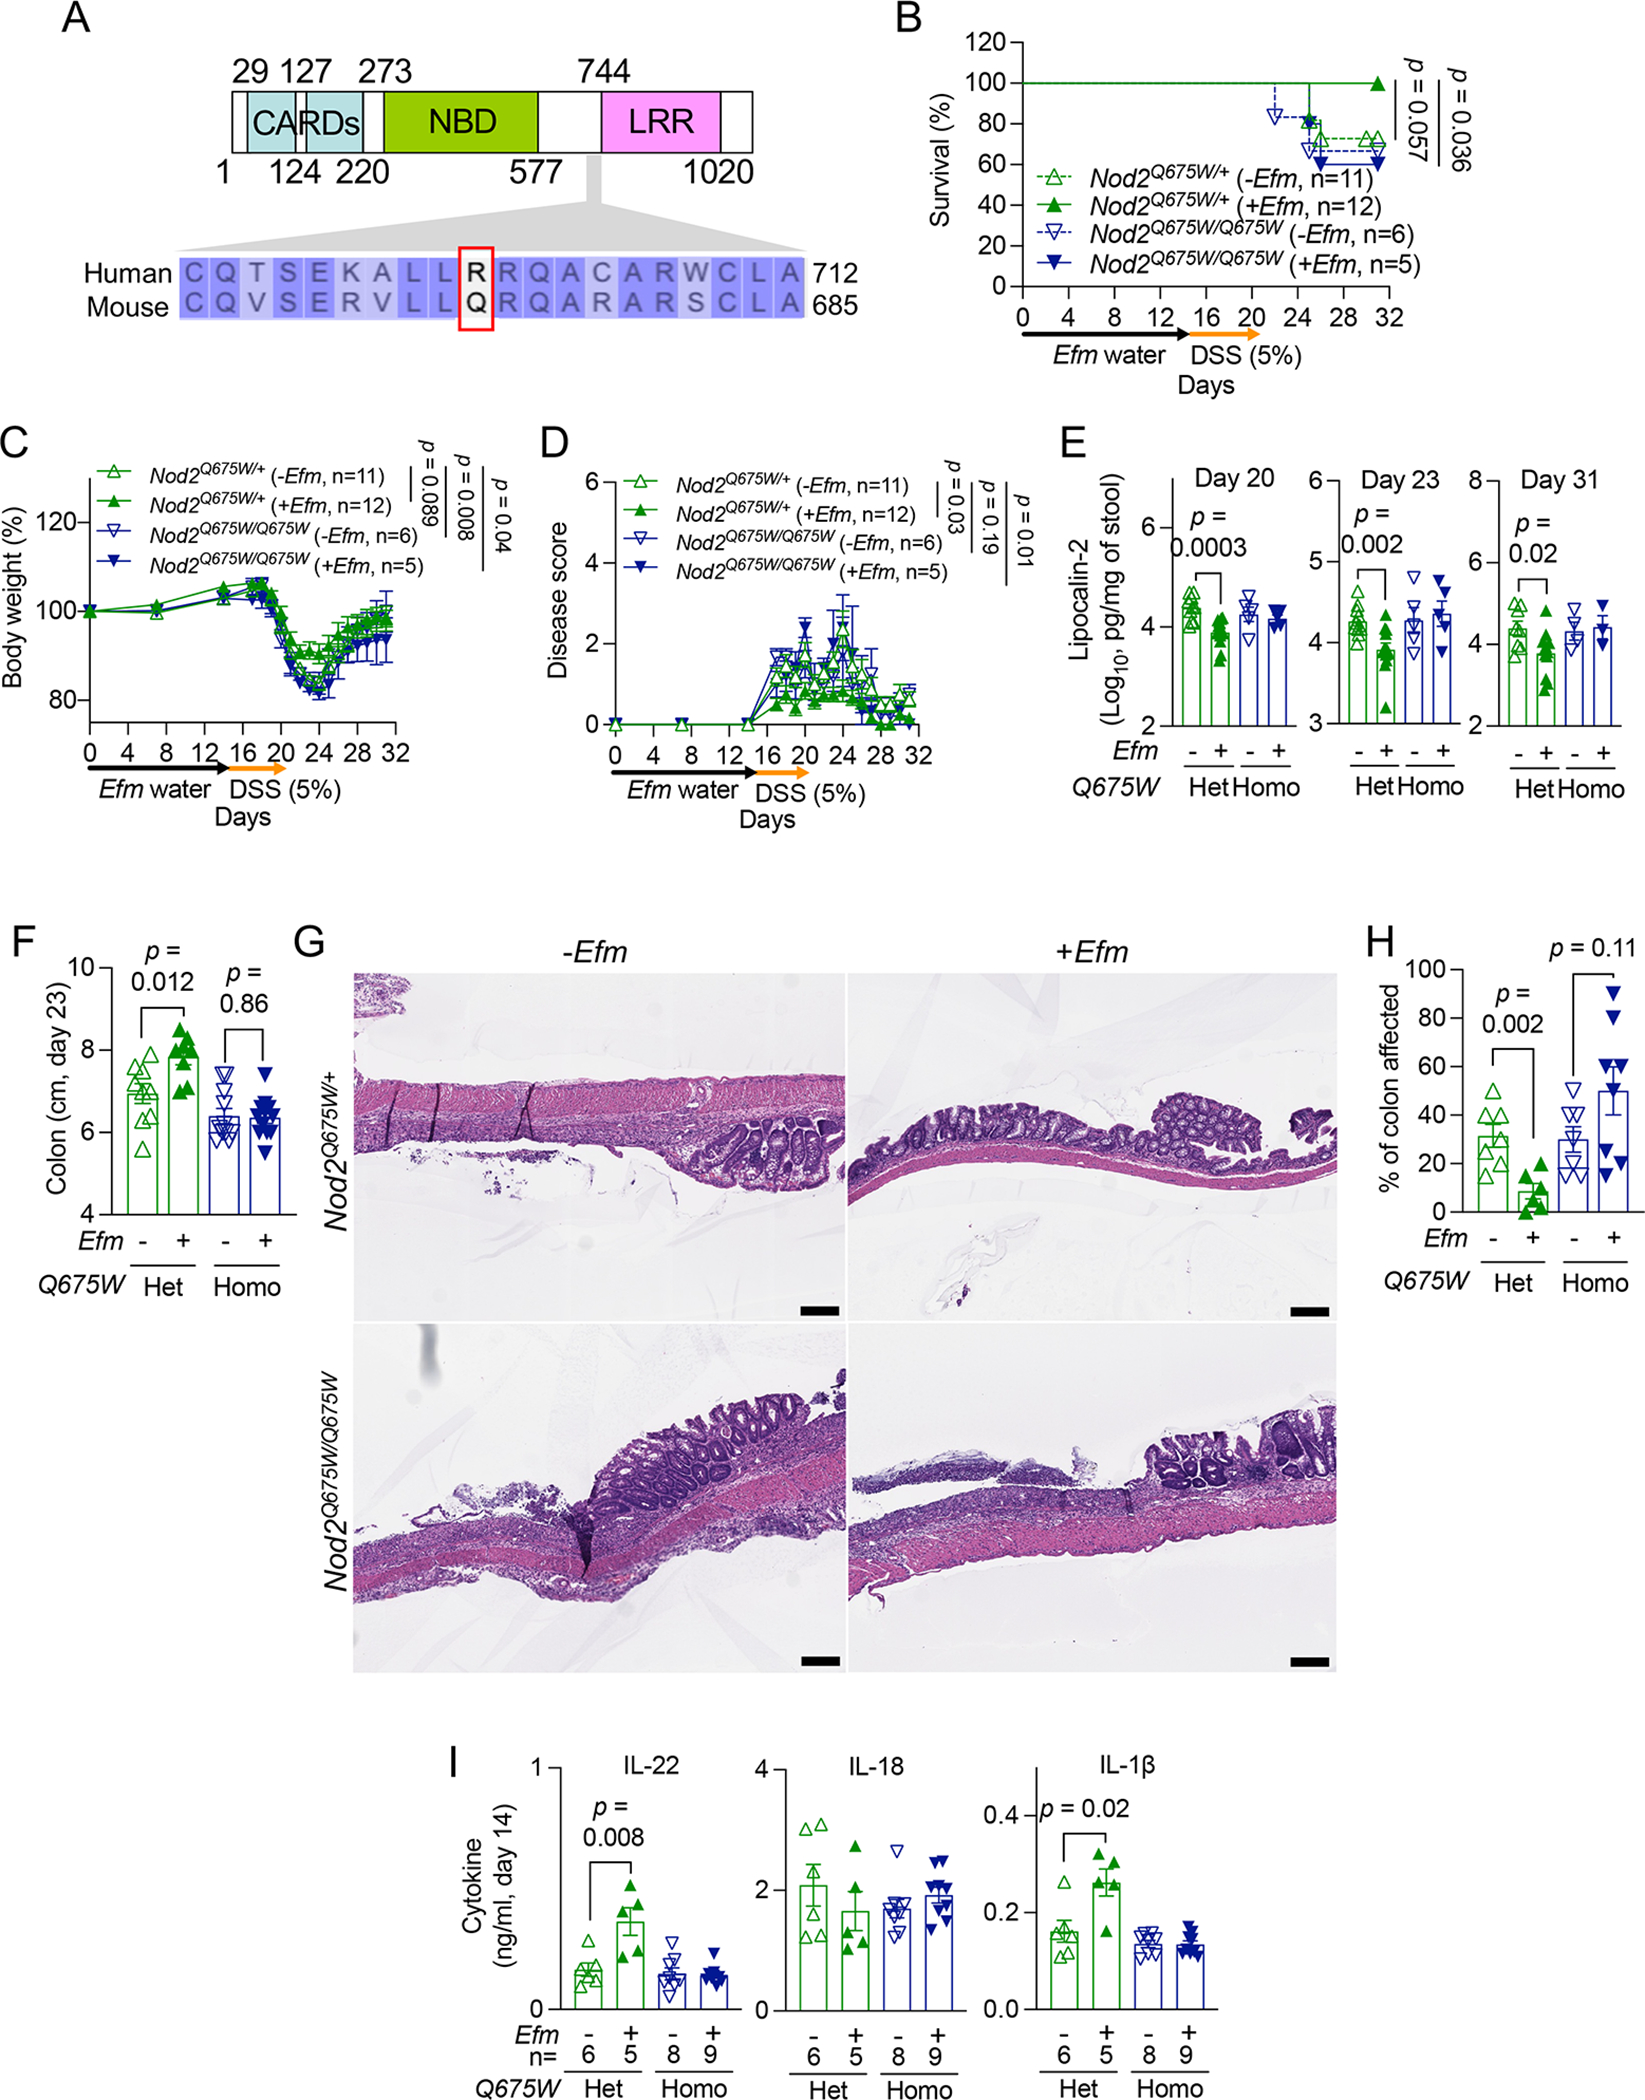
Loss of antimicrobial proteins such as REG3 family members compromises the integrity of the intestinal barrier. Here, we demonstrate that overproduction of REG3 proteins can also be detrimental by reducing a protective species in the microbiota. Patients with inflammatory bowel disease (IBD) experiencing flares displayed heightened levels of secreted REG3 proteins that mediated depletion of Enterococcus faecium (Efm) from the gut microbiota. Efm inoculation of mice ameliorated intestinal inflammation through activation of the innate immune receptor NOD2, which was associated with the bacterial DL-endopeptidase SagA that generates NOD2-stimulating muropeptides. NOD2 activation in myeloid cells induced interleukin-1β (IL-1β) secretion to increase the proportion of IL-22-producing CD4+ T helper cells and innate lymphoid cells that promote tissue repair. Finally, Efm was unable to protect mice carrying a NOD2 gene variant commonly found in IBD patients. Our findings demonstrate that inflammation self-perpetuates by causing aberrant antimicrobial activity that disrupts symbiotic relationships with gut microbes.

Keywords: NOD2; REG3; antimicrobial proteins; enterococci; inflammatory bowel disease.


Conflict of interest statement

Declaration of interests K.C. has received research support from Pfizer, Takeda, Pacific Biosciences, Genentech, and Abbvie. K.C. has consulted for or received an honoraria from Puretech Health, Genentech, and Abbvie. K.C. is an inventor on U.S. patent 10,722,600 and provisional patent 62/935,035 and 63/157,225. H.C.H. has received research support from Rise Therapeutics and LISCure Biosciences. U.S. patents PCT/US16/28836 (H.C.H.) and PCT/US2020/019038 (H.C.H. and M.E.G.) were obtained for the commercial use of SagA-engineered bacteria. Rise Therapeutics has licensed these patents to develop SagA-probiotics as therapeutics. J.A. reports consultancy fees, honoraria, or advisory board fees from Abbvie, Adiso, Bristol Myers Squibb, Janssen, Pfizer, Fresnius, and BioFire Diagnostics.

Figures

Figure 1.
Figure 1.. Increased REG3A and REG3G in IBD patient stool inhibit Enterococcus.
A) Schematic of stool extract preparation and analysis. B) Western blots of REG1A, REG3A, REG3G, and REG4 in stool extracts from representative 3 non-IBD (NIBD) and 5 IBD patients. C) Proportion of specimens from NIBD and IBD patients in which REG1A, REG3A, REG3G, or REG4 were detectable by western blot. D) Quantification of REG3A in NIBD and IBD stool extracts by ELISA. E) Fold changes in colony forming unit (CFU) of Enterococcus faecalis (Efl) and Salmonella Typhimurium (STm) cultured in NIBD and IBD stool extracts. Results obtained with Efl were confirmed with E. faecium (Efm). F) Correlation between REG3A concentration and CFU fold changes of Efl (upper), STm (middle), and Efm (lower) cultured in NIBD and IBD stool extract. G) Fold change in Efm CFU cultured in PBS or NIBD (left) and IBD (right) stool extracts in the presence of indicated antibodies. H) Correlation between REG3A concentration and Crohn’s disease activity index (CDAI) for CD patients or total Mayo score for ulcerative colitis (UC) patients. Data points in D-H represent individual patients. Bars represent mean ± SEM and at least three independent experiments were performed. r, Pearson correlation coefficient. Indicated p values by Fisher’s exact test in C, unpaired t test, two-tailed in D, E, and G, and simple linear regression analysis in F and H. See also Figure S1 and Tables S1–S3.
Figure 2.
Figure 2.. Enterococcus and Efm are depleted in gut microbiota from IBD patients.
A and B) 16S rRNA sequencing of stool from NIBD and IBD patients from Figure 1. Alpha diversity calculated by Shannon, Faith’s phylogenetic diversity (PD), and Pielou’s evenness indices (A). Principle coordinate analyses of beta diversity determined by Bray-Curtis, Jaccard, and Unweighted and Weighted unifrac methods (B). C) Proportion of sequencing reads representing Enterococcus in NIBD and IBD patient stool. One NIBD sample contained >80% Enterococcus, which is shown as a reference on the graph but excluded from statistical analysis and downstream assays. D) Total Enterococcus and Efm CFUs in NIBD and IBD specimens. E) Gel image of Efm detected by PCR in stool DNA. Genomic DNA isolated from Efm and Efl in the first two lanes of the bottom panel serves as positive and negative controls, respectively. F) Proportion of NIBD and IBD patients in which Efm was detectable by PCR. G) Correlation between REG3A concentration and total Enterococcus and Efm CFUs in IBD stool. H) Correlation between Enterococcus CFUs and CDAI and total Mayo score. Data points in A-D, G, and H represent individual patients. Bars represent mean ± SEM from at least three independent experiments. r, Pearson correlation coefficient. Indicated p values by Kruskal-Wallis test in A, unpaired t test, two-tailed in C and D, Fisher’s exact test in F, and simple linear regression analysis in G and H. See also Figure S1 and Tables S1–S3.
Figure 3.
Figure 3.. Enterococcus protects against intestinal injury through NOD2.
A-G) Dextran sulfate sodium (DSS)-induced intestinal injury of wild-type (WT) B6 mice bred in room 6 (Rm 6) or 13 (Rm 13). Mice were examined for survival (A), changes in body weight (B) disease score (C), fecal lipocalin-2 (LCN2) (D), colon length on day 9 (E), endogenous Enterococcus burden on day 0 (F), and changes in Enterococcus burden on day 3 (G). H-L) DSS treatment of WT mice from Rm 6 following administration of Efm or control. Mice were examined for changes in disease score (H), fecal LCN2 (I), and colon length on day 23 (J). Representative images of hematoxylin and eosin (H&E)-stained sections of the colon (K) and quantification of the proportion of colon affected (L). Black arrow indicates destroyed colonic epithelium replaced with a diffuse ulcer and pus; red arrow indicates acute inflammation with primary neutrophils, lymphocytes, plasma cells, and dead cell debris. Breakdown of histological measurements by individual mice is provided in Table S4 for this and other figures. M and N) Body weight change (M) and colon length on day 23 (N) after DSS treatment of WT mice from Rm 6 following administration of Efm isolates from NIBD patients. O-S) DSS treatment of Nod2+/− and Nod2−/− mice from Rm 6 following administration of Efm or control. Mice were examined for changes in disease score (O), fecal LCN2 at indicated time points (P), and colon length on day 23 (Q). Representative images of H&E-stained sections of the colon (R) and quantification of the proportion of colon affected (S). T and U) Disease score (T) and colon length on day 23 (U) after DSS treatment of Nod2+/− and Nod2−/− mice following administration of Enterococcus isolated from Rm 6 or Rm 13. Bars, 200 μm. Data points in D-G, I, J, L, N, P, Q, S, and U represent individual mice. Data points in B, C, H, M, O, and T represent mean ± SEM. Bars represent mean ± SEM from at least two independent experiments. Indicated p values by log-rank Mantel-Cox test in A, two-way ANOVA test in B, C, H, M, O, and T, unpaired t test, two-tailed in D-F, I, J, L, N, P, Q, S, and U, and paired t test, two-tailed in G. See also Figures S2 and S3 and Table S4.
Figure 4.
Figure 4.. SagA mediates NOD2-dependent protection against intestinal injury.
A-E) Antibiotics (abx)-treated WT mice orally inoculated with PBS, Lactococcus lactis (Lls), Lls-sagAWT, or Lls-sagAC443A and given DSS were examined for survival (A), changes in body weight (B), disease score (C), fecal LCN2 (D), and colon length on day 17 (E). F-J) Abx-treated Nod2+/− and Nod2−/− mice inoculated with Lls or Lls-sagAWT and given DSS were examined for survival (F), changes in body weight (G) and disease score (H), fecal LCN2 (I), and colon length on day 17 (J). K-M) DSS-treated WT mice receiving broth or culture supernatants of Lls (S-Lls), Lls-sagAWT (S-Lls-sagAWT), or Lls-sagAC443A (S-Lls-sagAC443A) in drinking water were examined for survival (K), changes in disease score (L), and colon length on day 16 (M). N-P) DSS-treated Nod2+/− and Nod2−/− mice receiving S-Lls or S-Lls-sagAWT were examined for survival (N), changes in disease score (O), and colon length on day 16 (P). Q) Western blots of SagA in stool extracts from representative 3 NIBD and 5 IBD patients. R and S) Proportion of NIBD and IBD patients in which SagA was detectable by western blot (R) and band intensity (S). T) Correlation between SagA and REG3A. U) NOD2 activity detected by HEK-Blue NOD2 reporter cells incubated with NIBD and IBD stool extracts. Values represent fold change over background control cells. Data points in D, E, I, J, M, and P represent individual mice. Data points in S-U represent individual patients. Data points in B, C, G, H, L, and O represent mean ± SEM. Bars represent mean ± SEM from at least two independent experiments. r, Pearson correlation coefficient. Indicated p values by log-rank Mantel-Cox test in A, F, K, and N, two-way ANOVA test in B, C, G, H, L, and O, unpaired t test, two-tailed in D, E, I, J, M, P, S, and U, Fisher’s exact test in R, and simple linear regression analysis in T. See also Figure S4 and Tables S1 and S2.
Figure 5.
Figure 5.. NOD2 in myeloid cells is required for Efm-mediated protection.
A-L) DSS-treated Nod2fl/fl;LysM-Cre and Cre+ mice (A-F) or Nod2fl/fl;Villin-Cre and Cre+ mice (G-L) following administration of Efm or control were examined for Efm burden in stool (A and G), survival (B and H), changes in body weight (C and I), disease score (D and J), fecal LCN2 (E and K), and colon length on day 23 (F and L). Lines in A and G and data points in F, K, and L represent Individual mice. Data points in C-E, I, and J represent mean ± SEM. Bars represent mean ± SEM from at least three independent experiments. Indicated p values by log-rank Mantel-Cox test in B and H, two-way ANOVA test in C, D, I, and J, and unpaired t test, two-tailed in F, K, and L.
Figure 6.
Figure 6.. IL-1β induced by Efm protective IL-22-producing lymphoid cells.
A and B) Quantification of IL-22 on days 14 (A) and 20 (B) in gut explants from WT, Nod2+/−, Nod2−/−, and Nod2fl/fl;LysM-Cre and Cre+ mice ± Efm inoculation. C-F) Representative flow cytometry plots and quantification of proportion of colonic IL-22+ innate lymphoid cells (ILCs) (C and D) and CD4+ T cells (E and F) in indicated mice ± Efm inoculation. G and H) Representative flow cytometry plots and quantification of group 3 ILCs (ILC3s) from mice in C-F. I and J) Quantification of IL-18 (I) and IL-1β (J) in gut explants from A. K-O) DSS treatment of Il22ra1fl/fl;Villin-Cre and Cre+ mice following administration of Efm or control examined for Efm burden in the stool (K), survival (L), changes in body weight (M), disease score (N), and colon length on day 23 (O). Data points in A, B, D, F, H-J, and O and lines in K represent individual mice. Data points in M and N represent mean ± SEM. Bars represent mean ± SEM and at least two independent experiments were performed. Indicated p values by unpaired t test, two-tailed in A, B, D, F, H, J, and O, log-rank Mantel-Cox test in L, and two-way ANOVA test in M and N. See also Figures S5 and S6.
Figure 7.
Figure 7.. NOD2 Q675W impairs Efm-mediated protection.
A) NOD2 protein region targeted by mutagenesis. Arginine at position 702 in human NOD2 and the corresponding glutamine at position 675 in mouse NOD2 are indicated in the red box. Numbers refer to human amino acid positions. B-F) DSS-treated Nod2Q675W/+ and Nod2Q675W/Q675W mice ± Efm inoculation were examined for survival (B), changes in body weight (C), disease score (D), fecal LCN2 (E), and colon length (F) on day 23. G and H) Representative images of H&E-stained sections of the colon (G) and quantification of the proportion of colon affected (H). I) Quantification of IL-22 (left), IL-18 (middle), and IL-1β (right) on day 14 in gut explants from Nod2Q675W/+ and Nod2Q675W/Q675W mice ± Efm inoculation. Bars, 200 μM. Data points in E, F, H, and I represent individual mice. Data points in C and D represent mean ± SEM. Bars represent mean ± SEM from at least two independent experiments. CARD, caspase recruitment domain; NBD, nucleotide-binding domain; LRR, leucine-rich repeat domain; Het, heterozygotes; Homo, homozygotes. Indicated p values by log-rank Mantel-Cox test in B, two-way ANOVA test in C and D, and unpaired t test, two-tailed in E, F, H, and I. See also Figures S7 and Table S4.

Update of

Similar articles

Cited by

References

    1. Muniz LR, Knosp C, and Yeretssian G (2012). Intestinal antimicrobial peptides during homeostasis, infection, and disease. Front Immunol 3, 310. 10.3389/fimmu.2012.00310. - DOI - PMC - PubMed
    1. Bevins CL, and Salzman NH (2011). Paneth cells, antimicrobial peptides and maintenance of intestinal homeostasis. Nat Rev Microbiol 9, 356–368. 10.1038/nrmicro2546. - DOI - PubMed
    1. Ramanan D, and Cadwell K (2016). Intrinsic Defense Mechanisms of the Intestinal Epithelium. Cell Host Microbe 19, 434–441. 10.1016/j.chom.2016.03.003. - DOI - PMC - PubMed
    1. Okumura R, Kurakawa T, Nakano T, Kayama H, Kinoshita M, Motooka D, Gotoh K, Kimura T, Kamiyama N, Kusu T, et al. (2016). Lypd8 promotes the segregation of flagellated microbiota and colonic epithelia. Nature 532, 117–121. 10.1038/nature17406. - DOI - PubMed
    1. Lehotzky RE, Partch CL, Mukherjee S, Cash HL, Goldman WE, Gardner KH, and Hooper LV (2010). Molecular basis for peptidoglycan recognition by a bactericidal lectin. Proc Natl Acad Sci U S A 107, 7722–7727. 10.1073/pnas.0909449107. - DOI - PMC - PubMed

Substances

LinkOut - more resources