. 2023 Sep 13;31(9):1552-1567.e8.
doi: 10.1016/j.chom.2023.08.001. Epub 2023 Aug 30.

Pathogen-driven CRISPR screens identify TREX1 as a regulator of DNA self-sensing during influenza virus infection

Affiliations

Pathogen-driven CRISPR screens identify TREX1 as a regulator of DNA self-sensing during influenza virus infection

Cason R King et al. Cell Host Microbe. .

Abstract

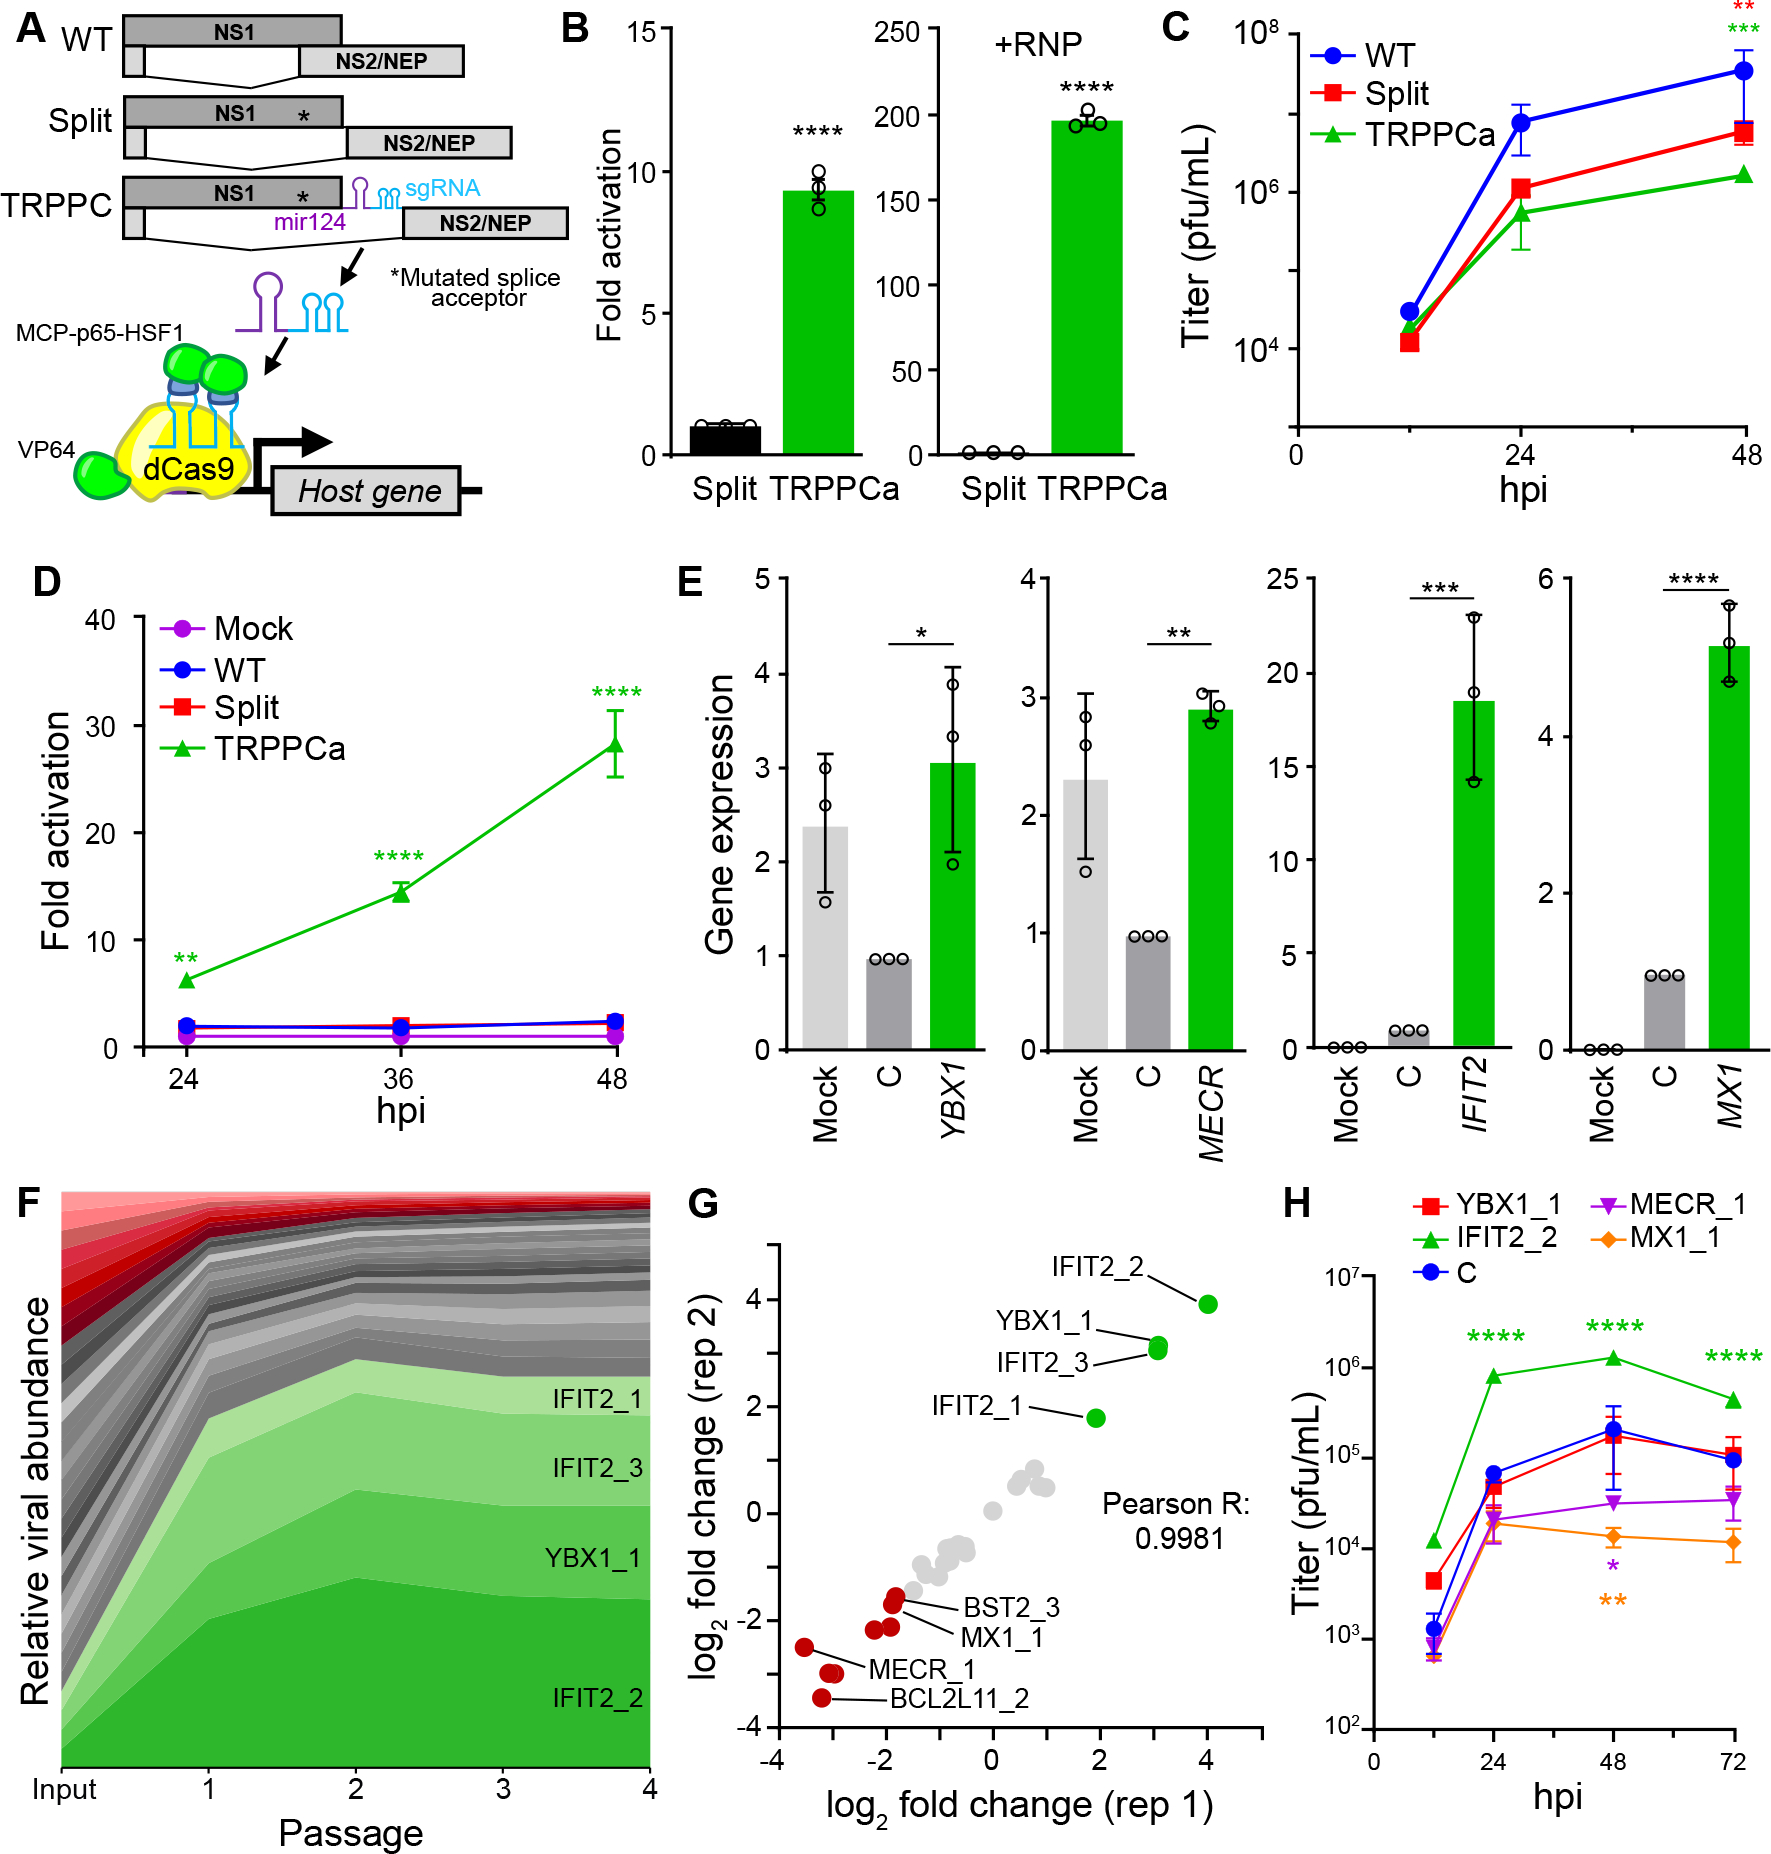
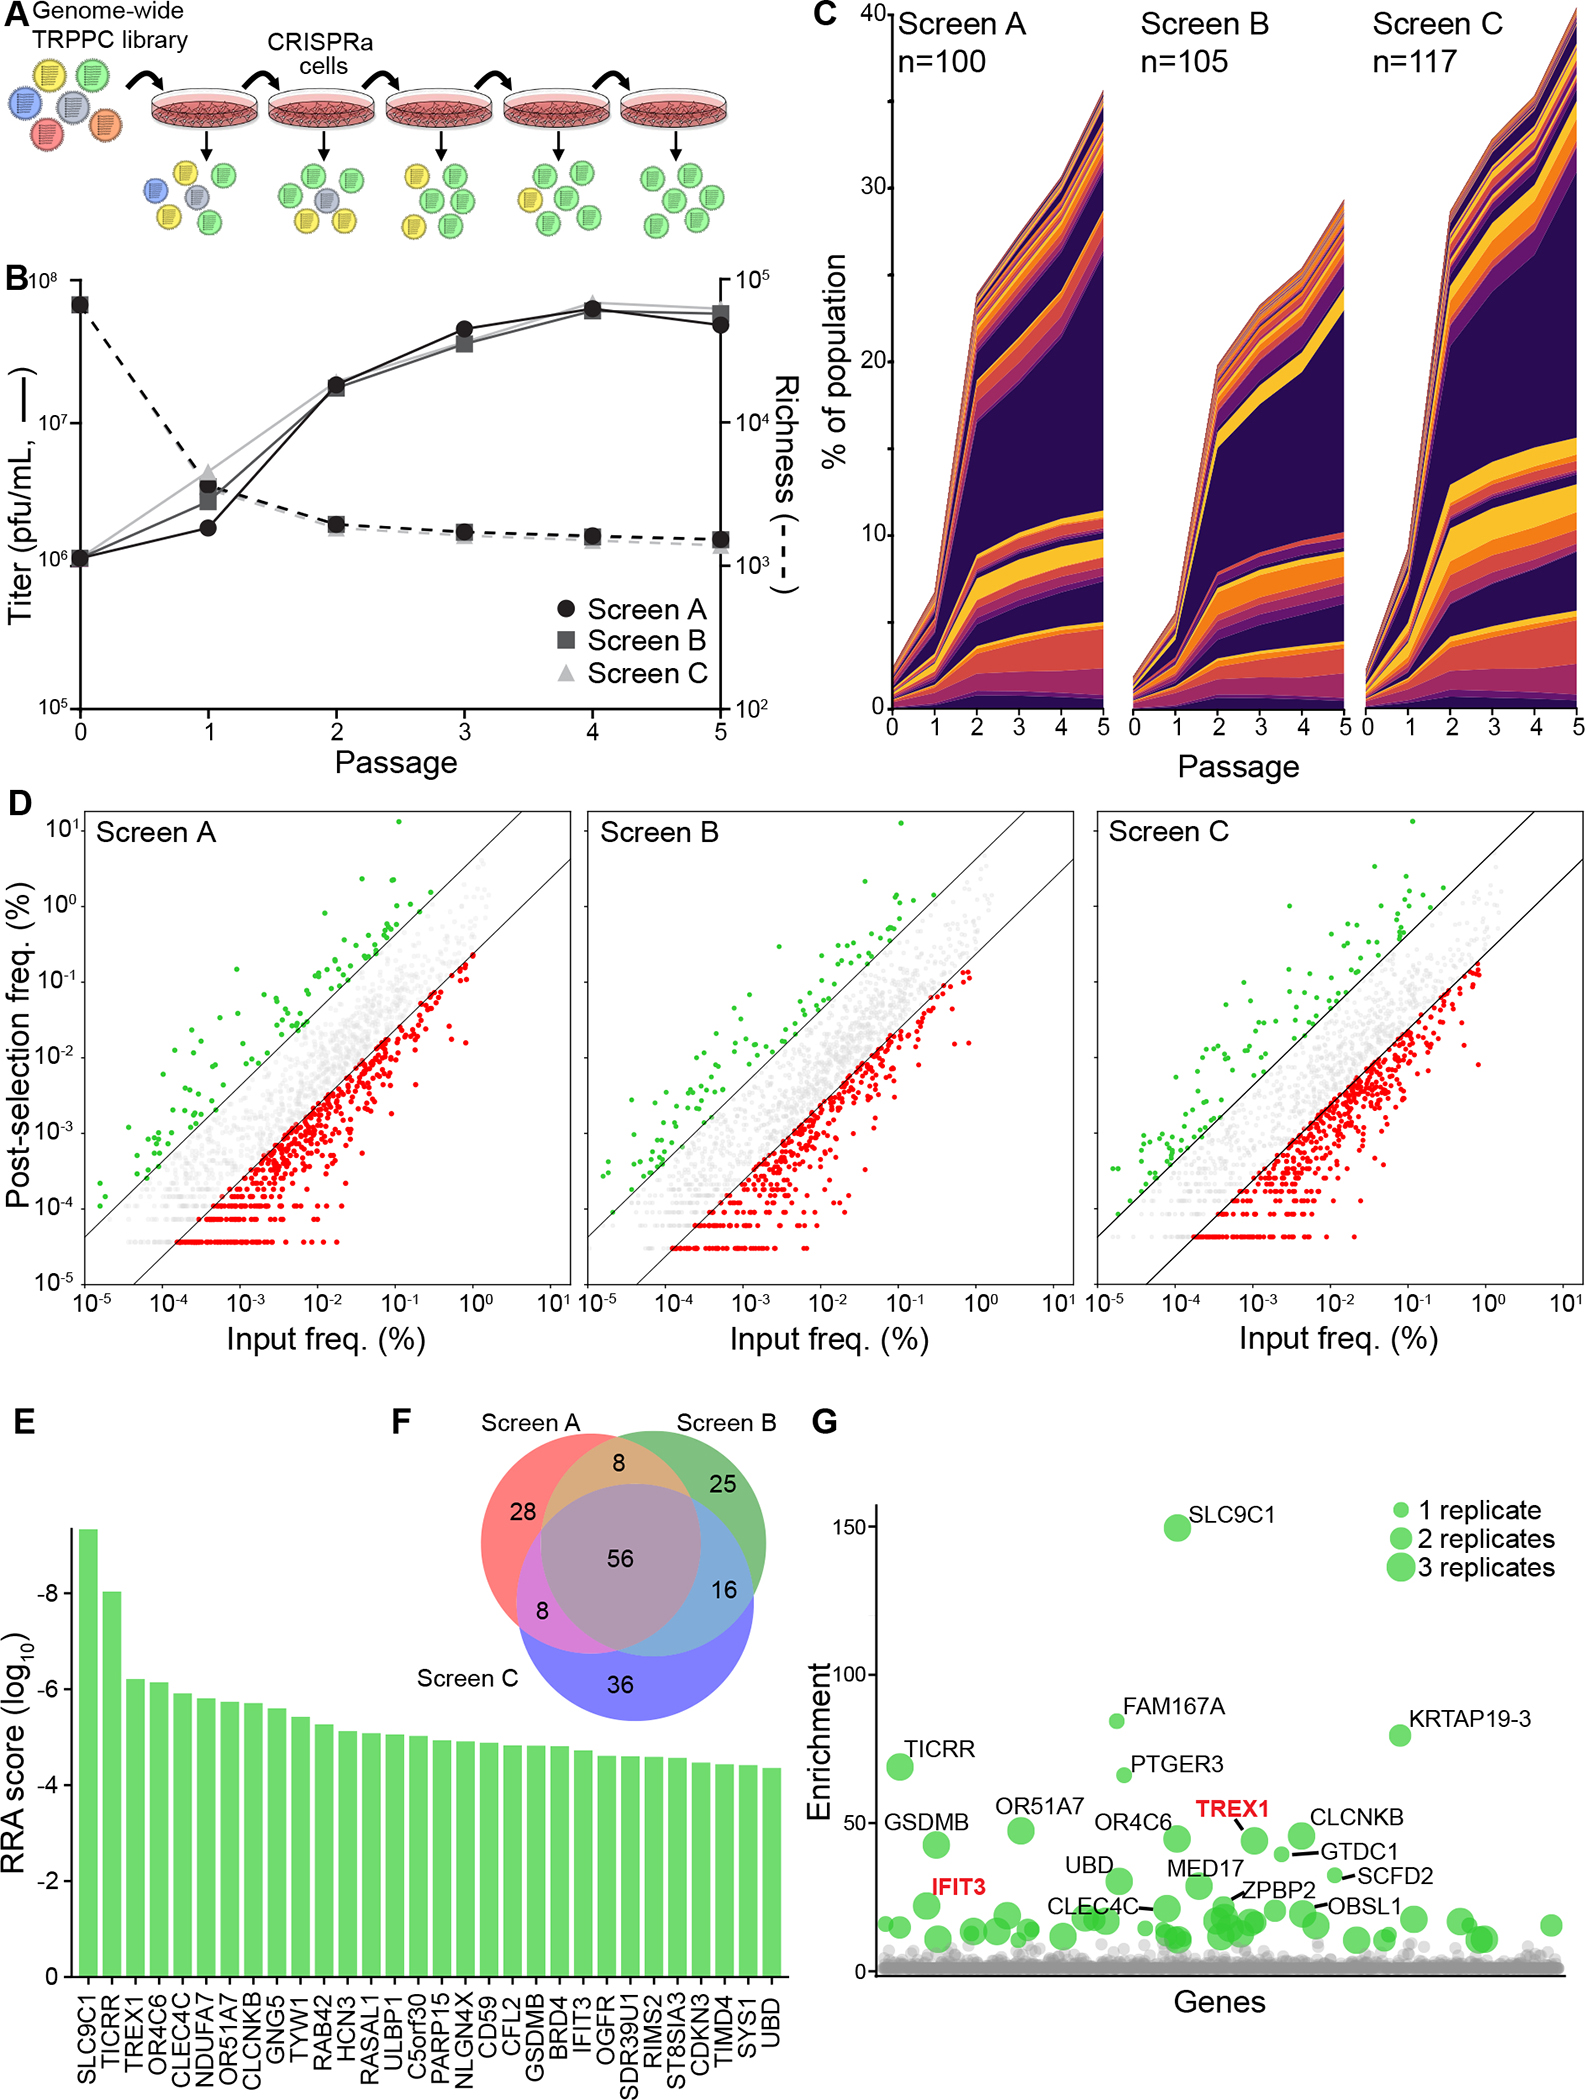
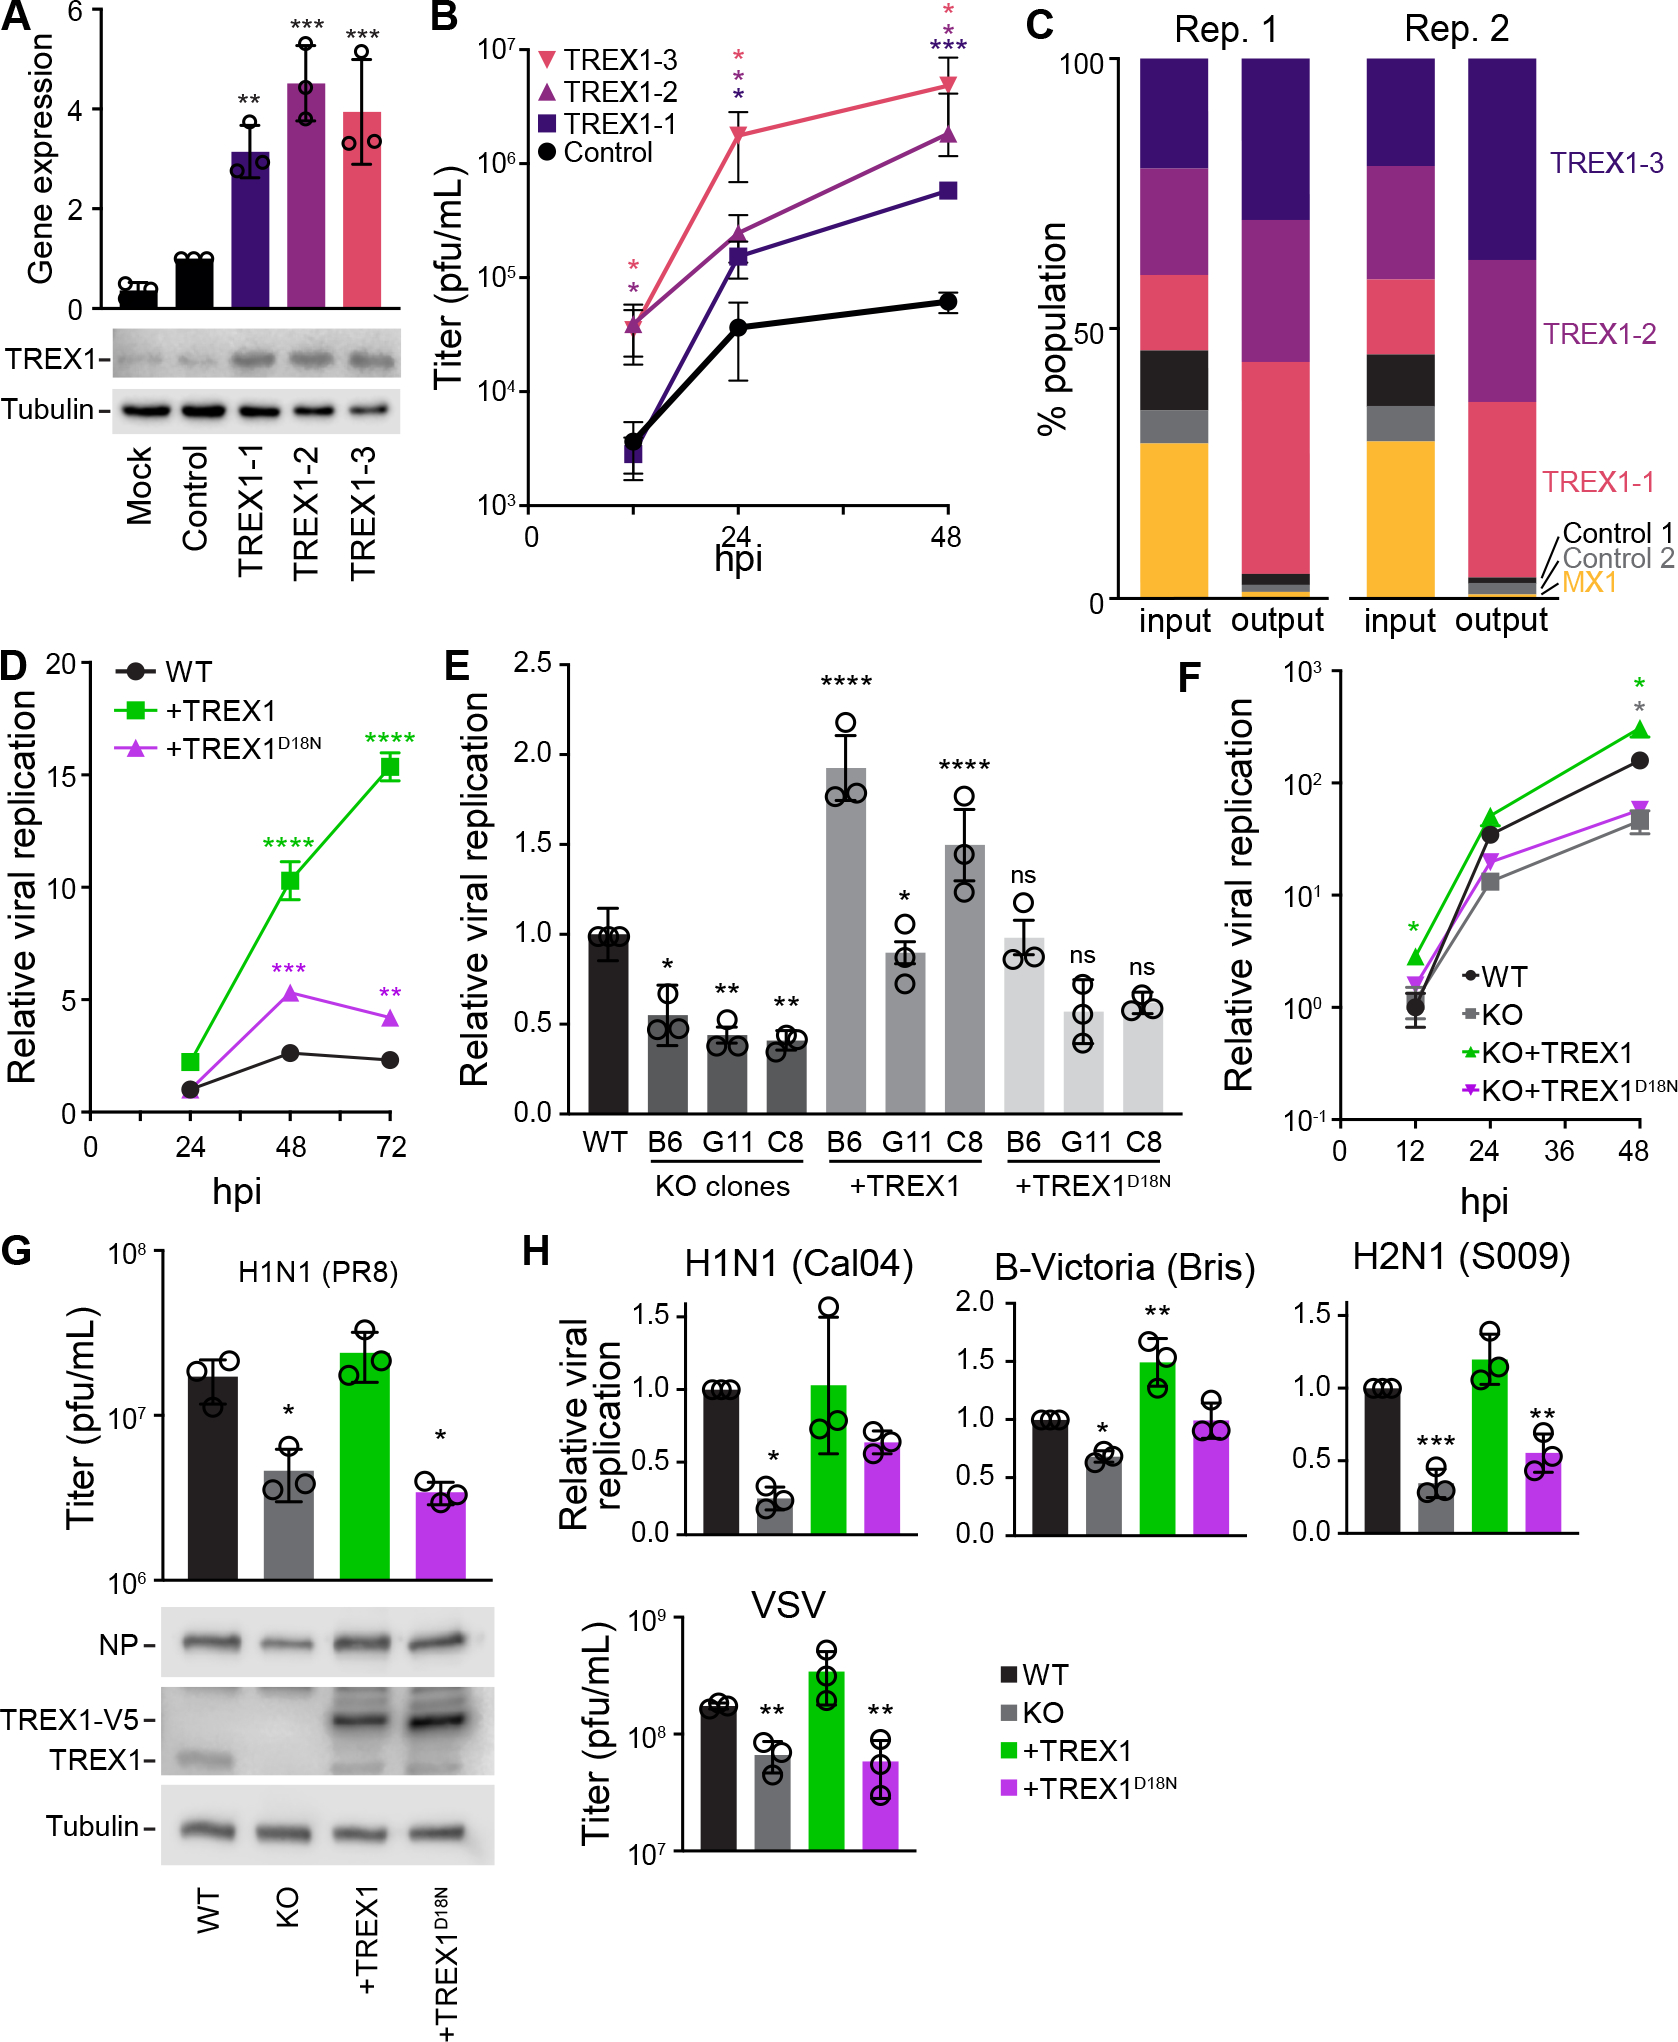
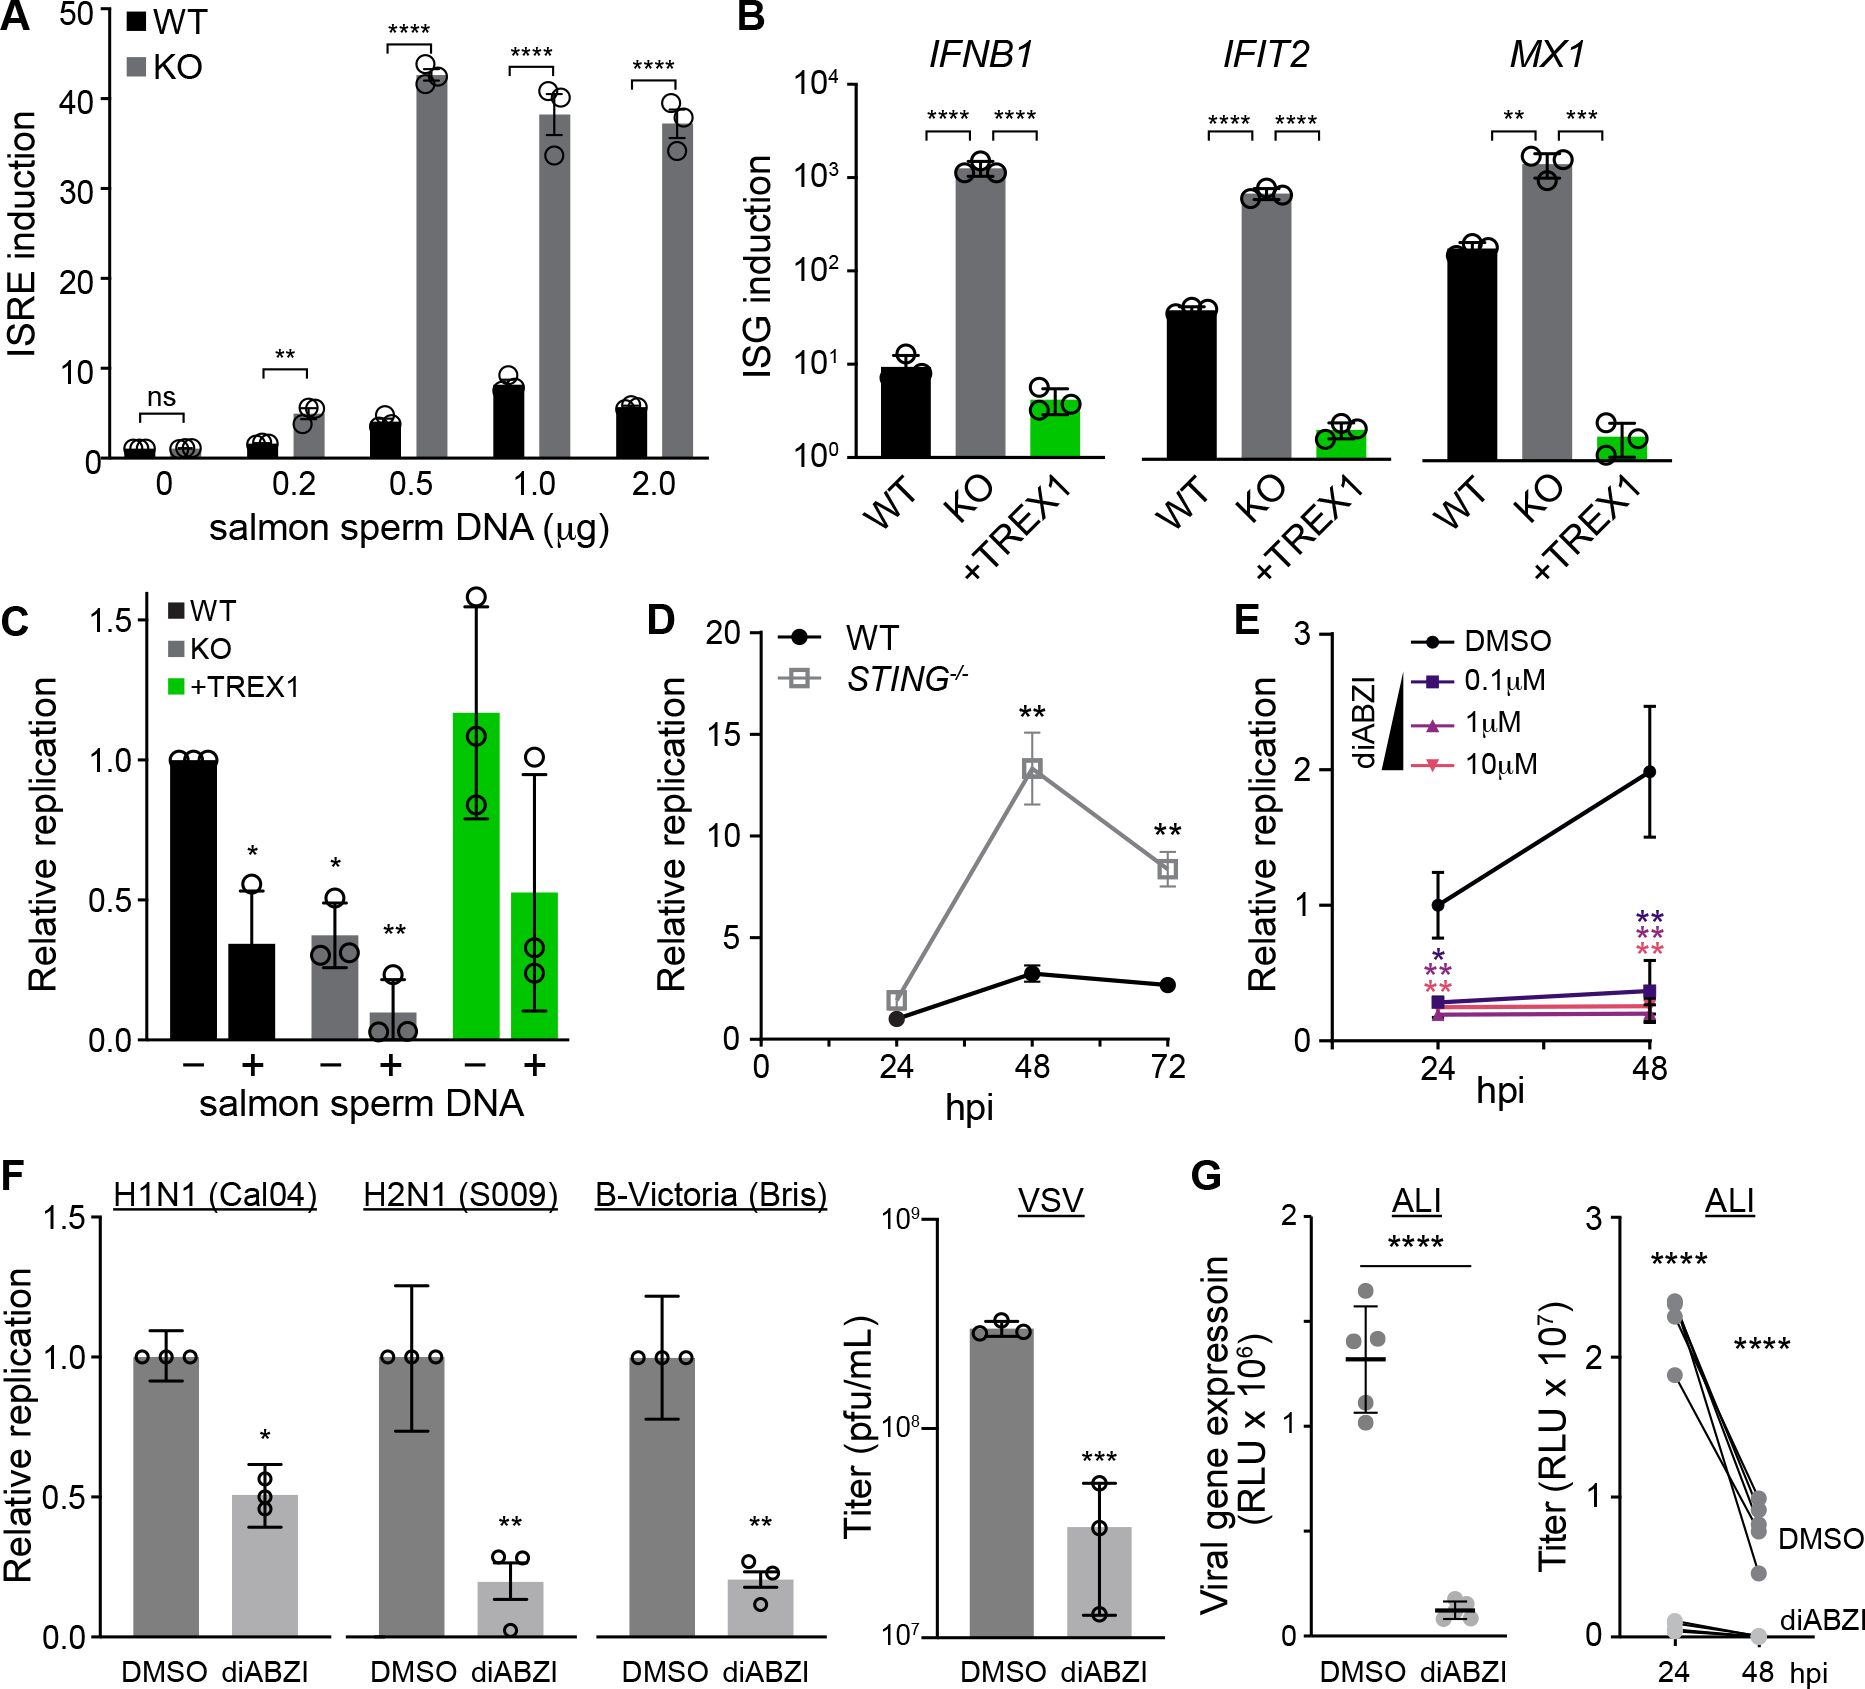
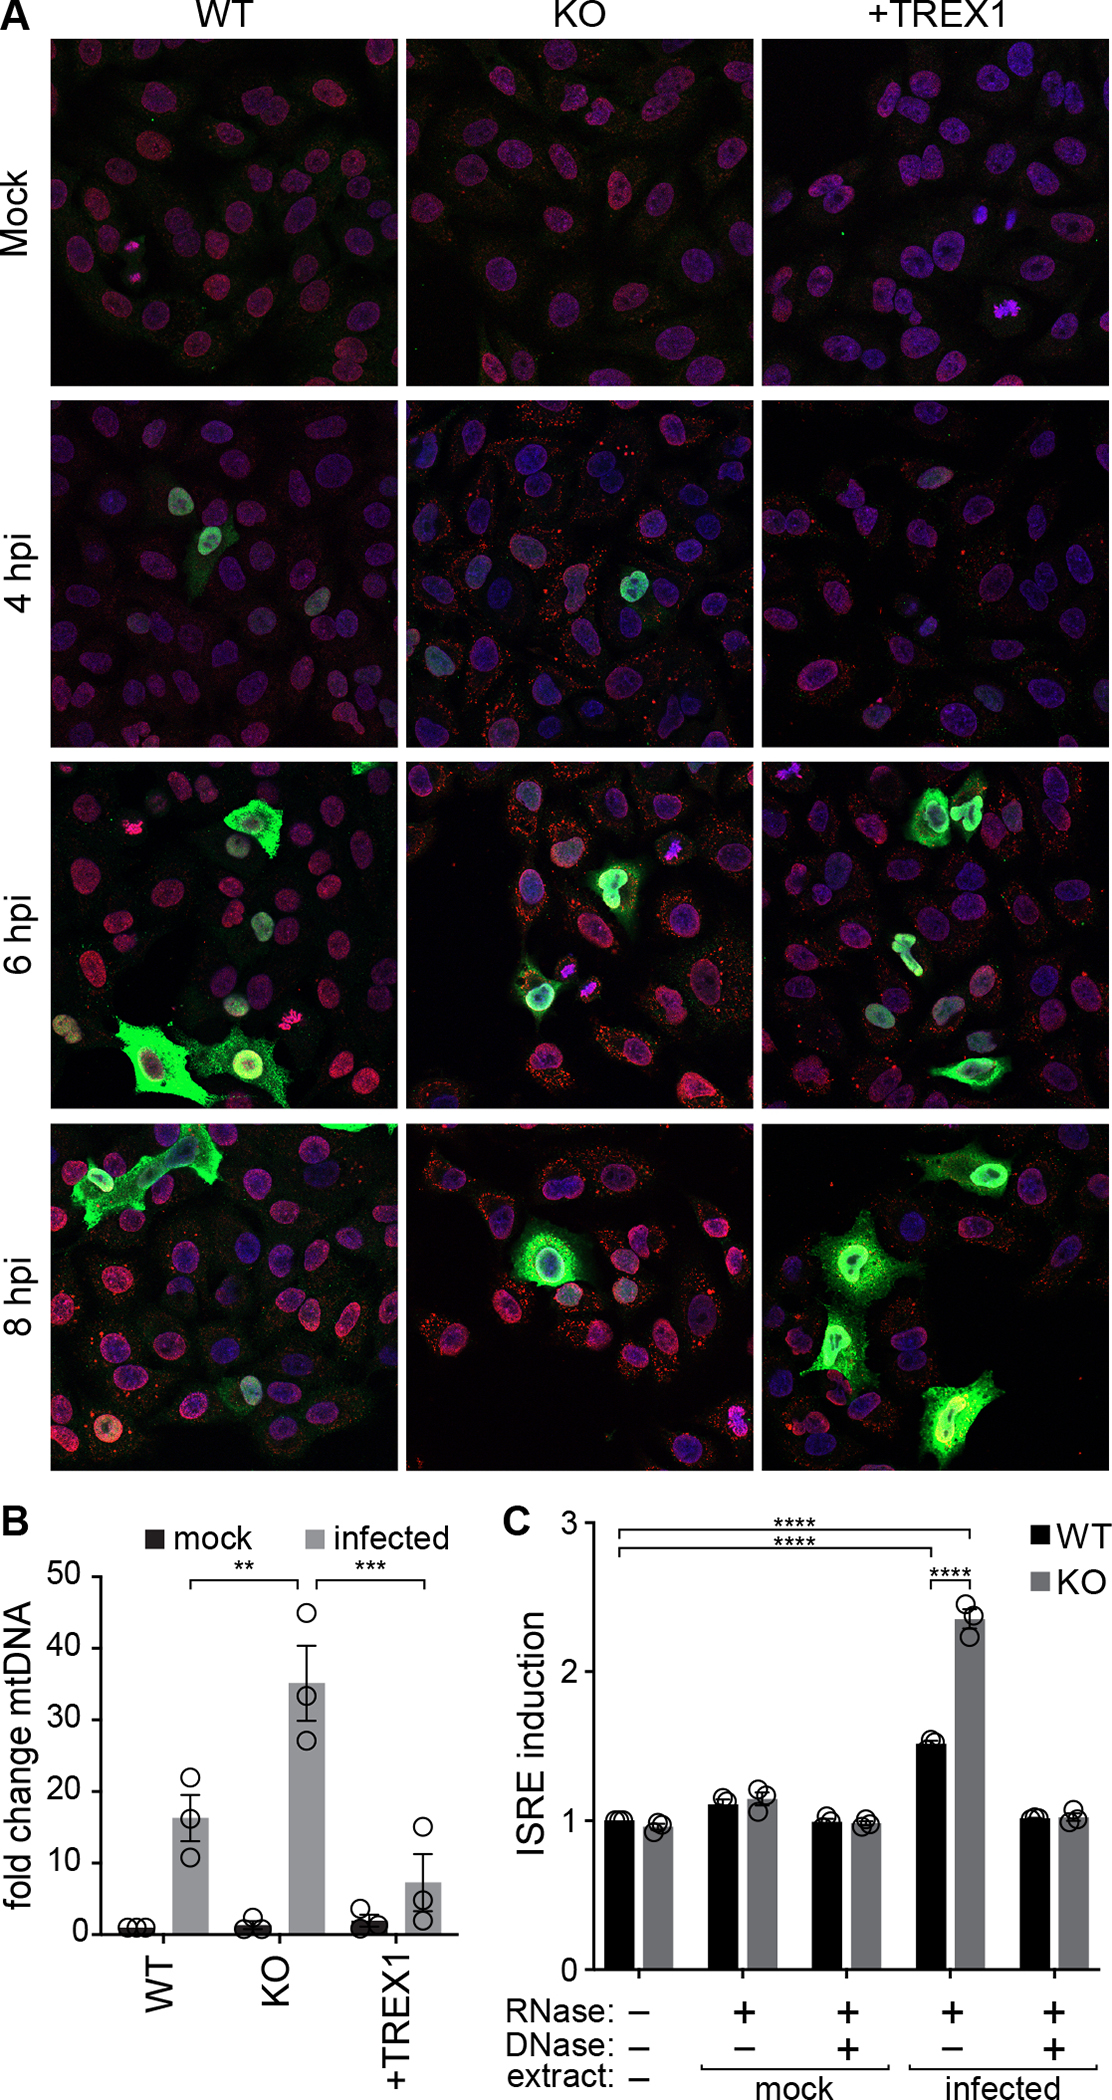
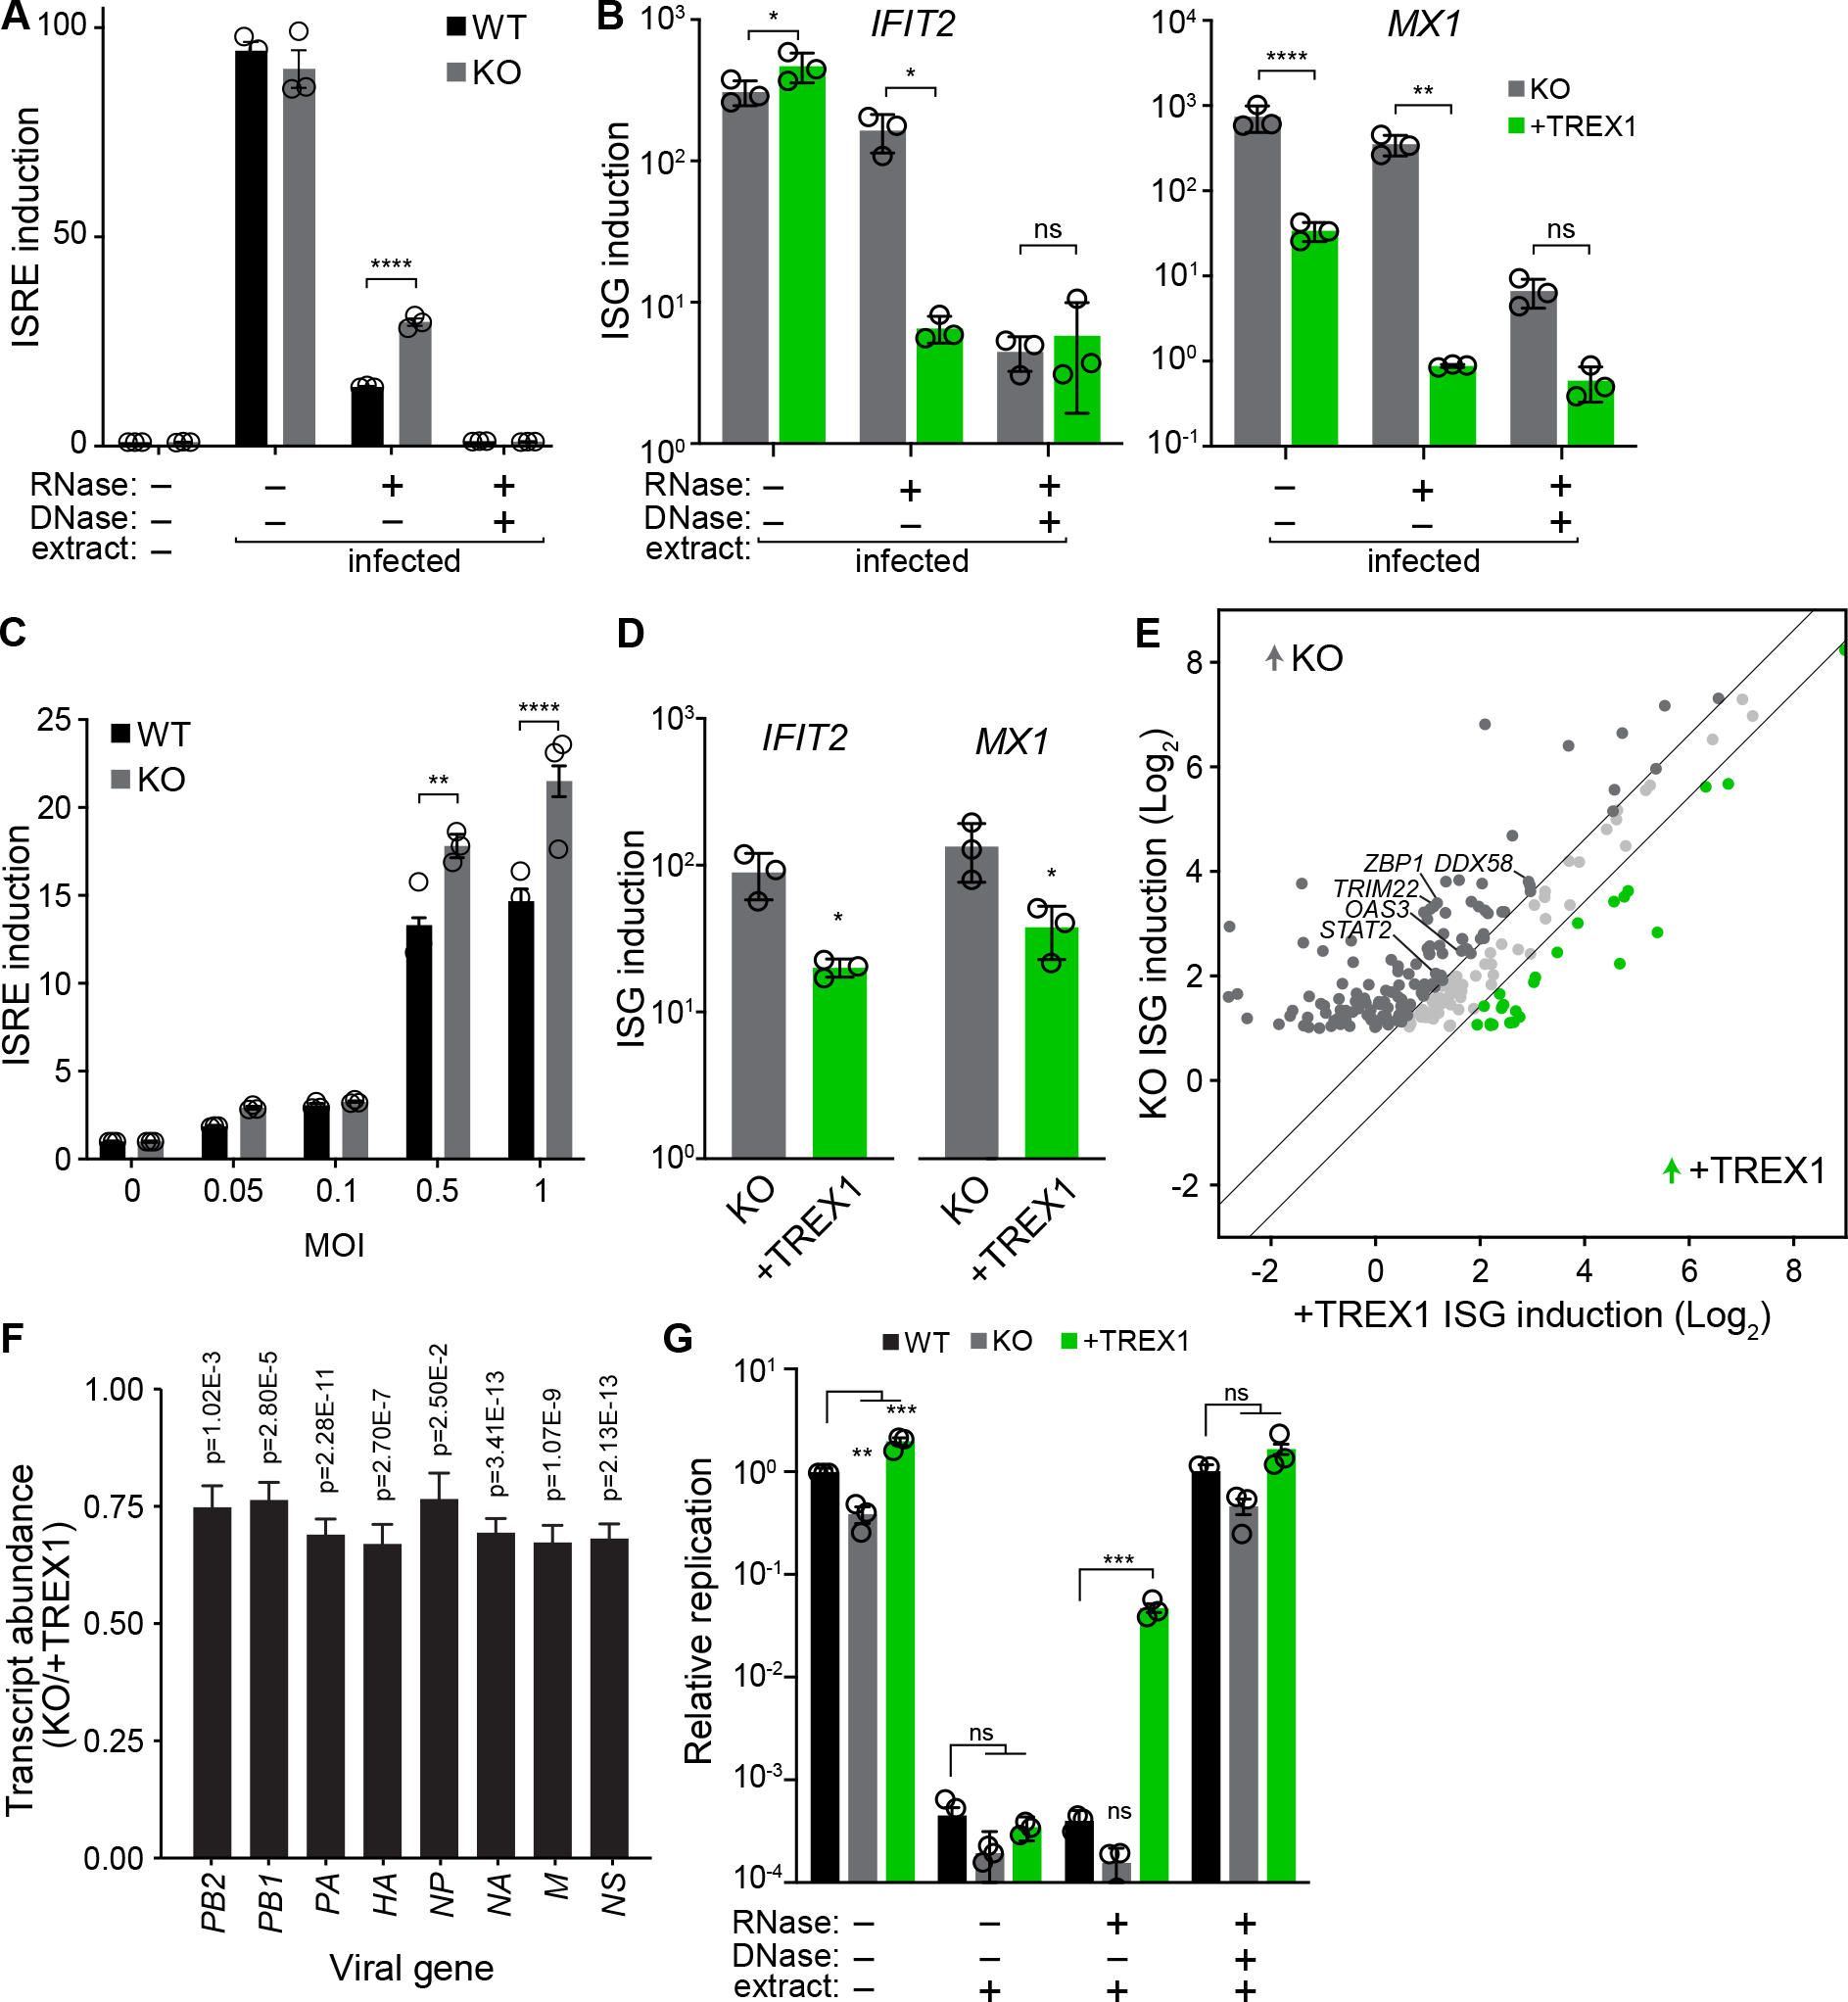
Host:pathogen interactions dictate the outcome of infection, yet the limitations of current approaches leave large regions of this interface unexplored. Here, we develop a novel fitness-based screen that queries factors important during the middle to late stages of infection. This is achieved by engineering influenza virus to direct the screen by programming dCas9 to modulate host gene expression. Our genome-wide screen for pro-viral factors identifies the cytoplasmic DNA exonuclease TREX1. TREX1 degrades cytoplasmic DNA to prevent inappropriate innate immune activation by self-DNA. We reveal that this same process aids influenza virus replication. Infection triggers release of mitochondrial DNA into the cytoplasm, activating antiviral signaling via cGAS and STING. TREX1 metabolizes the DNA, preventing its sensing. Collectively, these data show that self-DNA is deployed to amplify innate immunity, a process tempered by TREX1. Moreover, they demonstrate the power and generality of pathogen-driven fitness-based screens to pinpoint key host regulators of infection.

Keywords: CRISPR activation; TREX1; fitness-based screen; influenza virus; mtDNA.


Conflict of interest statement

Declaration of interests C.R.K. and A.M. are inventors on a provisional patent related to this work.

Figures

Fig. 1
Fig. 1. Transcriptional regulation by influenza-programmed Cas9 (TRPPC) manipulates host gene expression to enable fitness-based screening.
A, Cartoon of re-engineered TRPPC NS genome segment and TRPPCa-mediated gene expression. The sgRNA directs VP64-dCas9 to specific genome targets while two MS2 hairpins inserted in the sgRNA recruit MCP-p65-HSF1. B, TRPPCa of a luciferase reporter in 293T cells. Cell were transfected with vectors expressing viral genomic RNA for NS, Split NS that lacks an sgRNA, or TRPCC NS targeting the reporter promoter. Activation was measured in the presence (+RNP, right) or absence (left) of the viral replication machinery. C, Multicycle replication of IAV harboring a TRPPC-NS segment in A549 cells. D, Virally delivered sgRNA activates reporter gene expression in a multicycle infection. A549-CRISPRa cells were inoculated with virus encoding the indicated NS segment (MOI = 0.05), or mock treated, and luciferase reporter was measured over the course of infection. E, Virally delivered sgRNAs activate expression of host genes from the endogenous locus. A549-CRISPRa cells were inoculated with TRPPC viruses (MOI = 5) targeting the indicated gene, a non-targeting control (C) or mock. Host gene expression was measured at 8 hpi via RT-qPCR. F, A pool of 34 TRPPC viruses targeting a collection of 11 potential pro- or antiviral host genes were subject to 4 rounds of selection in A549-CRISPRa cells cells. Viruses present at each stage of selection were quantified by deep-sequencing and normalized sgRNA composition is depicted. Viruses activating proviral genes enriched at least 3-fold are colored green, while viruses activating antiviral genes that are depleted at least 3-fold are colored red. Graph is representative of mean values for 2 replicate screens. G, TRPPCa screens are highly reproducible. Comparison of two biological replications shows nearly identical relative enrichment of TRPPC viruses targeting the indicated host genes after 4 rounds of selection. H, TRPPC results reflect changes in viral replication. Multicycle replication in A549-CRISPRa cells of individual TRPPC viruses targeting specific host genes (MOI = 0.01). Data are shown as grand mean of 3 replicates ± SEM (B, D) or mean ± s.d. (C, E, F, H). T tests (B), two-way ANOVA with Dunnett’s multiple comparisons test against WT (C, D, H), and one-way ANOVA with Dunnett’s multiple comparisons tests (E) were performed (*p<0.05, **p<0.01, ***p<0.001, ****p<0.0001). See also Figure S1.
Fig. 2
Fig. 2. Genome-wide TRPPC screens identify new pro-IAV host factors.
A, Experimental design of a genome-wide TRPPC screen in CRISPRa cells. B, Viral titers (left axis, solid line) and population richness (right axis, dashed line) were measured of 5 sequential rounds of TRPPCa selection. Data for independent screens A, B and C are shown. C, Stack plot of the abundance of individual TRPPC viruses in three independent genome-wide screen. Viruses enriched >4-fold at passage 5 are plotted for each replicate, with number of enriched viruses indicated for each screen. Colors are used to distinguish each member, but are not unique to any specific sgRNA. D, Final abundance of individual TRPPC viruses at passage 5 as a function of their abundance at passage 0 for all replicates. Colors represent viruses >4-fold enriched (green) or >4-fold depleted (red) or unchanged (grey). E, Robust ranking aggregation for top hits. MAGeCK gene scores for the top 30 genes in the TRPPC screens. F, Venn diagram of genes enriched >4-fold in the 3 screen replicates. G, Bubble plot of positive selection values for all genes in the screen. Bubble size indicates the number of replicate screens in which that gene was detected. Colored dots represent genes >10-fold enriched, with labelled dots representing genes >20-fold enriched. Genes are randomly positioned along the x-axis. See also Figure S2 and Table S1.
Fig. 3
Fig. 3. The 3′–5′ DNA exonuclease TREX1 is a pro-viral host factor for RNA viruses.
A, Multiple TRPPC viruses with distinct targeting sequences activate TREX1 expression. A549-CRISPRa cells were inoculated (MOI = 1) with viruses targeting different sites in the TREX1 promoter or a non-targeting control. TREX1 expression was measured relative to mock by RT-qPCR at 10 hpi and western blotting at 12 hpi. B, Multicycle replication of TREX1- or non-targeting TRPPC viruses in A549-CRISPRa cells (MOI = 0.01). Titers determined by plaque assay. C, A pool of TRPPC viruses were competed for 48 h during replication in A549-CRISPRa cells (pooled MOI = 0.05). Relative abundances at the start (input) and end (output) of the infection for each virus was determined by sequencing and shown for 2 independent replicates. D, Multicycle replication of a WSN influenza A reporter virus in WT A549 cells or lines stably expressing TREX1 or the catalytic mutant TREX1D18N. Replication was normalized to viral titers in WT cells at 24 hpi. E, Viral replication was measure at 48 hpi (MOI = 0.05) in 3 distinct TREX1-KO clones inoculated with a WSN influenza A reporter virus. Clones were complemented with TREX1 or TREX1D18N, where indicated. Values are relative to replication in parental WT A549 cells. For statistical analyses, KO clones were compared to WT, whereas complemented clones were compared to the matched KO. F, Multicycle replication of a WSN influenza A reporter virus (MOI = 0.05) in WT A549 cells, TREX1-KO cells, or complemented cell lines. Values are compared to replication in parental WT A549 cells at 12 hpi. G. Viral titers at 48 hpi (above) and NP protein levels at 24 hpi (below) in cells inoculated with PR8 (MOI = 0.01) H, Replication of reporter influenza viruses based on the primary viral isolates CA04 (MOI = 0.5), S009 (MOI = 0.05), B/Bris (MOI = 0.2) at 48 hpi or VSV (MOI = 0.001) at 24 hpi. Values are compared to replication in parental WT A549 cells. Data are shown as grand mean for 3 replicates ± SEM (D-F, H) or mean ± s.d. (A-B, D, G). One-way ANOVA with post-hoc Dunnett’s tests were performed except for (E), which used a one-way ANOVA with post-hoc Tukey’s test (*p<0.05, **p<0.01, ***p<0.001, ****p<0.0001, ns = not significant). See also Figure S3.
Fig. 4
Fig. 4. TREX1 regulates RNA virus replication by moderating DNA sensing.
A, WT and TREX1-KO cells were transfected with the indicated amounts of salmon sperm DNA and innate immune activation was measure with an IFN-stimulated response element (ISRE) reporter. Values are normalized to untransfected WT cells. B, WT, TREX-KO, or complemented cells were transfected with salmon sperm DNA. ISG expression relative to mock-transfected cells was measured by RT-qPCR. C, WT, TREX-KO, or complemented cells were transfected with salmon sperm DNA prior to inoculation with IAV (MOI = 0.05). Replication was measured at 24 hpi and normalized to mock-transfected WT cells. D, Multicycle replication of IAV (MOI = 0.05) in WT or STING-KO A549 cells. Replication is normalized to WT cells at 24 hpi. E, Multicycle replication of IAV WSN reporter virus (MOI = 0.05) in A549 cells treated with a STING agonist (diABZI) or a DMSO control. Replication is normalized to DMSO-treated cells at 24 hpi. F, Replication of reporter influenza viruses based on the primary viral isolates CA04 (MOI = 0.5), S009 (MOI = 0.05), B/Bris (MOI = 0.2), or VSV (MOI = 0.001) in A549 cells treated with 1μM diABZI or control. Relative replication was measured at 48 hpi for influenza viruses and 24 hpi for VSV. G, Gene expression (left) and viral replication (right) of CA04 (MOI= 0.1) in primary human bronchial epithelial cells grown at the air liquid interface (ALI). Cells were treated with 10μM diABZI or DMSO. Data are shown as grand mean of 3 replicates ± SEM (A, C-F) or mean ± s.d. (B,G). Pairwise T tests (A, D, F, G left), one-way ANOVA with post-hoc Dunnett’s tests (B, C, E) and two-way ANOVA with Šídák’s multiple comparisons test were performed (*p<0.05, **p<0.01, ***p<0.001, ****p<0.0001, ns = not significant). Comparisons in C are to untreated WT cells, while those in E are to the DMSO control. See also Figure S4.
Fig. 5
Fig. 5. TREX1 degrades self-DNA released during IAV infection.
A, IAV infection releases dsDNA into the cytoplasm. Immunofluorescence staining of WT, TREX1-KO and complemented A549 cells inoculated with IAV (MOI = 1). Blue = DAPI (nucleus), green = viral NP, red = dsDNA. B, Cytosolic extracts were prepared from WT, TREX-KO and complemented A549 cells inoculated with influenza virus (MOI = 1) or mock treated. mtDNA in the cytoplasm was quantified by qPCR and shown relative to mock-infected WT cells. C, Cytosolic extracts were prepared from mock or infected A549 cells and re-introduced into WT or TREX1-KO ISRE reporter cells. Where indicated, extracts were pre-treated with nucleases prior to transfection. ISRE activation is normalized to untransfected WT cells. Data are shown as grand mean of 3 replicates ± SEM (C) or mean ± s.d. (B). Two-way ANOVA with Šídák’s multiple comparisons test (B) or a two-way ANOVA with post-hoc Tukey’s tests were performed (**p<0.01, ***p<0.001, ****p<0.0001, ns = not significant). See also Figure S5.
Fig. 6
Fig. 6. TREX1 tempers the anti-viral host response to influenza virus infection.
A, ISRE induction was measured in WT and TREX1-KO reporter cells transfected with nucleic acids extracted from infected A549 cells. Extracts were treated with the indicated nucleases prior to transfection. ISRE induction was normalized to untransfected WT cells. B, Activation of endogenous ISGs in TREX-KO or complemented cell lines transfected with nucleic acids extracted from infected A549 cells was measured by RT-qPCR. Extracts were treated with the indicated nucleases prior to transfection. C, ISRE induction was measured in WT and TREX1-KO reporter cells infected with IAV at the indicated MOIs. Data are normalized to uninfected cells for each cell type. D, Activation of endogenous ISGs in TREX1-KO and complemented cells infected with IAV was measured by qRT-PCR. E, Comparison of ISG induction (infected/mock) in TREX1-KO and complemented cells. Only ISGs induced ≥2-fold during infection in TREX1 KO cells are shown. Diagonal lines separate ISGs whose induction levels change by at least 50% different between cell lines. F, Differential gene expression of IAV transcripts in TREX1-KO versus complemented cells. G, IAV reporter replication in WT, TREX1-KO, and complemented A549 cells pre-treated with nucleic acids extracted from infected A549 cells. Extracts were treated with the indicated nucleases. Viral titers were measured 48 hpi and are shown relative to untreated WT cells. Data are shown as grand mean of 3 replicates ± SEM (A, C, G), mean ± s.d. (B, D), or fold change of three independent RNA-seq experiments (E-F). Significance was tested with a two-way ANOVA with Šídák’s mulitple comparisons (A-C), an unpaired T-test (D), a one-way ANOVA within each group with Dunnet’s correction (G), or Wald statistic (F). FDR-adjusted p-values are shown in F. For all others, *p<0.05, **p<0.01, ****p<0.0001, ns = not significant. See also Figure S6.

Update of

Similar articles

Cited by

References

    1. King CR, and Mehle A (2022). Retasking of canonical antiviral factors into proviral effectors. Current Opinion in Virology 56, 101271. 10.1016/j.coviro.2022.101271. - DOI - PMC - PubMed
    1. Baker SF, and Mehle A (2019). ANP32B, or not to be, that is the question for influenza virus. eLife 8, e48084. 10.7554/eLife.48084. - DOI - PMC - PubMed
    1. King CR, and Mehle A (2022). Going pro: retasking of canonical antiviral factors into proviral effectors. Current Opinions in Virology, accepted. - PMC - PubMed
    1. Trimarco JD, and Heaton NS (2022). From high-throughput to therapeutic: host-directed interventions against influenza viruses. Current Opinion in Virology 53, 101198. 10.1016/j.coviro.2021.12.014. - DOI - PMC - PubMed
    1. Brass AL, Huang IC, Benita Y, John SP, Krishnan MN, Feeley EM, Ryan BJ, Weyer JL, van der Weyden L, Fikrig E, et al. (2009). The IFITM proteins mediate cellular resistance to influenza A H1N1 virus, West Nile virus, and dengue virus. Cell 139, 1243–1254. 10.1016/j.cell.2009.12.017. - DOI - PMC - PubMed

LinkOut - more resources