. 2023 Sep 19;4(9):101175.
doi: 10.1016/j.xcrm.2023.101175. Epub 2023 Aug 30.

Human astrocytes and microglia show augmented ingestion of synapses in Alzheimer's disease via MFG-E8

Affiliations

Human astrocytes and microglia show augmented ingestion of synapses in Alzheimer's disease via MFG-E8

Makis Tzioras et al. Cell Rep Med. .

Abstract

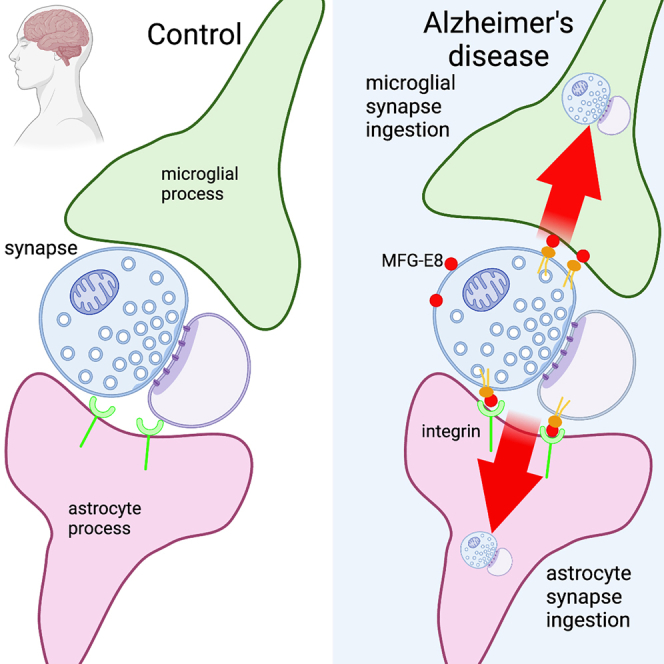
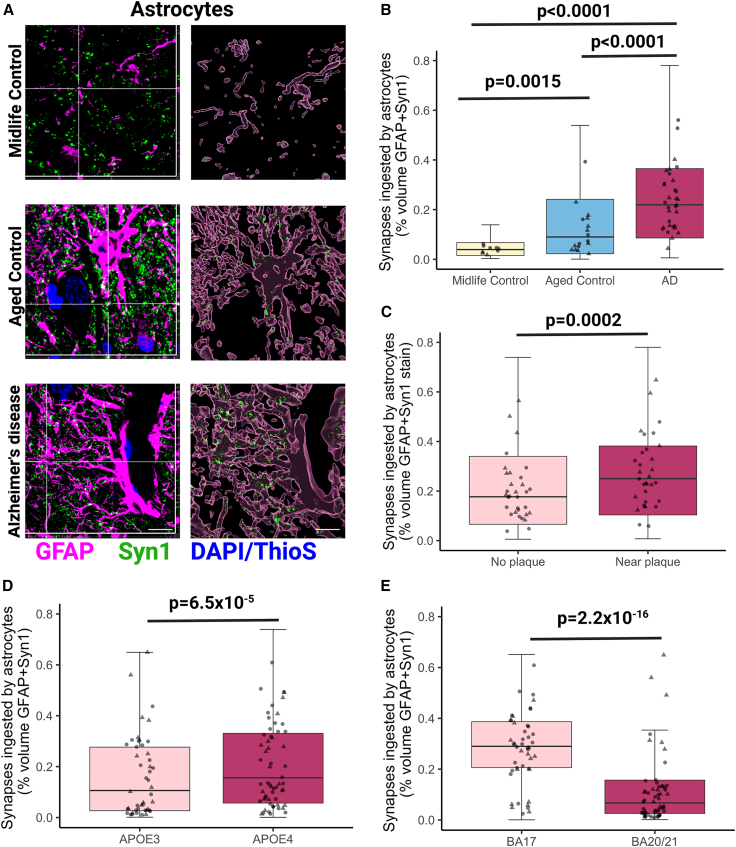
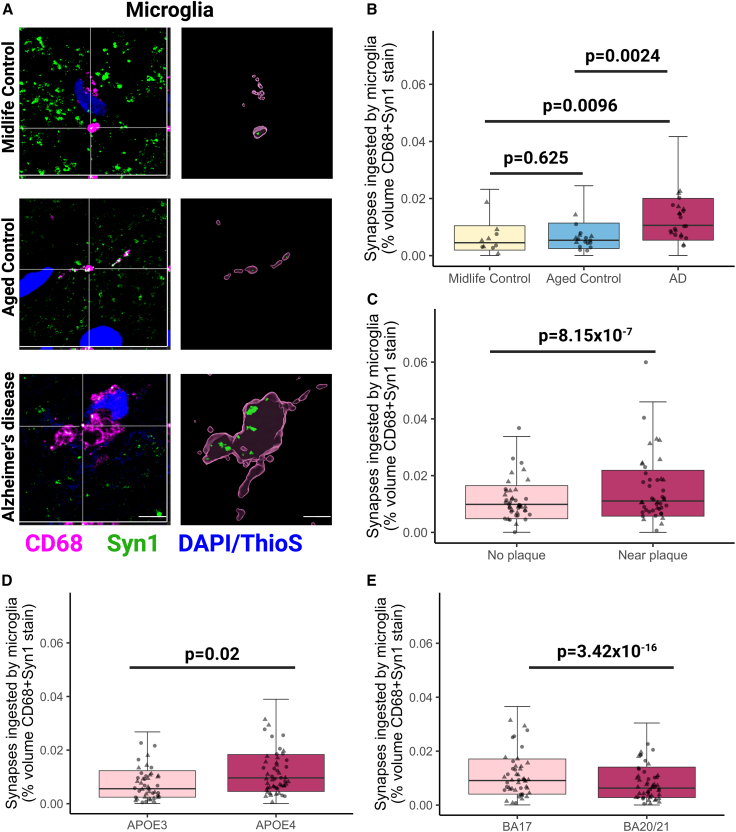
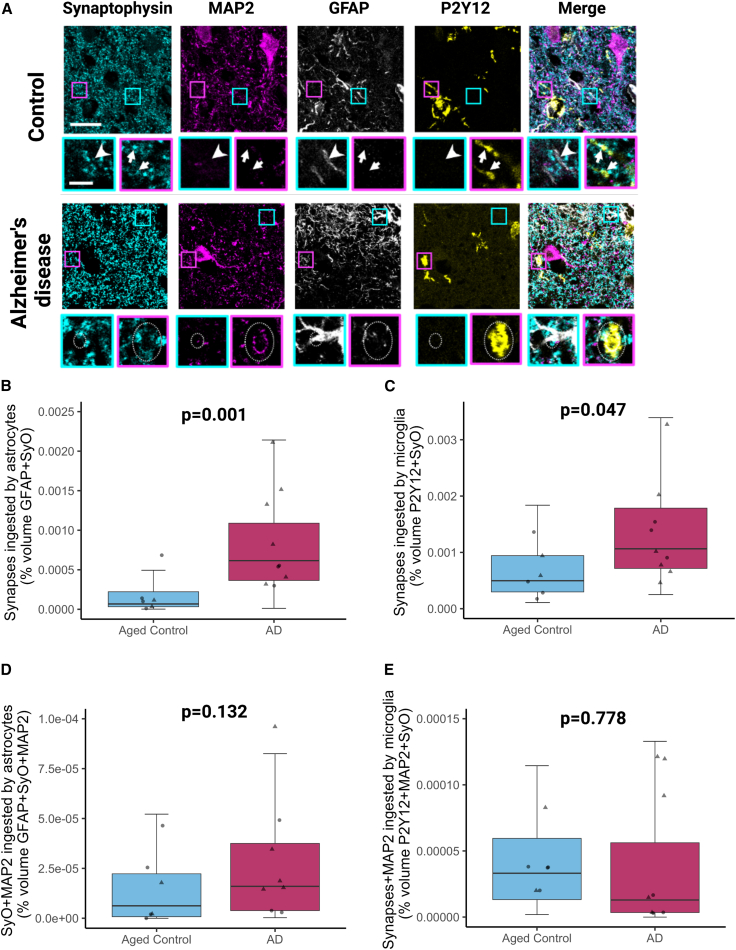
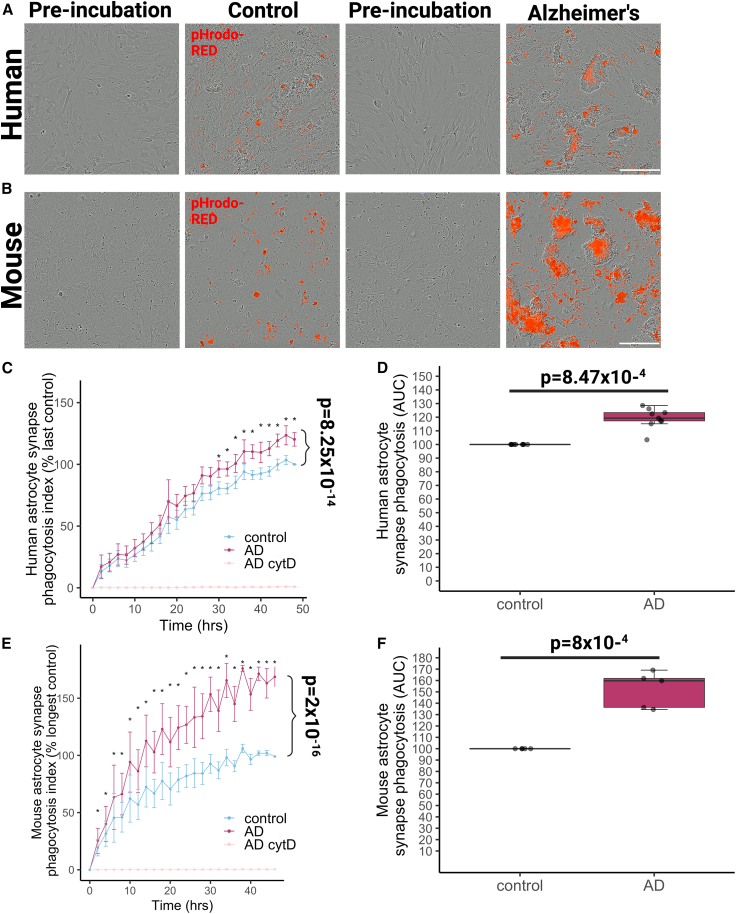
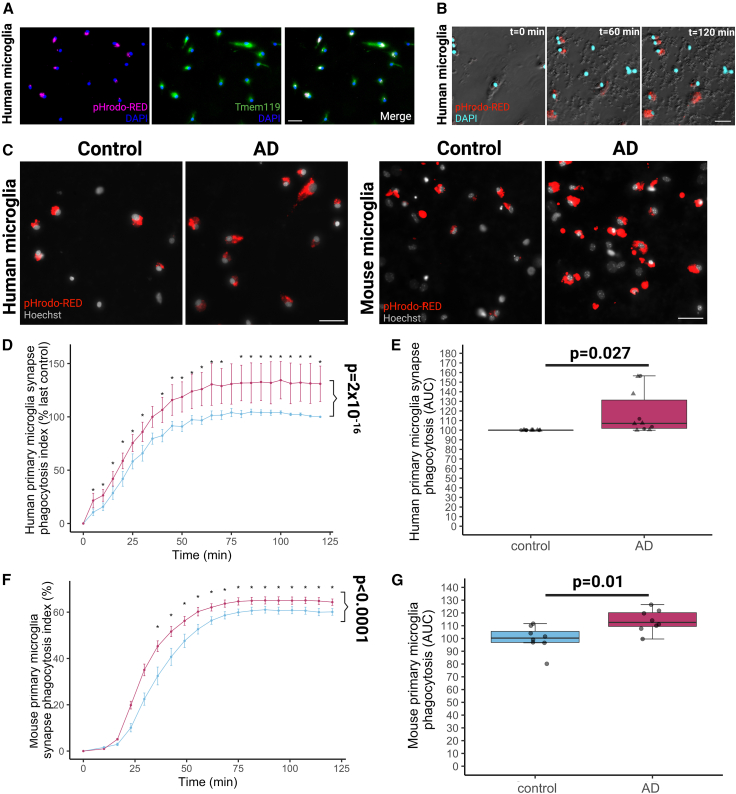
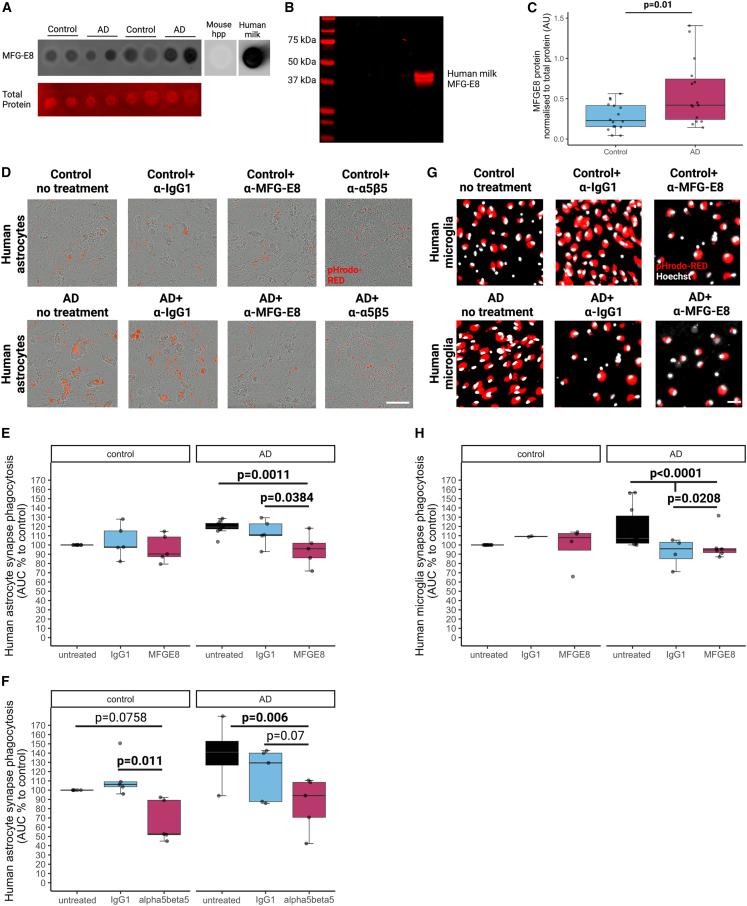
Synapse loss correlates with cognitive decline in Alzheimer's disease (AD). Data from mouse models suggests microglia are important for synapse degeneration, but direct human evidence for any glial involvement in synapse removal in human AD remains to be established. Here we observe astrocytes and microglia from human brains contain greater amounts of synaptic protein in AD compared with non-disease controls, and that proximity to amyloid-β plaques and the APOE4 risk gene exacerbate this effect. In culture, mouse and human astrocytes and primary mouse and human microglia phagocytose AD patient-derived synapses more than synapses from controls. Inhibiting interactions of MFG-E8 rescues the elevated engulfment of AD synapses by astrocytes and microglia without affecting control synapse uptake. Thus, AD promotes increased synapse ingestion by human glial cells at least in part via an MFG-E8 opsonophagocytic mechanism with potential for targeted therapeutic manipulation.

Keywords: Alzheimer’s disease; MFGE8; astrocytes; microglia; synapse loss; synapses.


Conflict of interest statement

Declaration of interests T.L.S.-J. is on the Scientific Advisory Board of Cognition Therapeutics and Scottish Brain Sciences and receives collaborative grant funding from two industry partners. None of these had any influence over the current paper.

Figures

None
Graphical abstract
Figure 1
Figure 1
Astrocytes ingest more synapses in Alzheimer’s disease compared with midlife and aged controls (A) Confocal images of immunostaining with orthogonal views (left) and three-dimensional reconstructions of stacks (right) of midlife control, aged control, and Alzheimer’s disease showing ingestion of synapsin 1 (Syn1, green) by astrocytes (GFAP, magenta) in human brain sections. Aβ plaques and nuclei are counterstained with Thioflavin S and DAPI, respectively, shown in blue. Only ingested Syn1 is shown in 3D Imaris reconstructions. Representative images are from BA17. Scale bars represent 5 μm. (B) Quantification of synapsin 1 ingested by GFAP-positive astrocytes showed significantly increased levels in AD compared with both midlife controls (post hoc Tukey corrected tests after linear mixed effects model t = 8.138, p < 0.0001) and aged controls (t = 4.997, p < 0.0001), and also between midlife controls to aged controls (t = 3.68, p = 0.0015). (C) Statistically significant increase of synapsin 1 ingestion by astrocytes near Aβ plaques in AD cases (F[1,1202.02] = 13.6, p = 0.0002366). (D) The APOE4 genotype was associated with an increase in synapsin 1 colocalization inside GFAP-positive astrocytes (F[1,78.36] = 17.81, p = 6.5 × 10−5). (E) BA17 (primary visual cortex) was associated with higher levels of synapsin 1 colocalization inside GFAP-positive astrocytes compared with BA20/21 (inferior temporal cortex) (F[1,2228.59] = 1382.4, p = 2.2 × 10−16). Statistical comparisons were made using ANOVA after linear mixed effects model on Tukey transformed data with case as a random effect and disease, brain region, APOE4 status, gender, and age as fixed effects. Untransformed data are presented in graphs (B)–(E). All data are included in boxplots and case medians are shown in points. Data in this figure are pooled from both BA17 and BA20/21. Males are represented by circles and females by triangles. Biological replicates were human brain donors: n = 10 midlife controls, 19 aged controls, AD 31 cases.
Figure 2
Figure 2
Microglia ingest more synapses in Alzheimer’s disease compared with midlife and aged controls (A) Confocal images of immunostaining with orthogonal views (left) and three-dimensional reconstructions of stacks (right) of midlife control, aged control, and Alzheimer’s disease showing ingestion of synapsin 1 (Syn1, green) by microglia (CD68, magenta) in human brain sections. Aβ plaques and nuclei are counterstained with Thioflavin S and DAPI, respectively, shown in blue. Only ingested Syn1 is shown in 3D Imaris reconstructions. Representative images are from BA17. Scale bars represent 5 μm. (B) Quantification of synapsin 1 ingested by CD68-positive microglia showed significantly increased levels in AD compared with midlife (Tukey corrected post hoc test t = 3.56, p = 0.0024) and aged controls (t = 3.09, p = 0.0096). No statistical difference was seen between midlife controls and aged control (t = 0.93, p = 0.625). Data here are pooled from both BA17 and BA20/21, sample size corrected by mixed effected linear model. (C) Statistically significant increase of synapsin 1 ingestion by microglia near Aβ plaques in AD cases (ANOVA F[1,881.57] = 20.74, p = 6.01 × 10−6). (D) The APOE4 genotype was associated with an increase in synapsin 1 colocalization inside CD68-positive microglia (F[1,42.86] = 5.84, p = 0.02). (E) BA17 (primary visual cortex) was associated with higher levels of synapsin 1 colocalization inside CD68-positive microglia compared with BA20/21 (inferior temporal cortex) (F[1,1973.76] = 67.82, p = 3.42 × 10−16). Statistical comparisons were made using post hoc Tukey test or ANOVA after linear mixed effects model on Tukey transformed data with case as a random effect and disease, brain region, APOE4 status, gender, and age as fixed effects. Untransformed data are presented in graphs (B)–(E). Males are represented by circles and females by triangles. Biological replicates were human brain donors: n = 10 midlife controls, 17 aged controls, AD 22 cases.
Figure 3
Figure 3
Astrocytes and microglia ingestion of synapses in the absence of neuronal neurite ingestion (A) Staining presynaptic terminals with synaptophysin, neuronal neurites with MAP2, astrocytes with GFAP, and microglia with P2Y12 reveals synaptic ingestion by astrocytes (cyan boxes, arrowheads) and microglia (magenta boxes, arrows) in the absence of MAP2 staining in control and AD brain. In AD, MAP2 positive neuronal protein can also be observed in astrocytes (cyan boxes, dotted ovals) and microglia (magenta boxes, dotted ovals). Large panels are maximum intensity projections of confocal image stacks. Insets are single sections to demonstrate colocalization. Scale bars represent 20 μm in large panels, 5 μm in insets. (B) Quantification of synaptophysin (SyO) ingested by GFAP-positive astrocytes showed significantly increased levels in AD compared with aged controls (ANOVA after linear mixed effects model with cohort, gender, and age as fixed effects and case as a random effect F[1,13.02] = 17.38, p = 0.001). (C) Quantification of SyO ingested by P2Y12-positive microglia showed significantly increased levels in AD compared with aged controls (ANOVA after linear mixed effects model F[1,13.007] = 4.8, p = 0.047). (D) Quantification of SyO and MAP2 ingested by GFAP-positive astrocytes showed no significant differences between AD and aged controls (ANOVA after linear mixed effects model F[1,13.01] = 2.58, p = 0.1324). (E) Quantification of SyO and MAP2 ingested by P2Y12-positive microglia showed no significant differences between AD and aged controls (post hoc Tukey corrected tests after linear mixed effects model F[1,12.98] = 0.08, p = 0.778). Biological replicates were human brain donors: n = 5 aged controls, AD 8 cases. Males are represented by circles and females by triangles.
Figure 4
Figure 4
Human and mouse astrocytes ingest human AD synapses more than control synapses in culture (A) Live-imaging assay of primary human fetal astrocytes shows astrocytes phagocytose pHrodo-Red-labeled human synaptoneurosomes from control and Alzheimer’s disease (AD) brains after treatment (48 h). Scale bar represents 200 μm. (B) Live-imaging assay of primary mouse embryonic astrocytes shows astrocytes phagocytose pHrodo-Red-labeled human synaptoneurosomes from control and AD brains after treatment (48 h). Scale bar represents 200 μm. (C) The phagocytosis index curves normalized to within experiment control at the last time point show that human astrocytes (n = 8 independent culture replicates) phagocytose AD synapses more and faster than controls (ANOVA after linear mixed effects model with disease status of synapse donor and incubation time as fixed effects and experimental replicate as random effect, effect of disease status F[1,370.03] = 50.25, p < 0.0001, effect of time F[24,370.09] = 85.45, p < 0.0001). Asterisks represent significant post hoc Tukey corrected tests between AD and control at the time points indicated. (D) Examining the area under the curve confirms that AD synapses are phagocytosed more by human astrocytes than control synapses (ANOVA after linear mixed effects model with disease status of synapse donor as fixed effect and experimental replicate as random effect F[1,9.60] = 61.14, p = 1.83 × 10−5). (E) Mouse astrocytes (E and F, n = 5 independent culture replicates) also ingest AD synapses more and faster than controls (effect of disease of synapse donor F[1,163.06] = 230.98, p < 0.0001; effect of incubation time F[25,163.17] = 28.40, p < 0.0001). Asterisks represent significant post hoc Tukey corrected tests between AD and control at the time points indicated. (F) Examining the area under the curve confirms that AD synapses are phagocytosed more by mouse astrocytes than control synapses (F[1,4.80] = 54.65, p = 0.0008). CytD, which inhibits phagocytosis, completely prevented synapse ingestion.
Figure 5
Figure 5
Human and mouse microglia ingest human AD synapses more than control synapses in culture (A) Immunocytochemistry on fixed microglia grown from human peritumoral tissue resected during neurosurgery shows they express the microglial-specific marker TMEM119 and engulfed pHrodo-Red-labeled human synaptoneurosomes when these were applied 2 h before fixation. Scale bar represents 20 μm. (B) Live imaging of human microglia (phase) with DAPI (cyan) and pHrodo-Red confirms live phagocytosis of human synapses over 2 h. Scale bar represents 20 μm. (C) Live imaging of human microglia with nuclear marker Hoechst and pHrodo-Red confirms that these primary cultured microglia engulf synapses derived from human AD and control brain. Scale bar represents 20 μm. (D) Quantification of experiments from n = 11 neurosurgical donors (each a biological replicate) shows that the phagocytosis index normalized to the final value for the control condition for each experiment increases over time and that AD synapses are phagocytosed more and faster than control synapses (ANOVA after linear mixed effects model on square root transformed data with synaptoneurosome donor disease status, incubation time, neurosurgical brain region, microglial donor gender, and microglial donor age as fixed effects and donor as a random effect, effect of disease status of synapse donor F[1,396.09] = 122.74, p < 2 × 10−16, effect of incubation time F[24,396.25] = 119.49, p < 2 × 10−16). (E) Quantifying the area under the curve of the phagocytosis index confirms more phagocytosis of AD than control synapses (∗ANOVA after linear mixed effects model with synaptoneurosome donor disease status, incubation time, neurosurgical brain region, microglial donor gender, and microglial donor age as fixed effects and donor as a random effect, effect of disease status of synapse donor F[1,12] = 6.38, p = 0.027). (F) Microglia grown from adult mouse brain phagocytose human synapses. Curves from n = 8 mice (mouse as biological replicate) show increased phagocytosis of AD compared with control synapses (ANOVA after linear mixed effects model with synaptoneurosome donor disease status and incubation time as fixed effects and mouse microglia donor as a random effect, effect of disease F[1,2.88E21] = 102.39, p < 0.0001, effect of incubation time F[18,inf] = 98.10, p < 0.0001). (G) Increased ingestion of AD synaptoneurosomes compared with control ones confirmed by an increased area under the curve in AD (∗ANOVA effect of disease status of synapse donor F[1,14] = 8.96, p = 0.01).
Figure 6
Figure 6
Synaptic MFG-E8 and astrocytic integrin α5β5 modulate phagocytosis of AD synaptoneurosomes (A) Representative dot blots of aged control and AD-derived synaptoneurosomes probed with MFG-E8. Mouse hippocampus (hpp) was used as a negative control where no MFG-E8 binding is observed and human milk was used as positive control where MFG-E8 is highly expressed. (B) The anti-MFG-E8 antibody was validated by western blot where it strongly binds to human milk at the correct predicted weight of 43 kDa. (C) Quantification of dot blots in control (n = 16) and Alzheimer’s disease (AD) (n = 15) synaptoneurosomes shows significantly higher levels of MFG-E8 in AD samples compared with control ones (ANOVA after linear mixed effects model on Tukey transformed data, F[1,29] = 7.59, p = 0.01, human brain donor is biological replicate). (D) Images from phagocytosis assays in human astrocytes treated with pHrodo-Red-labeled human synaptoneurosomes from control and AD brains, illustrating differences in phagocytosis of synapses with pre-treatment of synaptoneurosomes with MFG-E8 antibody, integrin α5β5 antibody, or IgG1 control antibody. Scale bar represents 200 μm. (E) Area under the curve (AUC % normalized to last control for each experiment) of human astrocytes ingesting control or AD synaptoneurosomes shows statistically significant decrease in phagocytosis of treated with anti-MFG-E8 antibody, but not IgG1, compared with AD untreated synaptoneurosomes and a significant difference between IgG1-treated and MFG-E8-treated synapse phagocytosis (n = 5 independent culture replicates; ANOVA after linear mixed effects model with disease status of synapse donor, time, and treatment as fixed effects and experimental replicate as a random effect shows an effect of disease of synapse donor F[1,30.2] = 9.674, p = 0.004058; treatment F[3,32.1] = 237.4, p = 2.2 × 10−6, and an interaction between disease status of synapse donor and treatment F[2,30.2] = 4.63, p = 0.0176). Post hoc Tukey corrected tests show in the AD synapse-treated cells that anti-MFG-E8 pre-treatment reduces phagocytosis compared with both no treatment (p = 0.0011) and IgG1 treatment (p = 0.0384). (F) Area under the curve (AUC % normalized to last control for each experiment) of human astrocytes ingesting control or AD synaptoneurosomes shows statistically significant decrease in phagocytosis of astrocytes treated with anti-α5β5 antibody, but not IgG1, compared with AD untreated astrocytes and a significant difference between IgG1-treated and anti-α5β5 antibody-treated astrocytes (n = 5 independent replicates; ANOVA after linear mixed effects model with disease status of synapse donor, time, and treatment as fixed effects and experimental replicate as a random effect shows an effect of disease of synapse donor F[1,20] = 8.71, p = 0.00788 and treatment F[1,20] = 8.71, p = 0.000234, but not a significant interaction between disease status of synapse donor and treatment F[2,20] = 2.76, p = 0.0872). Post hoc Tukey corrected tests show in the AD synapse-treated cells that anti-α5β5 pre-treatment reduces phagocytosis compared with no treatment (p = 0.006) and non-significant reduction to IgG1 treatment (p = 0.07). In control synaptoneurosome-treated cells, there was a non-significant reduction in phagocytosis in anti-α5β5 pre-treatment (p = 0.0758) but a significant reduction between IgG1 and anti-α5β5 pre-treatment (p = 0.011). (G) Images from phagocytosis assays in human microglia treated with pHrodo-Red-labeled human synaptoneurosomes from control and AD brains, illustrating differences in phagocytosis of synapses with pre-treatment of synaptoneurosomes with MFG-E8 antibody or IgG1 control antibody. Scale bar represents 20 μm. (H) Area under the curve (AUC % normalized to last control for each experiment) of human microglia ingesting control or AD synaptoneurosomes show that none of the treatments significantly changes phagocytosis of synapses isolated from control brain. In contrast, both MFG-E8 and IgG1 treatment significantly rescued the amount of microglial phagocytosis back to control levels (ANOVA after linear mixed effects model with disease status of synapse donor, time, treatment, age of microglial donor, brain region donated, and gender of microglial donor as fixed effects and microglial donor ID as a random effect shows significant effects of treatment F[2,813.97] = 11.69, p = 9.84 × 10−6 and an interaction between disease status of synapse donor and treatment F[2,816.83] = 39.19, p < 2.2 × 10−16). Tukey post hoc tests reveal significant differences in the AD group between no treatment and MFG-E8 antibody treatment (p < 0.0001), no treatment and IgG1 treatment (p < 0.0001), and between MFG-E8 and IgG1 treatment (p = 0.0208). In the control synapse-treated condition, there is a significant difference between untreated and IgG1-treated microglial phagocytosis (p = 0.036) with IgG1 treatment causing a slight increase in phagocytosis of control synapses. Total n = 11 donors with no treatment, n = 6 MFG-E8 + no treatment, n = 4 IgG1 + MFG-E8 + no treatment.

References

    1. Braak H., Braak E. Staging of Alzheimer’s disease-related neurofibrillary changes. Neurobiol. Aging. 1995;16:271–278. doi: 10.1016/0197-4580(95)00021-6. discussion 278-284. - DOI - PubMed
    1. Thal D.R., Rüb U., Orantes M., Braak H. Phases of A beta-deposition in the human brain and its relevance for the development of AD. Neurology. 2002;58:1791–1800. doi: 10.1212/wnl.58.12.1791. - DOI - PubMed
    1. Pickett E.K., Herrmann A.G., McQueen J., Abt K., Dando O., Tulloch J., Jain P., Dunnett S., Sohrabi S., Fjeldstad M.P., et al. Amyloid beta and tau cooperate to cause reversible behavioral and transcriptional deficits in a model of Alzheimer’s disease. Cell Rep. 2019;29:3592–3604.e5. doi: 10.1016/j.celrep.2019.11.044. - DOI - PMC - PubMed
    1. King D., Holt K., Toombs J., He X., Dando O., Okely J.A., Rose J., Gunn C., Correia A., Montero C., et al. Synaptic resilience is associated with maintained cognition during ageing. Alzheimers Dement. 2022;19:2560–2574. doi: 10.1101/2022.05.04.22274679. - DOI - PMC - PubMed
    1. Colom-Cadena M., Davies C., Sirisi S., Lee J.-E., Simzer E.M., Tzioras M., Querol-Vilaseca M., Sánchez-Aced É., Chang Y.Y., Holt K., et al. Synaptic oligomeric tau in Alzheimer’s disease — A potential culprit in the spread of tau pathology through the brain. Neuron. 2023;111:2170–2183.e6. doi: 10.1016/j.neuron.2023.04.020. - DOI - PubMed

Publication types

Substances