. 2023 Sep 19;4(9):101177.
doi: 10.1016/j.xcrm.2023.101177. Epub 2023 Aug 30.

Tumor-associated monocytes promote mesenchymal transformation through EGFR signaling in glioma

Affiliations

Tumor-associated monocytes promote mesenchymal transformation through EGFR signaling in glioma

Yiyun Chen et al. Cell Rep Med. .

Abstract

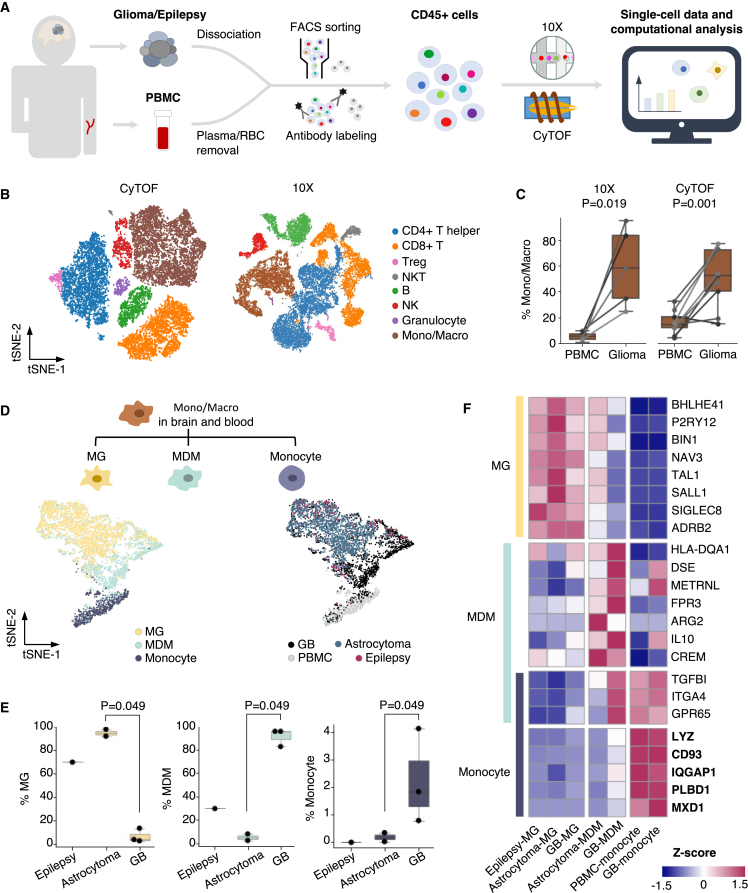
The role of brain immune compartments in glioma evolution remains elusive. We profile immune cells in glioma microenvironment and the matched peripheral blood from 11 patients. Glioblastoma exhibits specific infiltration of blood-originated monocytes expressing epidermal growth factor receptor (EGFR) ligands EREG and AREG, coined as tumor-associated monocytes (TAMo). TAMo infiltration is mutually exclusive with EGFR alterations (p = 0.019), while co-occurring with mesenchymal subtype (p = 4.7 × 10⁻⁷) and marking worse prognosis (p = 0.004 and 0.032 in two cohorts). Evolutionary analysis of initial-recurrent glioma pairs and single-cell study of a multi-centric glioblastoma reveal association between elevated TAMo and glioma mesenchymal transformation. Further analyses identify FOSL2 as a TAMo master regulator and demonstrates that FOSL2-EREG/AREG-EGFR signaling axis promotes glioma invasion in vitro. Collectively, we identify TAMo in tumor microenvironment and reveal its driving role in activating EGFR signaling to shape glioma evolution.


Conflict of interest statement

Declaration of interests The authors declare no competing interests.

Figures

None
Graphical abstract
Figure 1
Figure 1
Resolving the immune landscape in PBMC and glioma microenvironment (A) Workflow of the generation and analysis of immune cell landscape with 10X and CyTOF. (B) Immune cell types identified by CyTOF and 10X. (C) Comparison of the fraction of Mono/Macro in glioma and PBMC profiled by 10X and CyTOF. The p-values were calculated by two-tailed paired t-test. (D) The subtype (left) and sample of origin (right) of Mono/Macro profiled by 10X. (E) Boxplot comparing the fractions of MG, MDM, and monocyte in epilepsy and glioma patients profiled by 10X. The p-values were calculated by Wilcoxon rank-sum test. (F) Heatmap illustrating the MG-, MDM-, and monocyte-specific markers expression. Each row represents one marker gene, and the left annotation bar indicates whether the marker is MG-, MDM- or monocyte-specific. Abbreviations: FACS, fluorescence-activated cell sorting. See also Figures S1 and S2 and Tables S1–S3.
Figure 2
Figure 2
TAMo specifically expressed EREG and AREG (A) Violin plots highlighting the differentially expressed genes in different clusters, as well as their potential functions. The TAMo-specific genes are highlighted in bold. (B) Developmental trajectory of monocytes and MDM clusters. The black curves represented the trajectory predicted by Slingshot. (C) Comparison of TAMo score in patients of different glioma grade and molecular subtype in the TCGA dataset. p values were calculated by Wilcoxon rank-sum test. (D) Representative images of GB samples simultaneously stained with CD45, CD14, EREG, and AREG antibodies. The arrowhead highlights cells with strong signals for all four channels. Scale bar, 20 μm. See also Figure S2.
Figure 3
Figure 3
TAMo was associated with elevated EGFR signaling in GB (A) Associations between TAMo score and the overall survival in IDH-wildtype GB patients in TCGA (top) and Chinese Glioma Genome Atlas (CGGA) (bottom) cohorts. The patients were group into high TAMo (with TAMo score >1.65) and low TAMo (TAMo score <1.65) in both cohorts. p values were calculated by log-rank test. (B) Heatmap of TAMo marker and EGFR gene expression in IDH-wildtype GBM samples in TCGA cohort. The patients were ranked by TAMo score, and the subtype and genetic alterations were marked on top of the heatmap. (C) Comparison of TAMo score in patients of different transcriptome subtypes. p value was calculated by Wilcoxon rank-sum test. (D–F) Comparisons of the fractions of patients of different transcriptome subtypes (D), NF1 (E), and EGFR alteration status (F) in the high-TAMo versus low-TAMo groups. p values were calculated by two-tailed Fisher’s exact test. (G) Comparison of TAMo score in EGFR-wildtype and EGFR-altered patients with different PTEN mutation status. p value was calculated by Wilcoxon rank-sum test. (H and I) Gene set enrichment analysis of ERBB signaling pathway (H) and JAK/STAT3 signaling (I) between GBM patients in high-TAMo versus in low-TAMo groups. (J) Spearman's correlation coefficient (SCC) and p values between phosphorylated EGFR, phosphorylated STAT3 and TAMo score in IDH-wildtype EGFR-wildtype GB patients in the CPTAC dataset. Abbreviations: CL, classical subtype; FDR, false discovery rate; MES, mesenchymal subtype; N, neural subtype; PN, proneural subtype. See also Figure S3.
Figure 4
Figure 4
TAMo was associated with mesenchymal transformation (A) Characterization of the mesenchymal (MES) transformation process in longitudinal GB patients. From top to bottom: description of longitudinal dataset with paired initial and recurrent GB samples from the same patient; rank of MES markers (maroon) and other genes (gray) in initial and recurrent GB, with ranks of the same gene in different samples connected by lines; change of rank (ΔRank) of MES markers (maroon) and other genes (gray) in recurrent versus initial sample; enrichment score (ES), normalized enrichment (NES) and p value of MES markers by single sample Gene Set Enrichment Analysis (ssGSEA) analysis of the gene expression rank-change between initial and recurrent sample. (B) The correlation between MES transformation and TAMo infiltration during recurrence (top) and number of patients in each category (bottom). Pearson’s correlation coefficient (PCC) and p value between MES transformation score (SMES) and TAMo infiltration score (STAMo) are shown. (C) Comparison of MES transformation score in patients with increased TAMo infiltration versus with no TAMo increase. p value was calculated by Wilcoxon rank-sum test. (D) MRIs of the multicentric glioma patient P673 before surgery. The location of the right-brain tumor (T-R) and left-brain tumor (T-L) of the patient were labeled. (E) The enrichment score of the four glioma transcriptome subtypes inferred from the bulk RNA-seq data of the T-R (left) and T-L (right) samples of patient P673. The asterisks mark the significant subtypes (p < 0.05) in the sample. (F) Analysis of changes in the four transcriptome subtypes based on gene expression rank-change between T-R and T-L. The NES and p-value of mesenchymal signature was shown. (G) Representative markers of different tumor and non-tumor clusters identified in scRNA-seq data of patient P673. The dot color and size represented the mean expression and the fraction of cells expressing the markers. (H) The t-SNE plot of cells identified from scRNA-seq of the T-R and T-L samples of patient P673. The tumor and non-tumor clusters were outlined to ease visualization and comparison. (I) Fold-change in the fraction of each cell type in T-R versus in T-L. (J) Gene Set Enrichment Analysis (GSEA) analysis of JAK/STAT3 signaling pathways in tumor cells from T-R versus T-L. (K) The evolution of T-L and T-R tumor in patient P673. The oncogenic mutations and significant transcriptome subtypes of the two tumor were indicated in the plot. See also Figure S4.
Figure 5
Figure 5
TF activity analysis reveals FOSL2 as a regulator of TAMo (A) Heatmap of TF activity inferred by SCENIC. Each row represented the regulon of one TF, and each column represented one monocyte or MDM profiled by 10X. The cell subcluster and tissue of origin were marked on top of the heatmap. (B) The rank of feature importance scores of all TFs that potentially regulate EREG (top) and AREG expression (bottom). The dot size correlated with the importance of each TF, and the color represented whether the TF was over-expressed in GBM-infiltrating monocytes. (C) The presence of FOSL2-binding peaks and motifs located near EREG (left) and AREG (right) genes. The data was obtained from ENCODE data portal. (D and E) Expression levels of EREG and AREG in THP-1 monocyte cell line under FOSL2 over-expression (OE) (D) and knock-down (KD) (E) quantified by RT-PCR. ∗∗∗p < 0.001, ∗∗∗∗p < 0.0001 by two-sided unpaired t-test. (F) Boxplot of TAMo score across different anatomical regions in IvyGBM dataset. p values were calculated by Wilcoxon rank-sum test and between the highest group versus other samples. (G) Spatial distribution of Mono/Macro markers (CD14, ITGAM), FOSL2, TAMo score, and mesenchymal score across different histological regions in two IDH-wildtype GB patients. Abbreviations: PNZ, perinecrotic zone; PAN, pseudo-palisading cells around necrosis; MVP, microvascular proliferation; HBV, hyperplastic blood vessels; CT, cellular tumor; IT, infiltrating tumor; LE, leading edge. See also Figure S5.
Figure 6
Figure 6
TAMo promotes glioma invasion via the FOSL2-EREG/AREG-EGFR axis (A) Representative images of GB U251 cell in trans-well invasion assay under different treatment conditions. Scale bar, 100 μm. Abbreviations: CM, conditioned medium; EGFRi, EGFR inhibitor gefitinib. (B) Quantification of U251 invasiveness in the trans-well invasion assay. Data were presented as mean ± SD (n = 3 biological replicates). p values were calculated by two-sided unpaired t-test. ∗p < 0.05, ∗∗p < 0.01, ∗∗∗p < 0.001, ∗∗∗∗p < 0.0001. (C) Quantification of mesenchymal markers including CD44 and TGFBI in U251 cells under different treatment conditions using RT-PCR assay (n = 4 biological replicates). (D) Representative images of GB U251 cell spheroid invasion 24 h after embedding in extracellular matrix with and without AREG and EREG treatment. From left to right: contour of the core (black lines) and invading protrusion of spheroids (green lines); raw images of spheroids, with the yellow squares representing the regions selected and zoomed in; zoomed view of spheroids, with white lines indicating the boundary between spheroid core and invading protrusion. Scale bar, 100 μm. (E) Quantification of GB cell invasion from spheroids. Ratio of invasion area represents the ratio of the protrusion area over the core area of each spheroid (n = 2 biological replicates for control and n = 3 biological replicates for other groups). (F) Proposed model of glioma- and/or hypoxia-mediated monocyte reprogramming into TAMo, which acted through the FOSL2-EREG/AREG-EGFR signaling axis and promoted mesenchymal transformation in glioma cells. See also Figure S6.

Similar articles

Cited by

References

    1. Stupp R., Mason W.P., van den Bent M.J., Weller M., Fisher B., Taphoorn M.J.B., Belanger K., Brandes A.A., Marosi C., Bogdahn U., et al. Radiotherapy plus Concomitant and Adjuvant Temozolomide for Glioblastoma. N. Engl. J. Med. 2005;352:987–996. doi: 10.1056/NEJMoa043330. - DOI - PubMed
    1. Cloughesy T.F., Mochizuki A.Y., Orpilla J.R., Hugo W., Lee A.H., Davidson T.B., Wang A.C., Ellingson B.M., Rytlewski J.A., Sanders C.M., et al. Neoadjuvant anti-PD-1 immunotherapy promotes a survival benefit with intratumoral and systemic immune responses in recurrent glioblastoma. Nat. Med. 2019;25:477–486. doi: 10.1038/s41591-018-0337-7. - DOI - PMC - PubMed
    1. Keskin D.B., Anandappa A.J., Sun J., Tirosh I., Mathewson N.D., Li S., Oliveira G., Giobbie-Hurder A., Felt K., Gjini E., et al. Neoantigen vaccine generates intratumoral T cell responses in phase Ib glioblastoma trial. Nature. 2019;565:234–239. doi: 10.1038/s41586-018-0792-9. - DOI - PMC - PubMed
    1. McGranahan T., Therkelsen K.E., Ahmad S., Nagpal S. Current State of Immunotherapy for Treatment of Glioblastoma. Curr. Treat. Options Oncol. 2019;20:24. doi: 10.1007/s11864-019-0619-4. - DOI - PMC - PubMed
    1. De Groot J., Penas-Prado M., Alfaro-Munoz K., Hunter K., Pei B.L., O’Brien B., Weathers S.P., Loghin M., Kamiya Matsouka C., Yung W.K.A., et al. Window-of-opportunity clinical trial of pembrolizumab in patients with recurrent glioblastoma reveals predominance of immune-suppressive macrophages. Neuro Oncol. 2020;22:539–549. doi: 10.1093/neuonc/noz185. - DOI - PMC - PubMed

Publication types