. 2023 Oct 10;56(10):2325-2341.e15.
doi: 10.1016/j.immuni.2023.08.002. Epub 2023 Aug 30.

Mural cell-derived chemokines provide a protective niche to safeguard vascular macrophages and limit chronic inflammation

Affiliations

Mural cell-derived chemokines provide a protective niche to safeguard vascular macrophages and limit chronic inflammation

Kami Pekayvaz et al. Immunity. .

Abstract

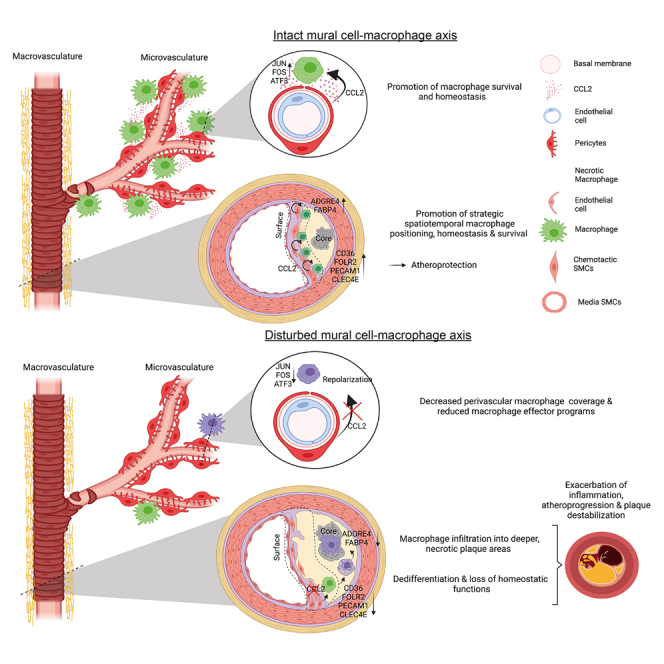
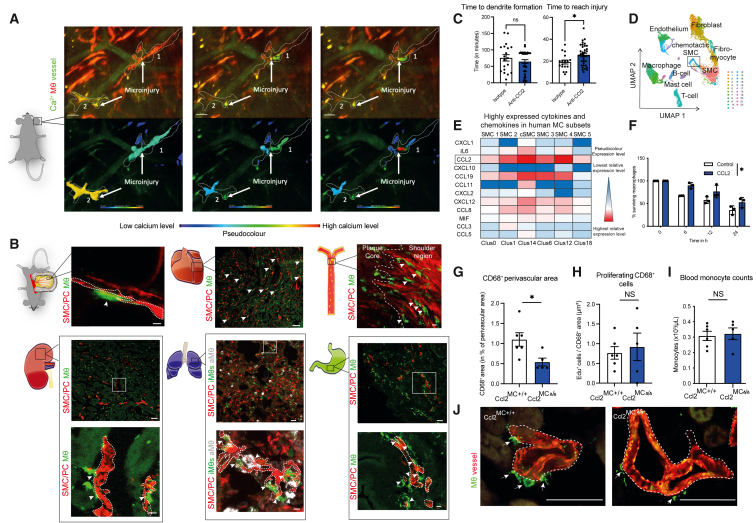
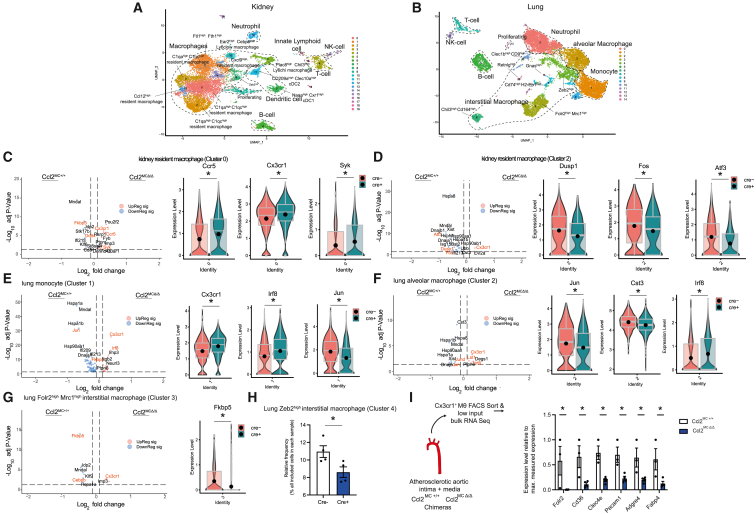
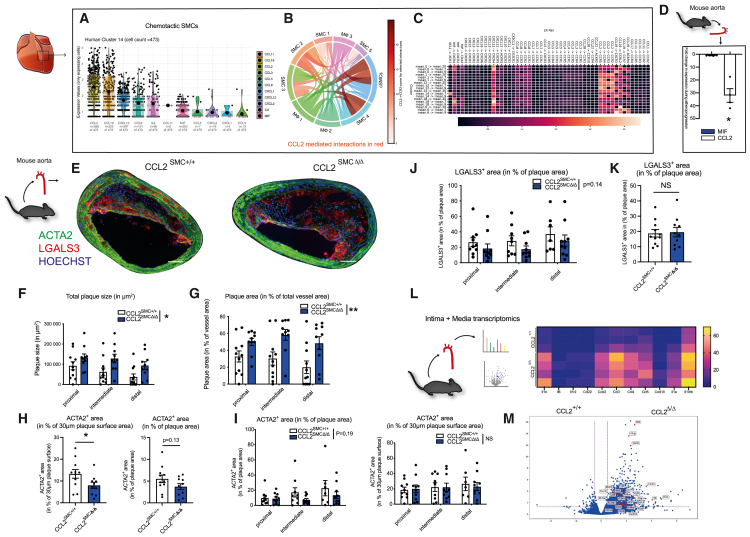
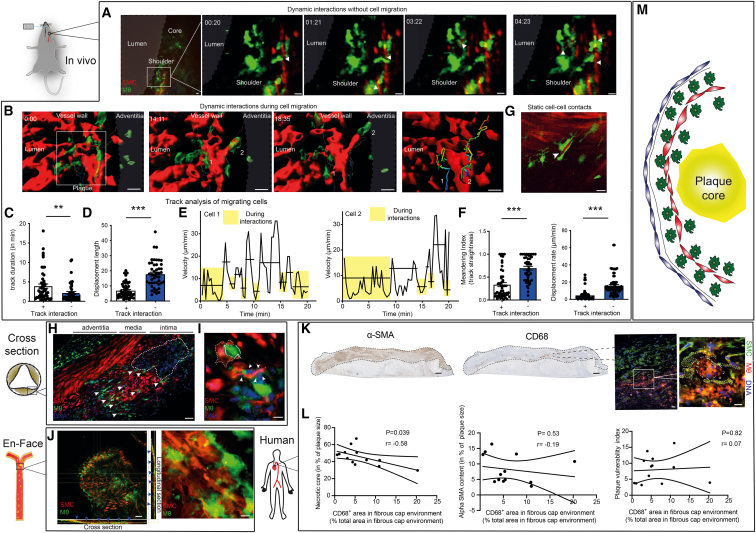
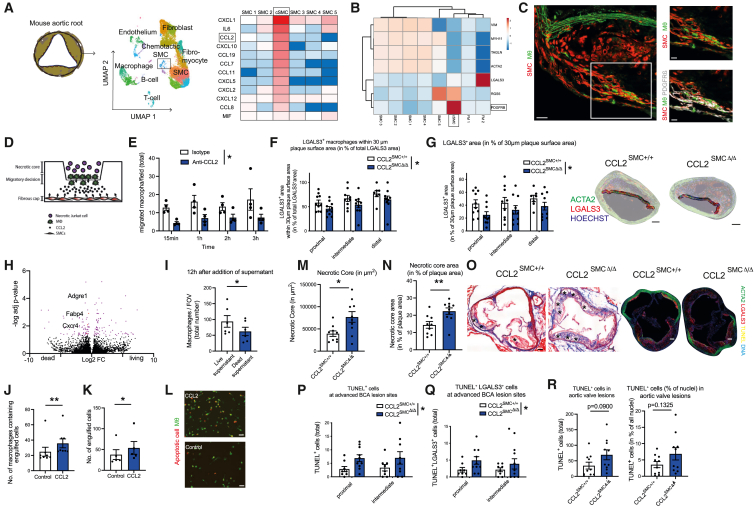
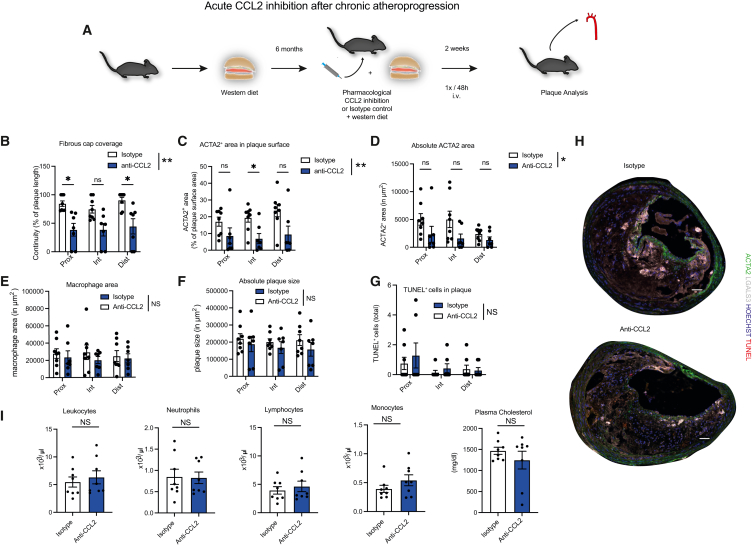
Maladaptive, non-resolving inflammation contributes to chronic inflammatory diseases such as atherosclerosis. Because macrophages remove necrotic cells, defective macrophage programs can promote chronic inflammation with persistent tissue injury. Here, we investigated the mechanisms sustaining vascular macrophages. Intravital imaging revealed a spatiotemporal macrophage niche across vascular beds alongside mural cells (MCs)-pericytes and smooth muscle cells. Single-cell transcriptomics, co-culture, and genetic deletion experiments revealed MC-derived expression of the chemokines CCL2 and MIF, which actively preserved macrophage survival and their homeostatic functions. In atherosclerosis, this positioned macrophages in viable plaque areas, away from the necrotic core, and maintained a homeostatic macrophage phenotype. Disruption of this MC-macrophage unit via MC-specific deletion of these chemokines triggered detrimental macrophage relocalizing, exacerbated plaque necrosis, inflammation, and atheroprogression. In line, CCL2 inhibition at advanced stages of atherosclerosis showed detrimental effects. This work presents a MC-driven safeguard toward maintaining the homeostatic vascular macrophage niche.

Keywords: CCL2; MIF; atherosclerosis; chemokines; chronic inflammation; macrophages; mural cells; pericytes; smooth muscle cells; vascular macrophages.


Conflict of interest statement

Declaration of interests P.L. is an unpaid consultant to, or involved in clinical trials for Amgen, AstraZeneca, Baim Institute, Beren Therapeutics, Esperion Therapeutics, Genentech, Kancera, Kowa Pharmaceuticals, Medimmune, Merck, Moderna, Norvo Nordisk, Novartis, Pfizer, and Sanofi-Regeneron. P.L. is a member of the scientific advisory board for Amgen, Caristo Diagnostics, Cartesian Therapeutics, CSL Behring, DalCor Pharmaceuticals, Eulicid Bioimaging, Kancera, Kowa Pharmaceuticals, Olatec Therapeutics, Medimmune, Novartis, Dewpoint, Plaque Tec, PlaqueTec, TenSixteen Bio, Soley Thereapeutics, and XBiotech, Inc. P.L.'s laboratory has received research funding in the last 2 years from Novartis, Novo Nordisk, and Genentech. P.L. is on the Board of Directors of XBiotech, Inc. P.L. has a financial interest in Xbiotech (a company developing therapeutic human antibodies), in TenSixteen Bio (a company targeting somatic mosaicism and clonal hematopoiesis of indeterminate potential [CHIP] to discover and develop novel therapeutics to treat age-related diseases), and in Soley Therapeutics (a biotechnology company that is combining artificial intelligence with molecular and cellular response detection for discovering and developing new drugs, currently focusing on cancer therapeutics). P.L.'s interests were reviewed and are managed by Brigham and Women’s Hospital and Mass General Brigham in accordance with their conflict-of-interest policies.

Figures

None
Graphical abstract
Figure 1
Figure 1
Mural cells sustain a vascular MΦ niche (A) In vivo multi-photon imaging of Ca2+ signal and morphological changes of MΦs in Cx3cr1-MΦCa-rep mice in an environment of laser-induced microinjuries. MΦs are depicted in red; Ca2+ signal and vascular flow are depicted in green. MΦs have been rendered additionally below, with a pseudocolored depiction of the Ca2+ signal. Images are derived from Video S1. (B) In vivo and ex vivo confocal and airy-scan imaging of MC-MΦ contacts across organs in MCRFP-rep; Cx3cr1-MΦGFP-rep mice, arrows depicting cell-cell contacts: top left: intravital imaging of the microvasculature in the mesentery, the dashed line is depicting MCs (scale bars, 5 μm); top middle: ex vivo imaging of the heart microvasculature (scale bars, 50 μm); top right: en face ex vivo imaging of the aortic atherosclerotic intima after 3 months of western-diet feeding (macrovasculature), the dashed line is subdividing the plaque core from the shoulder region (scale bars, 10 μm); bottom left: ex vivo imaging of the kidney microvasculature (scale bars, 50 μm), including higher magnification below (dashed line depicting MCs) (scale bars, 7 μm); bottom middle: ex vivo imaging of the lung microvasculature (scale bars, 20 μm), including higher magnification below (Cx3cr1hi CD68lo interstitial MΦs (iMΦs) in green, CD68hi Cx3cr1lo alveolar MΦs (aMΦs) in white, MCs in red) (dashed line depicting MCs) (scale bars, 5 μm); bottom right: ex vivo imaging of the stomach microvasculature (scale bars, 50 μm), including higher magnification below (dashed line depicting MCs) (scale bars, 10 μm). Interstitial MΦs are shown in green, and MCs are shown in red for all organs, with further subdifferentiation of MΦs in the lung (as depicted above). (C) Analysis of the time until MΦs form their first dendrites (left) and time which MΦs require to reach injury (right), as the time in minutes after laser injury, in MΦGFP-rep mice treated locally (subcutaneously) and systemically with isotype or CCL2-neutralizing antibody (n = 17–37 individual cells analyzed from 3 to –4 mice/group). (D) Reanalyzed single-cell RNA-seq data from human coronary arteries from Wirka et al., GEO: GSE131780. Uniform Manifold Approximation and Projection (UMAP) based dimensionality reduction of analyzed cells. (E) Highly expressed cytokines and chemokines in human SMCs from coronary arteries analyzed from cells shown in (D) CCL2 is highlighted as the most prominently expressed chemokine. (F) Percentage of peritoneal macrophage survival upon CCL2 stimulation at different time points under starvation stress conditions (n = 3 experiments). (G) Quantification of CD68+ perivascular macrophage content in Ccl2MC+/+ and Ccl2MCΔ/Δ mice in percentage of total perivascular area (15 μm radius around the vessel) in the kidney (n = 5–6 mice/group). (H) Quantification of cell proliferation as EdU+ cells relative to CD68+ area (as number of proliferating cells/μm2). (I) Quantification of blood monocyte counts by automated blood counter (n = 5–6). (J) Representative images from immunofluorescence staining of kidney sections in Ccl2MCΔ/Δ and Ccl2MC+/+ mice for ACTA2 (red), CD68 (green). Scale bars, 50 μm (left: Ccl2MC+/+; right: Ccl2MCΔ/Δ). (C, G, H, and I) Student’s t test was used. (F) Repeated measures two-way ANOVA was -808990139890500used. p < 0.05. Bar graphs show mean with SEM.
Figure 2
Figure 2
MC-derived CCL2 sustains a homeostatic MΦ phenotype across the vascular tree (A and B) UMAP based dimensionality reduction of single-cell RNA-seq of FACS-sort enriched CD45+ CD11bhi CD64hi F4/80hi cells in kidney (A) and lung (B) of Ccl2MCΔ/Δ and Ccl2MC+/+ mice (n = 4/group). (C–G) Volcano and violin plots depicting selected significantly differentially regulated genes in (C) kidney resident MΦ cluster 2, (D) kidney resident MΦ cluster 0, (E) lung monocyte cluster 1, (F) lung alveolar MΦ cluster 2, (G) lung Folr2hi Mrc1hi interstitial MΦ cluster 3. (H) Frequency of lung Zeb2hi interstitial MΦ cluster 4 cells among all analyzed cells. (I) Significantly differentially regulated genes, associated with a functionally differentiated, efferocytotic MΦ phenotype in Ccl2MC+/+ and Ccl2MCΔ/Δ chimera mice. Low-input RNA-seq of FACS-sorted Cx3cr1+ MΦs from Ccl2MC+/+ or Ccl2MCΔ/Δ chimera mice with MCRFP-ep; Cx3cr1-MΦGFP-rep bone marrow after 20 weeks western diet (experimental setup further depicted in Figure S3) (n = 3–4 chimera mice). Student’s t test was used. Expression levels of depicted genes normalized to sample with highest expression (set as 1) across all samples. Bar graphs show mean with SEM. Violin plots with matching boxplot and mean expression. p < 0.05.
Figure 3
Figure 3
Distinct chemotactic SMCs express high levels of MΦ chemoattractants, ameliorating atheroprogression (A–C) Reanalyzed single-cell RNA-seq data from human coronary arteries from Wirka et al., GEO: GSE131780. (A) Violin plots (calculated on all cells expressing detectable baseline levels of the respective gene) of highly expressed cytokines and chemokines in chemotactic SMCs. Dots represent single cells, only cells exhibiting detectable expression of the particular gene are included (B) interactome depicting cell-cell interactions between MΦ and SMC subsets, prominent SMC → MΦ interactions are depicted in red. Intensity of red color depicts the respective portion of the CCL2-CCR2 axis for the concrete interaction (the darker the red color, the more the CCL2-CCR2 axis accounts for the respective inter-cluster interplay among all detected chemokine-receptor interactions). (C) Heatmap further unraveling SMC → MΦ chemokine:chemokine-receptor interactions. Blue box depicts interactions of chemotactic SMC subset, red box depicts CCL2-mediated interactions between SMC and MΦ subsets. (D) Ccl2 and Mif expression in Ng2+ SMCs FACS-sorted from western-diet fed atherosclerotic MCRFP-rep mice compared to chow-diet fed non-atherosclerotic control mice. n = 3–4 mice per group. (E) Representative images of BCA sections from Ccl2SMC +/+ and Ccl2SMCΔ/Δ littermates after 14 weeks of western diet stained for ACTA2 (green), LGALS3 (red), and Hoechst (blue). Scale bars, 100 μm. (F and G) Morphometric analysis of plaque size (F) and vascular remodeling (G) from BCA sections at three consecutive locations from Ccl2SMC +/+ (n = 11) and Ccl2SMCΔ/Δ (n = 10) littermates. (H and I) Quantification of ACTA2+ smooth muscle cell content as ACTA2+ area in percentage of total plaque area and percentage of 30 μm plaque surface area in valves (H) and in the BCA at three consecutive locations (I). (H and I) n = 10–11 mice per group. (J and K) Analysis of intimal LGALS3+ area as percentage of plaque size in BCA sections at three consecutive locations (J) and in plaques from aortic valves (K) (n = 10–11 each). (L) Schematic illustration of media and intima processing from aortae of Ccl2SMC+/+ and Ccl2SMCΔ/Δ littermates after 14 weeks of western diet (left). Heatmap displaying expression of differentially regulated genes in bulk RNA-seq of Ccl2SMC+/+ mice (n = 3) and Ccl2SMCΔ/Δ mice (n = 4). Rows represent individual replicates, differentially expressed genes are illustrated in columns (right). (M) Volcano plots of intima/media RNA-seq showing differentially expressed genes in Ccl2SMC+/+ mice (n = 3) and Ccl2SMCΔ/Δ mice (n = 4), x-axis depicts Log2FC, y-axis depicts -Log10(adj. p-value). Data are shown as mean and SEM. (H and K), Student’s t test was used. (F, G, I, and J) Repeated measures two-way ANOVA or mixed-effects model was used. p < 0.05; NS, not significant. Bar graphs show mean with SEM. Violin plots with matching boxplot and mean expression.
Figure 4
Figure 4
SMCs exert chemotactic cues on plaque MΦs (A–F) In vivo imaging of an atherosclerotic lesions within the carotid artery in atherosclerotic MCRFP-rep; Lyz-MΦGFP-rep mice after 14 weeks western diet by multi-photon microscopy. (A) Time-series with a focus on the shoulder region of the plaque, arrows depicting locally confined but dynamic protrusions formed by Lyz+ MΦs (green) toward SMCs (red). Images from Video S3. Scale bars, 20 μm. (B) In vivo imaging of Lyz+ MΦ-SMC contacts during Lyz+ MΦ migration within the intima. Rendered illustration of Lyz+ MΦs (green) migrating along SMCs (red), including exemplary migration tracks of 2 cells. Scale bars, 20 μm. (C) Analysis of the duration of the interactions between SMCs (red) and Lyz+ MΦs (green). (D) Analysis of the displacement length during interaction and during free migration. (E) Velocity profile of cells 1 and 2 (labeled in the migration tracks above under B) over time: boxes indicate interactions; horizontal lines indicate mean velocity of the time period included. (F) Left: meandering index (track straightness) of Lyz+ MΦs during interaction with SMCs and during free migration without interaction. Right: displacement rate of Lyz+ MΦs during interaction with SMCs and during free migration without interaction with SMCs. (C–F) n = 46–52 cell tracks covering free migration (−) or subsequent SMC interaction (+) or vice versa from n = 3 mice, Mann-Whitney test used to compare groups, ∗∗∗p < 0.001, ∗∗p < 0.001. (G) In vivo imaging of static SMC-Cx3cr1+ MΦ contacts in a MCRPF-rep; Cx3cr1-MΦGFP-rep mouse, arrow depicting a SMC embedded in two Cx3cr1+ MΦs. Scale bars, 20 μm. (H) Ex vivo confocal imaging of cross-sections of atherosclerotic valves in MCRFP-rep; Cx3cr1-MΦGFP-rep mice after 12 weeks western diet, MΦs in green, SMCs in red, nuclei in blue, arrowheads depicting SMC-MΦ contacts. Scale bars, 40 μm. (I and J) Ex vivo confocal imaging of SMClin; Cx3cr1-MΦGFP-rep mice after 22–24 weeks of western diet, (I) atherosclerotic valve cross-sections, MΦs in green, SMC and SMC-progeny in red, nuclei in blue, arrowheads depicting SMC-MΦ contacts, dashed line outlining SMC enveloping MΦ. Scale bars, 10 μm. (J) En face confocal z stacks of the atherosclerotic intima in SMC-tdTlin; Cx3cr1-MΦGFP-rep mouse, Cx3cr1+ MΦs in green, SMClin cells in red, blue arrowheads pointing toward SMC-MΦ contacts observable in the cross- and longitudinal-sections of the z stack, most frequent within the plaque surface. Scale bars, 50 μm (left), 5 μm (right) (K), left: representative immunohistochemical images of human aortic plaques stained for CD68 and α-SMA, scale bars, 300 μm, right: immunofluorescence staining for CD68 (red) and α-SMA (green) and with Hoechst (blue), dashed lines represent macrophage and SMCs, scale bars, 20 μm on the left and 10 μm on the right immunofluorescence image. (L) Pearson correlation of the relative CD68+ area in fibrous cap environment (defined as the plaque area within the top 30% plaque surface) with, left: the relative necrotic core size, middle: the α-SMA content and right: the plaque vulnerability index (further elaborated in methods). Intermediate (n = 5) and advanced (n = 8) human plaques, graded accordingly by the pathology department, were included. Pearson r and two-tailed p value are included for every Pearson correlation. (M) Summary illustration of the natural MΦ distribution within atherosclerotic lesions. MΦs mainly localize at areas of the plaque surface adjacent to SMCs in murine and in human atherosclerotic lesions. Bar graphs show mean with SEM.
Figure 5
Figure 5
SMCs within the fibrous cap preserve a strategic positioning of plaque MΦs and secure homeostatic MΦ functions (A and B) Reanalyzed single-cell RNA-seq data from mouse aortic roots from atherosclerotic SMClin mice from Wirka et al., GEO: GSE131780. (A) UMAP based dimensionality reduction of analyzed cells (left), heatmap illustrating cytokine and chemokine expression of different SMC subsets (right). (B) Marker genes of SMC clusters illustrated in a heatmap, composed by ClustVis. (C) Representative confocal image depicting the spatial distribution of the key cSMC marker PDGFRβ within an atherosclerotic valve in SMClin; Cx3cr1-MΦGFP-rep mice after 22–24 weeks of western diet, SMClin cells in red, MΦs in green, and PDGFRβ in white. Scale bars: 30 μm (left) and 15 μm (right images). (D) Illustration of the experimental setup of the migration assay: macrophages undergo a migratory decision either moving toward the artificially composed SMC-rich fibrous cap below or residing at the artificially composed, necrotic cell rich, necrotic core. SMCs (representing the fibrous cap) are located in the lower chamber, whereas peritoneal macrophages have been attached on the transwell of the upper chamber. Necrotic Jurkat cells (representing the necrotic core) have been added to the upper chamber. (E) Number of peritoneal MΦs from Lyz-MΦGFP-rep mice that transmigrated toward the lower chamber per field of view (FOV). Isotype or anti-CCL2 blocking antibody was simultaneously added to the lower chamber. MΦ numbers per FOV counted at 4 subsequent time points (n = 4 independent experiments). (F) Distribution of macrophages as percentage of LGALS3+ area in 30 μm plaque surface area in percentage of total plaque LGALS3+ area at three subsequent locations (n = 10 each). (G) Left: quantification of LGALS3+ surface macrophage content as relative LGALS3+ area in percentage of total plaque surface area (defined as the upper 30 μm of the plaque) from BCA sections at three consecutive locations (n = 10 each). Right: representative immunofluorescent images of BCA sections for ACTA2 (green), LGALS3 (red), and Hoechst (blue) with highlighted 30 μm plaque surface area from Ccl2SMC+/+ and Ccl2SMCΔ/Δ littermates after 14 weeks of western-diet feeding. Scale bars, 100 μm. (H) Volcano plot depicting differentially regulated genes analyzed by RNA-seq of FACS-sort enriched peritoneal MΦs, coincubated either with live or dead Jurkat cell supernatant for 12 h. (I) Quantification of peritoneal macrophages 12 h after addition of live or dead Jurkat cell supernatant (n = 6). (J–L) Efferocytosis assay, analyzing the efferocytotic capacity of the MΦ population, isolated from Lyz-MΦGFP-rep mice. Apoptotic Jurkat cells were added for 1 h after 6 h incubation either with or without CCL2. (J) Quantification of MΦs with engulfed apoptotic cells upon presence or absence of CCL2 (n = 5 independent experiments). (K) Quantification of the total number of engulfed apoptotic cells upon CCL2 presence of absence. (L) Representative epifluorescence images of the efferocytosis assay with peritoneal macrophages (green) and apoptotic Jurkat cells (red), 1 h after Jurkat cell addition. Scale bars, 50 μm. (M–O) Necrotic core analysis as total necrotic area in μm2 (M) and in percentage of plaque area (N), assessed with Masson Trichrom’s staining of valve sections, from Ccl2SMC+/+ (n = 9) and Ccl2SMCΔ/Δ (n = 10) littermates after 14 weeks of western diet. (O) Left: representative images of necrotic core content analyzed by Masson Trichrom’s staining of valve sections from Ccl2SMC+/+ and Ccl2SMCΔ/Δ littermates after 14 weeks of western diet. indicates necrotic areas. Scale bars, 100 μm. Right: representative images of immunofluorescence stainings of valve sections from Ccl2SMC+/+ and Ccl2SMCΔ/Δ littermates after 14 weeks of western diet for ACTA2 (green), LGALS3 (red), terminal deoxynucleotidyl transferase-mediated dUTP nick-end labeling (TUNEL) (yellow), and DAPI (blue). Scale bars, 100 μm. (P and Q) Quantification of cell apoptosis as total amount of TUNEL+ LGALS3+ Hoechst+ MΦs in plaque (P) and as total amount of TUNEL+ Hoechst+ apoptotic cells (Q) in Ccl2SMC+/+ (n = 9) and Ccl2SMCΔ/Δ (n = 10) individual littermates in total after 14 weeks of western diet, only including plaques at the proximal and intermediate BCA, without distal BCA areas with its early lesions. (R) Quantification of valve atherosclerotic plaques for (left) total and relative TUNEL+ cells. Data are shown as mean and SEM. (I, J, K, M, N, and R) Student’s t test was used for normally distributed data and Wilcoxon matched-pairs signed rank test for not normally distributed data. (E, F, G, P, and Q) Repeated measure two-way ANOVA or mixed-effects model was used. p < 0.05; ∗∗ p < 0.01; NS, not significant. Bar graphs show mean with SEM.
Figure 6
Figure 6
Short-term CCL2 inhibition in advanced atherosclerosis triggers detrimental changes in plaque phenotype (A) Acute pharmacological CCL2 inhibition in ApoE−/− mice after 6 months of western type diet. The anti-CCL2 or isotype control antibody was injected intravenous (i.v.) 2 weeks before sacrifice every 48 h (n = 7–8 / group). (B) Quantification of fibrous cap coverage as continuity (percentage of fibrous cap covered plaque surface length relative to complete plaque surface length) at three subsequent BCA locations. (C) Quantification of ACTA2+ area within plaque surface as % of plaque surface area (defined as the top 30 μm stripe of the lesion) at three subsequent BCA locations. (D) Quantification of absolute ACTA2+ area in μm2 at three subsequent BCA locations. (E) Quantification of macrophage area as LGALS3 area in μm2 at three subsequent BCA locations. (F) Quantification of total plaque size as absolute plaque area in μm2 at three subsequent BCA locations. (G) Quantification of cell apoptosis as total amount of TUNEL+ cells in plaque at three subsequent BCA locations. (H) Representative images of BCA sections from ApoE−/− mice after 6 months of western diet stained for ACTA2 (green), LGALS3 (far red), TUNEL (red), and Hoechst (blue). Scale bars, 50 μm. (I) Quantification of blood leukocytes, neutrophils, lymphocytes, monocytes, and plasma cholesterol (n = 7–8). (I) Student’s t test was used. (B–G) Repeated measures two-way ANOVA or mixed-effects model, with subsequent Šídák’s multiple comparisons test in (B)–(D), was used. p < 0.05; ∗∗p < 0.01 NS, not significant. Bar graphs show mean with SEM.

References

    1. Blériot C., Chakarov S., Ginhoux F. Determinants of resident tissue macrophage identity and function. Immunity. 2020;52:957–970. doi: 10.1016/j.immuni.2020.05.014. - DOI - PubMed
    1. Guilliams M., Thierry G.R., Bonnardel J., Bajenoff M. Establishment and maintenance of the macrophage niche. Immunity. 2020;52:434–451. doi: 10.1016/j.immuni.2020.02.015. - DOI - PubMed
    1. Park M.D., Silvin A., Ginhoux F., Merad M. Macrophages in health and disease. Cell. 2022;185:4259–4279. doi: 10.1016/j.cell.2022.10.007. - DOI - PMC - PubMed
    1. Koelwyn G.J., Corr E.M., Erbay E., Moore K.J. Regulation of macrophage immunometabolism in atherosclerosis. Nat. Immunol. 2018;19:526–537. doi: 10.1038/s41590-018-0113-3. - DOI - PMC - PubMed
    1. Wynn T.A., Vannella K.M. Macrophages in tissue repair, regeneration, and fibrosis. Immunity. 2016;44:450–462. doi: 10.1016/j.immuni.2016.02.015. - DOI - PMC - PubMed

Publication types