. 2023 Nov 13;228(Suppl 7):S635-S647.
doi: 10.1093/infdis/jiad374.

Clinical and Immunologic Correlates of Vasodilatory Shock Among Ebola Virus-Infected Nonhuman Primates in a Critical Care Model

Affiliations

Clinical and Immunologic Correlates of Vasodilatory Shock Among Ebola Virus-Infected Nonhuman Primates in a Critical Care Model

Sydney R Stein et al. J Infect Dis. .

Abstract

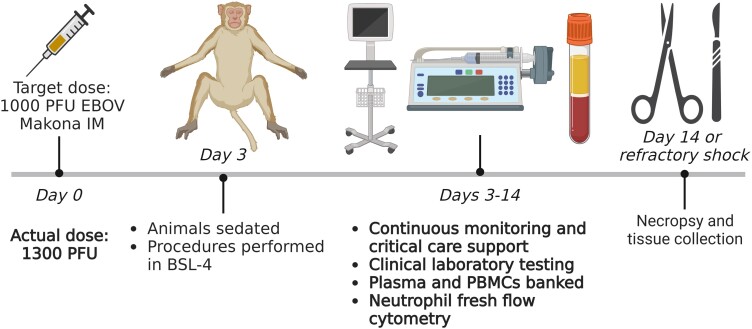
Background: Existing models of Ebola virus infection have not fully characterized the pathophysiology of shock in connection with daily virologic, clinical, and immunologic parameters. We implemented a nonhuman primate critical care model to investigate these associations.

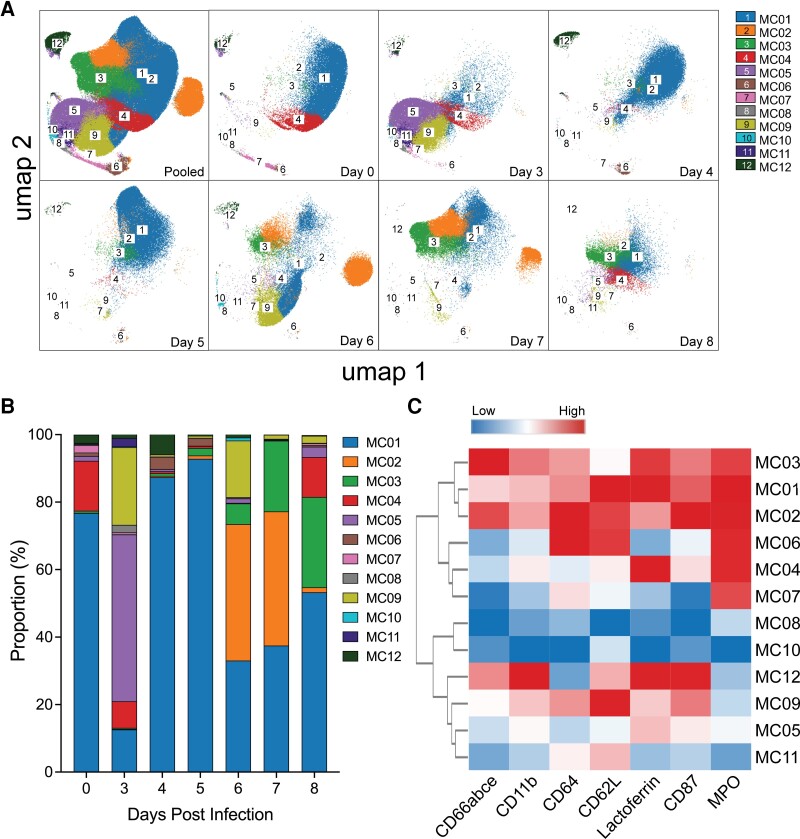
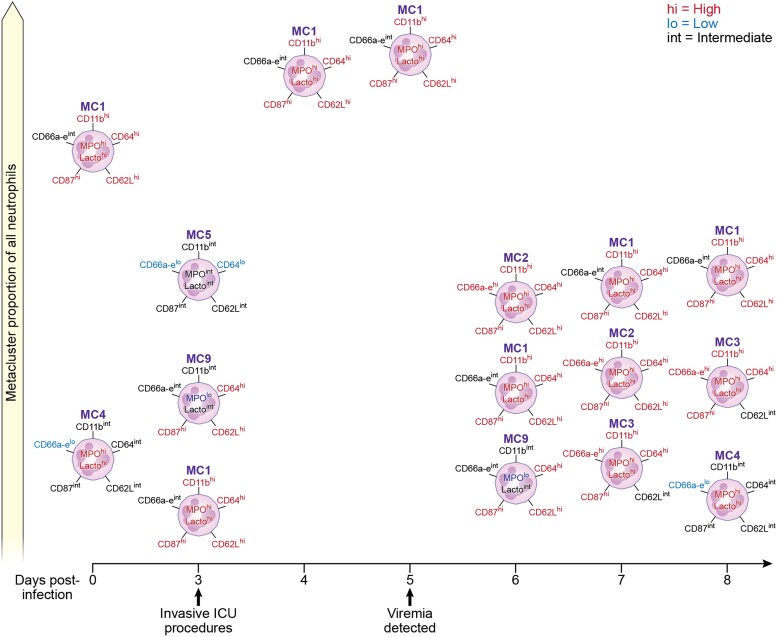
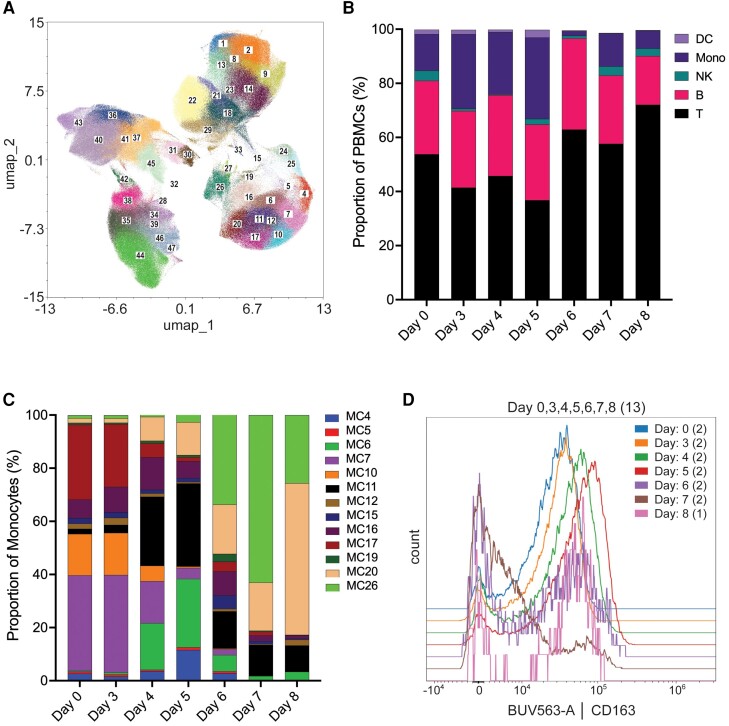
Methods: Two rhesus macaques received a target dose of 1000 plaque-forming units of Ebola virus intramuscularly with supportive care initiated on day 3. High-dimensional spectral cytometry was used to phenotype neutrophils and peripheral blood mononuclear cells daily.

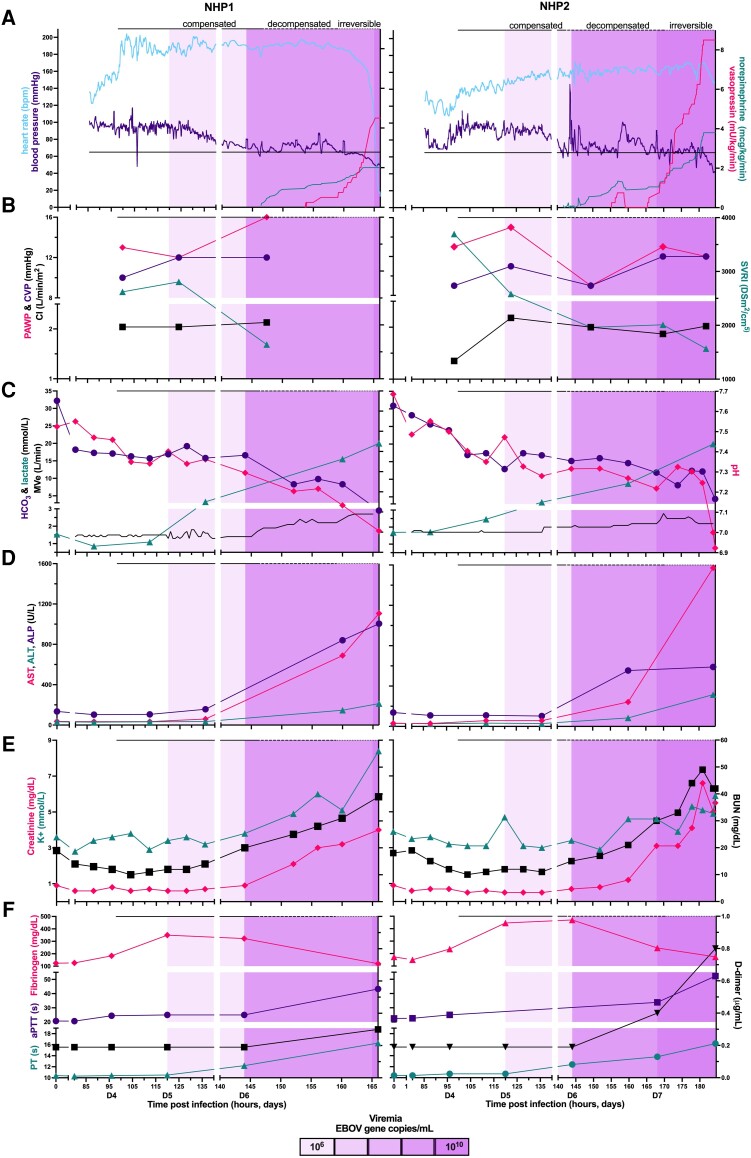
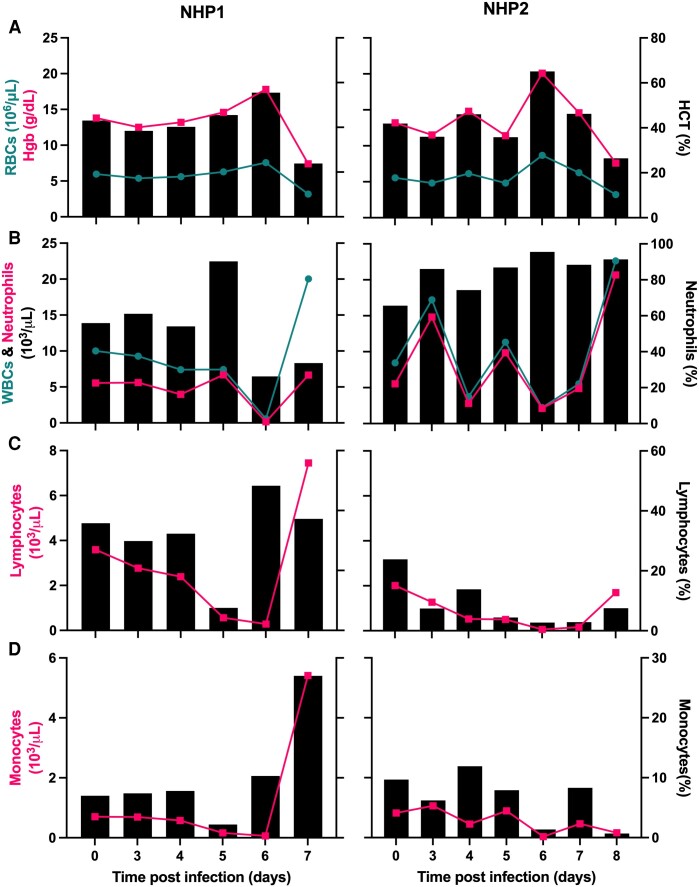
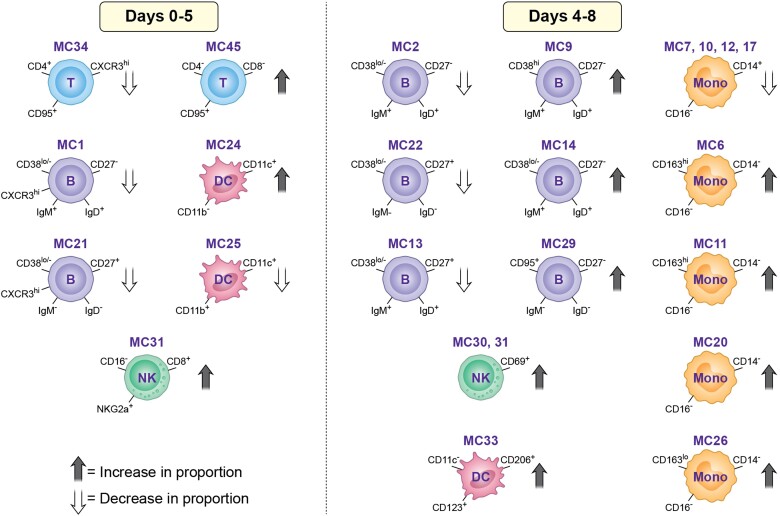
Results: We observed progressive vasodilatory shock with preserved cardiac function following viremia onset on day 5. Multiorgan dysfunction began on day 6 coincident with the nadir of circulating neutrophils. Consumptive coagulopathy and anemia occurred on days 7 to 8 along with irreversible shock, followed by death. The monocyte repertoire began shifting on day 4 with a decline in classical and expansion of double-negative monocytes. A selective loss of CXCR3-positive B and T cells, expansion of naive B cells, and activation of natural killer cells followed viremia onset.

Conclusions: Our model allows for high-fidelity characterization of the pathophysiology of acute Ebola virus infection with host innate and adaptive immune responses, which may advance host-targeted therapy design and evaluation for use after the onset of multiorgan failure.

Keywords: Ebola virus; filovirus; intensive care; nonhuman primate; pathogenesis.


Conflict of interest statement

Potential conflicts of interest. All authors: No reported conflicts. All authors have submitted the ICMJE Form for Disclosure of Potential Conflicts of Interest. Conflicts that the editors consider relevant to the content of the manuscript have been disclosed.

Figures

Figure 1.
Figure 1.
Critical care in acute Ebola virus infection model: study design and blood sampling. Created with BioRender.com. BSL-4, biosafety level 4; EBOV, Ebola virus (Zaire ebolavirus); IM, intramuscular; PBMC, peripheral blood mononuclear cell; PFU, plaque forming unit.
Figure 2.
Figure 2.
Clinical data for NHP1 (left; female) and NHP2 (right; male) overlaid with the quantification of EBOV viral load in plasma by quantitative reverse transcription–polymerase chain reaction and stage of shock: A, hemodynamic measures with vasopressor dosing administration; B, cardiovascular function; C, acid-base status; D, liver injury and dysfunction; E, renal dysfunction; F, coagulopathy. Blood pressure data depict mean arterial pressure measurements. ALP, alkaline phosphatase; ALT, alanine transaminase; aPTT, activated partial thromboplastin time; AST, aspartate transaminase; BUN, blood urea nitrogen; CI, cardiac index; CVP, central venous pressure; EBOV, Ebola virus (Zaire ebolavirus); MVe, exhaled minute volume; NHP, nonhuman primate; PAWP, pulmonary arterial wedge pressure; PT, prothrombin time; SVRI, systemic vascular resistance index.
Figure 3.
Figure 3.
Highlighted results from complete blood counts for NHP1 (left; female) and NHP2 (right; male) by study day: A, red blood cell count, hemoglobin concentration, and hematocrit; B, white blood cell count and neutrophil count and percentage; C, lymphocyte count and percentage; D, monocyte count and percentage. HCT, hematocrit; Hgb, hemoglobin; NHP, nonhuman primate; RBC, red blood cell; WBC, white blood cell.
Figure 4.
Figure 4.
Cell clustering showed that distinct populations of neutrophils emerge following an Ebola virus infection. A, UMAP of flow cytometry data colored by the FlowSOM MC assignment from pooled neutrophil samples and samples differentiated by day. In some plots, parts of MC2 were grouped with MC1 after UMAP dimensionality reduction. In those cases, the label for MC2 is located in the middle of the MC2 populations on the UMAP plot. B, The proportion of each MC by day as determined by FlowSOM. C, The corresponding heat map characterizing each MC by median surface marker expression. FlowSOM, flow cytometry–specific self-organizing map; MC, metacluster; MPO, myeloperoxidase; UMAP, uniform manifold approximation and projection.
Figure 5.
Figure 5.
Schematic of change in proportion of neutrophil MCs with the highest proportions (>10%) over time by day. Proportions are averages from both animals and are relative to total neutrophils measured in the animals. Proportions are best fit to represent the stacked bar graph in Figure 4B and to prevent overlapping of the MCs for clarity. Cell markers: hi = high expression; int = intermediate expression: lo = low expression. ICU, intensive care unit; MC, metacluster.
Figure 6.
Figure 6.
Flow cytometry results from 29-color spectral cytometry. A, UMAP projection of all MCs from all animals and time points. Each MC is labeled at its centroid. B, Proportion of total PBMCs by each major lineage per day. C, Proportion of total monocytes by each monocyte MC per day. D, Expression of CD163 in monocytes by day. DC, dendritic cell; MC, metacluster; NK, natural killer; PBMC, peripheral blood mononuclear cell; UMAP, uniform manifold approximation and projection.
Figure 7.
Figure 7.
Notable changes in PBMC MC proportions after EBOV infection. Notable changes in MC proportions after EBOV infection: in the first 5 days, left of the dotted line; from days 4 to 8, right of the dotted line. Cell MCs that increased in proportion, black arrows; cell MCs that decreased in proportion, white arrows. Proportions are relative to the total number of cells per type (eg, MC34 decreased as a proportion of total T cells). DC, dendritic cell; B, B cells; EBOV, Ebola virus; MC, metacluster; Mono, monocytes; NK, natural killer cells; PBMC, peripheral blood mononuclear cell; T, T cells.

Similar articles

Cited by

References

    1. Baseler L, Chertow DS, Johnson KM, Feldman H, Morens DM. The pathogenesis of Ebola virus disease. Annu Rev Pathol 2017; 12:387–418. - PubMed
    1. Centers for Disease Control and Prevention [. Accessed 15 May 2023.]. https://www.cdc.gov/vhf/Ebola/history/chronology.html . History of Ebola outbreaks.
    1. Mulangu S, Dodd LE, Davey RT, et al. . A randomized, controlled trial of Ebola virus disease therapeutics. N Engl J Med 2019; 381:2293–303. - PMC - PubMed
    1. Geisbert TW, Strong JE, Feldman H. Considerations in the use of nonhuman primate models of Ebola virus and Marburg virus infection. J Infect Dis 2015; 212:S91–7. - PMC - PubMed
    1. Kortepeter MG, Lawler JV, Honko A, et al. . Real-time monitoring of cardiovascular function in rhesus macaques infected with Zaire ebolavirus. J Infect Dis 2011; 204:S1000–10. - PubMed

Publication types

Grants and funding