. 2023 Dec;152(6):1550-1568.
doi: 10.1016/j.jaci.2023.07.021. Epub 2023 Aug 29.

IL-13-induced STAT3-dependent signaling networks regulate esophageal epithelial proliferation in eosinophilic esophagitis

Affiliations

IL-13-induced STAT3-dependent signaling networks regulate esophageal epithelial proliferation in eosinophilic esophagitis

Sahiti Marella et al. J Allergy Clin Immunol. 2023 Dec.

Abstract

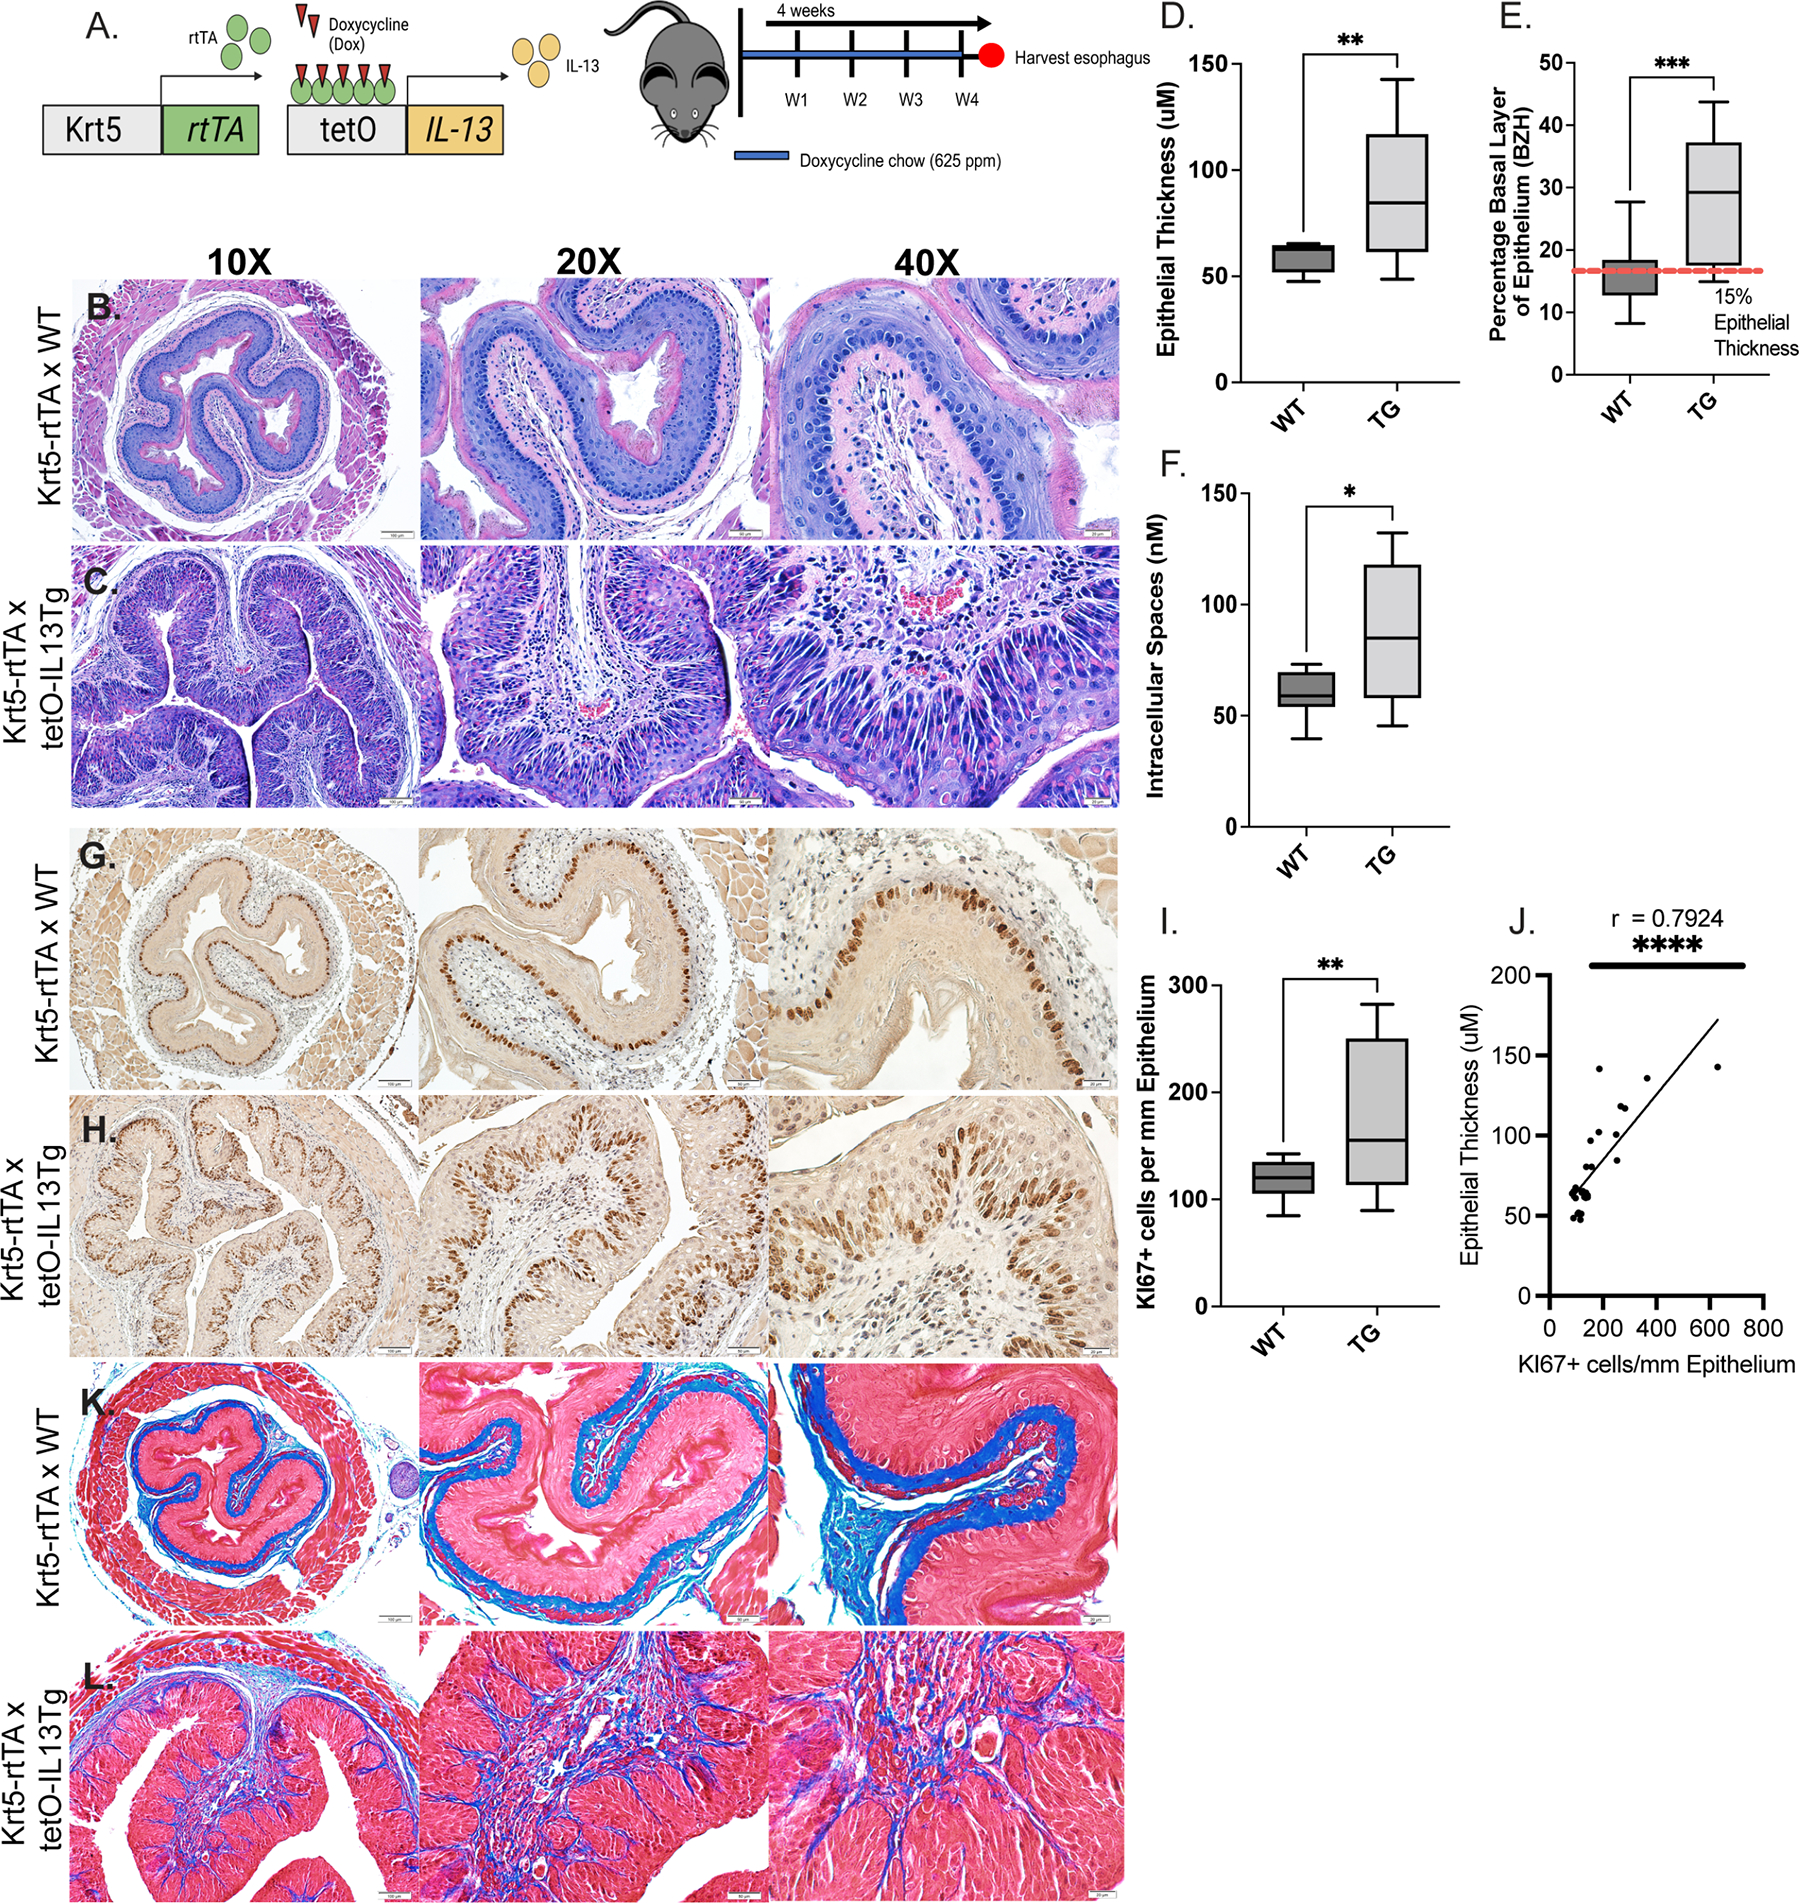
Background: Basal zone hyperplasia (BZH) and dilated intercellular spaces (DISs) are thought to contribute to the clinical manifestations of eosinophilic esophagitis (EoE); however, the molecular pathways that drive BZH remain largely unexplored.

Objective: We sought to define the role of IL-13-induced transcriptional programs in esophageal epithelial proliferation in EoE.

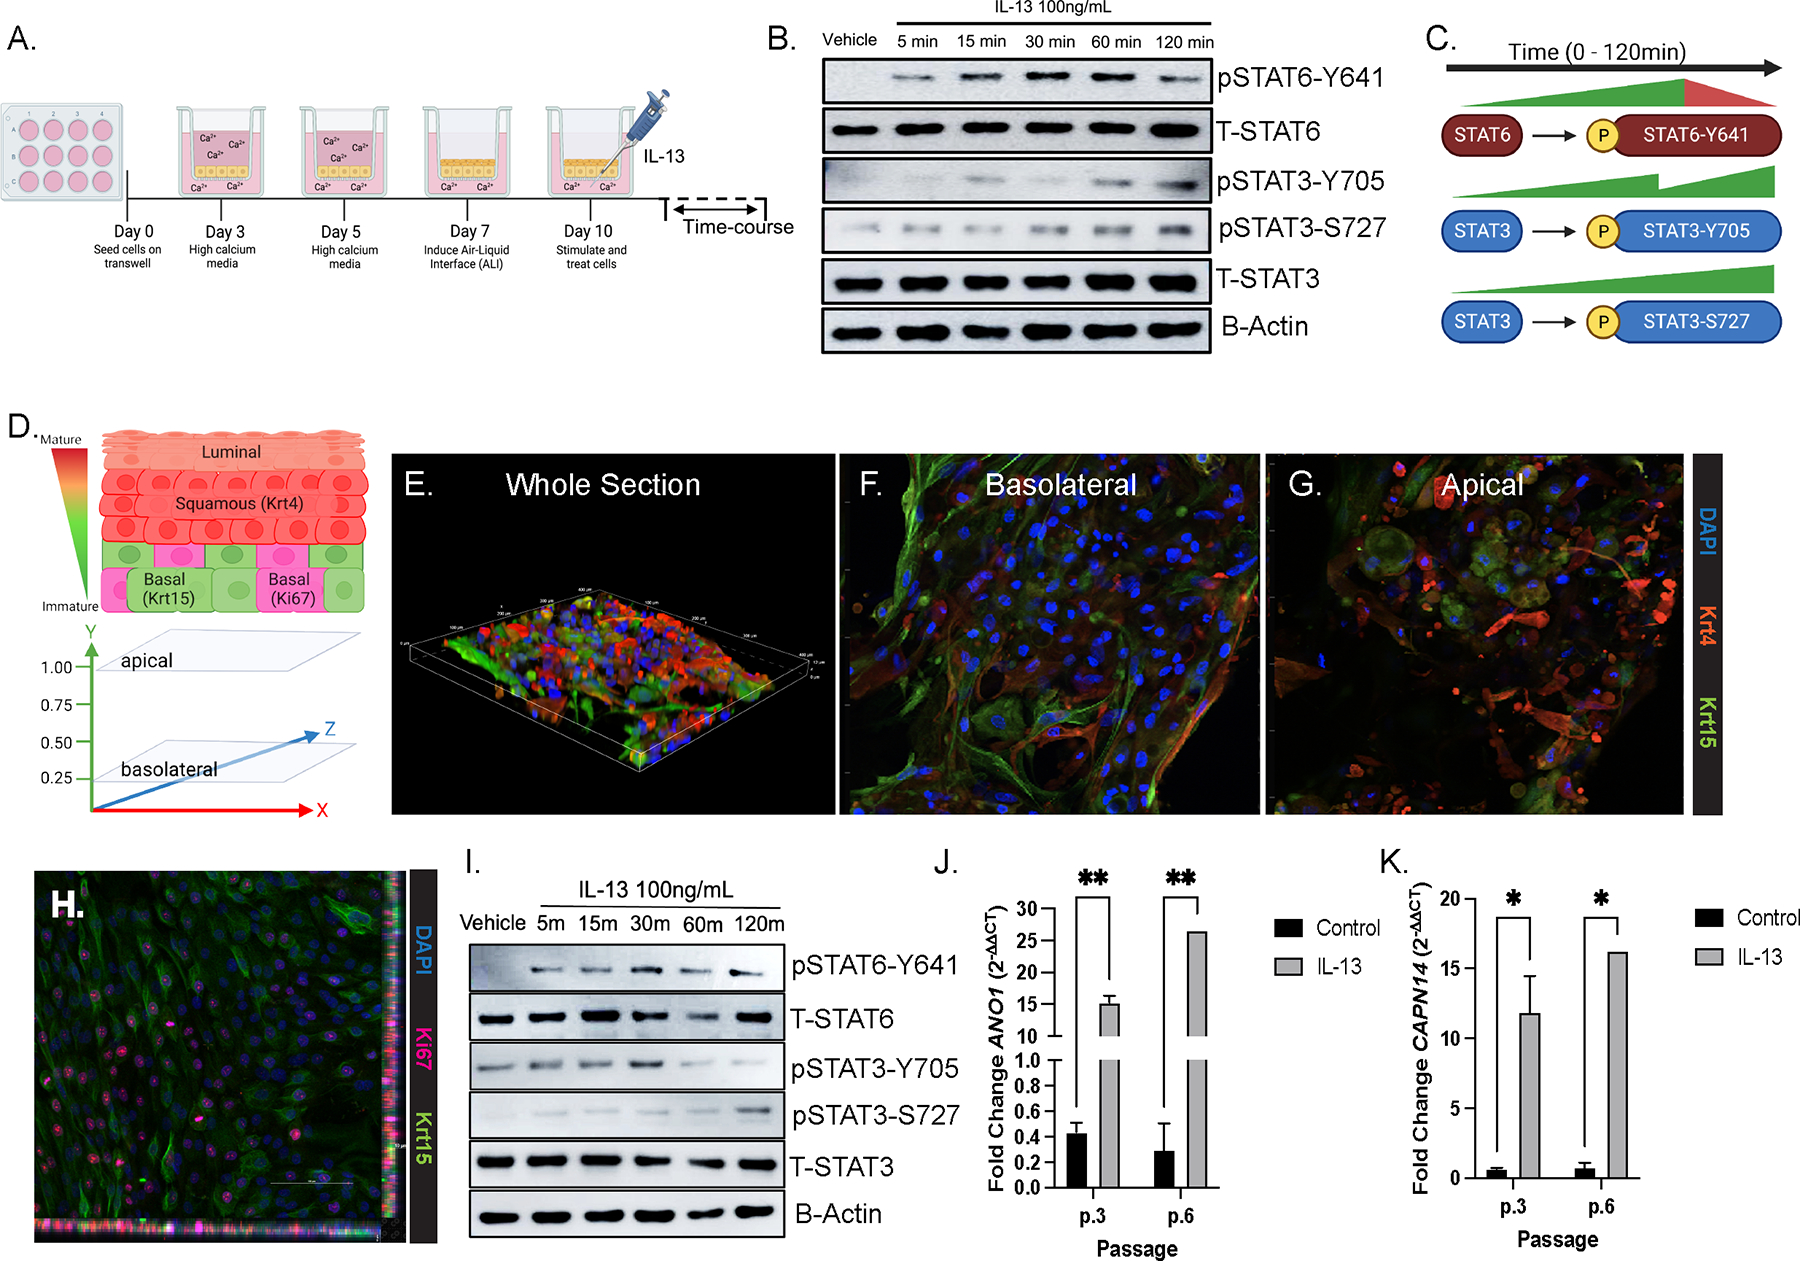
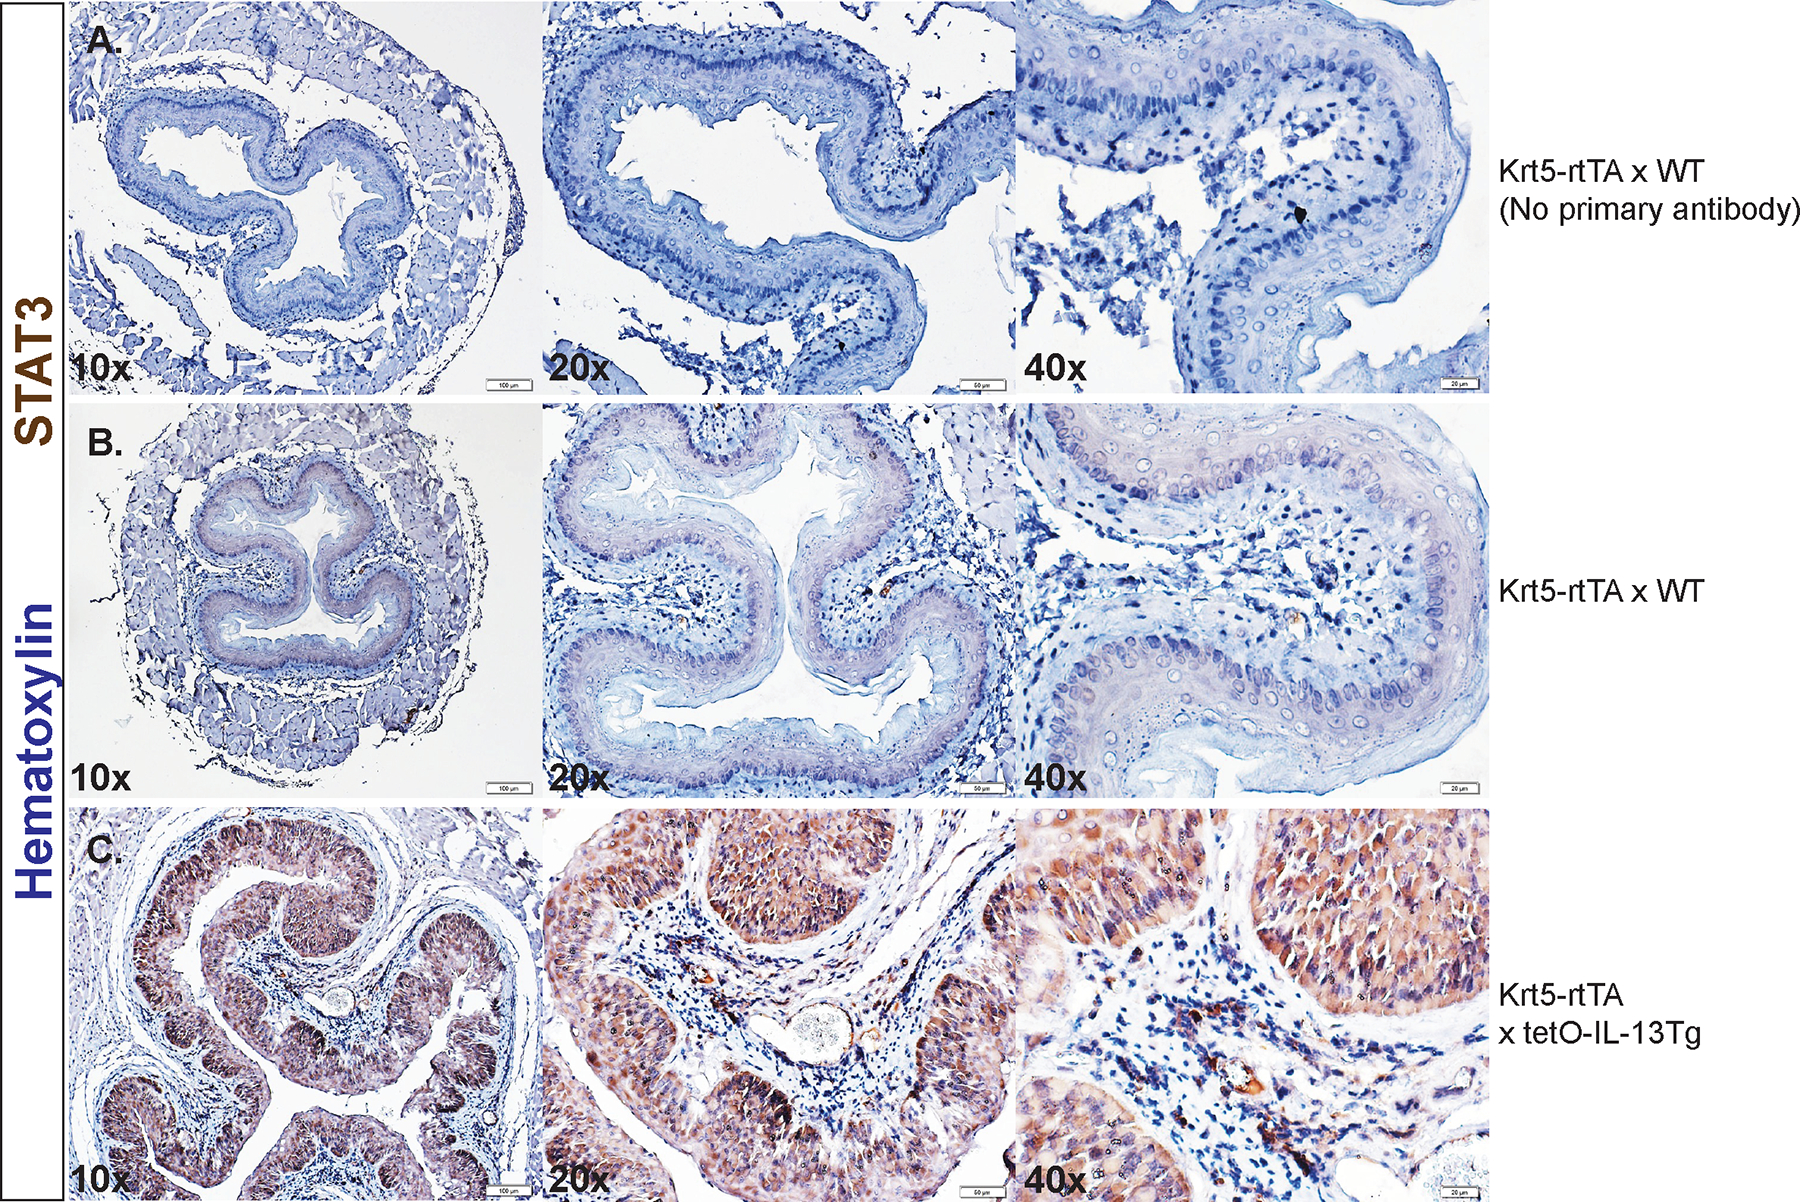
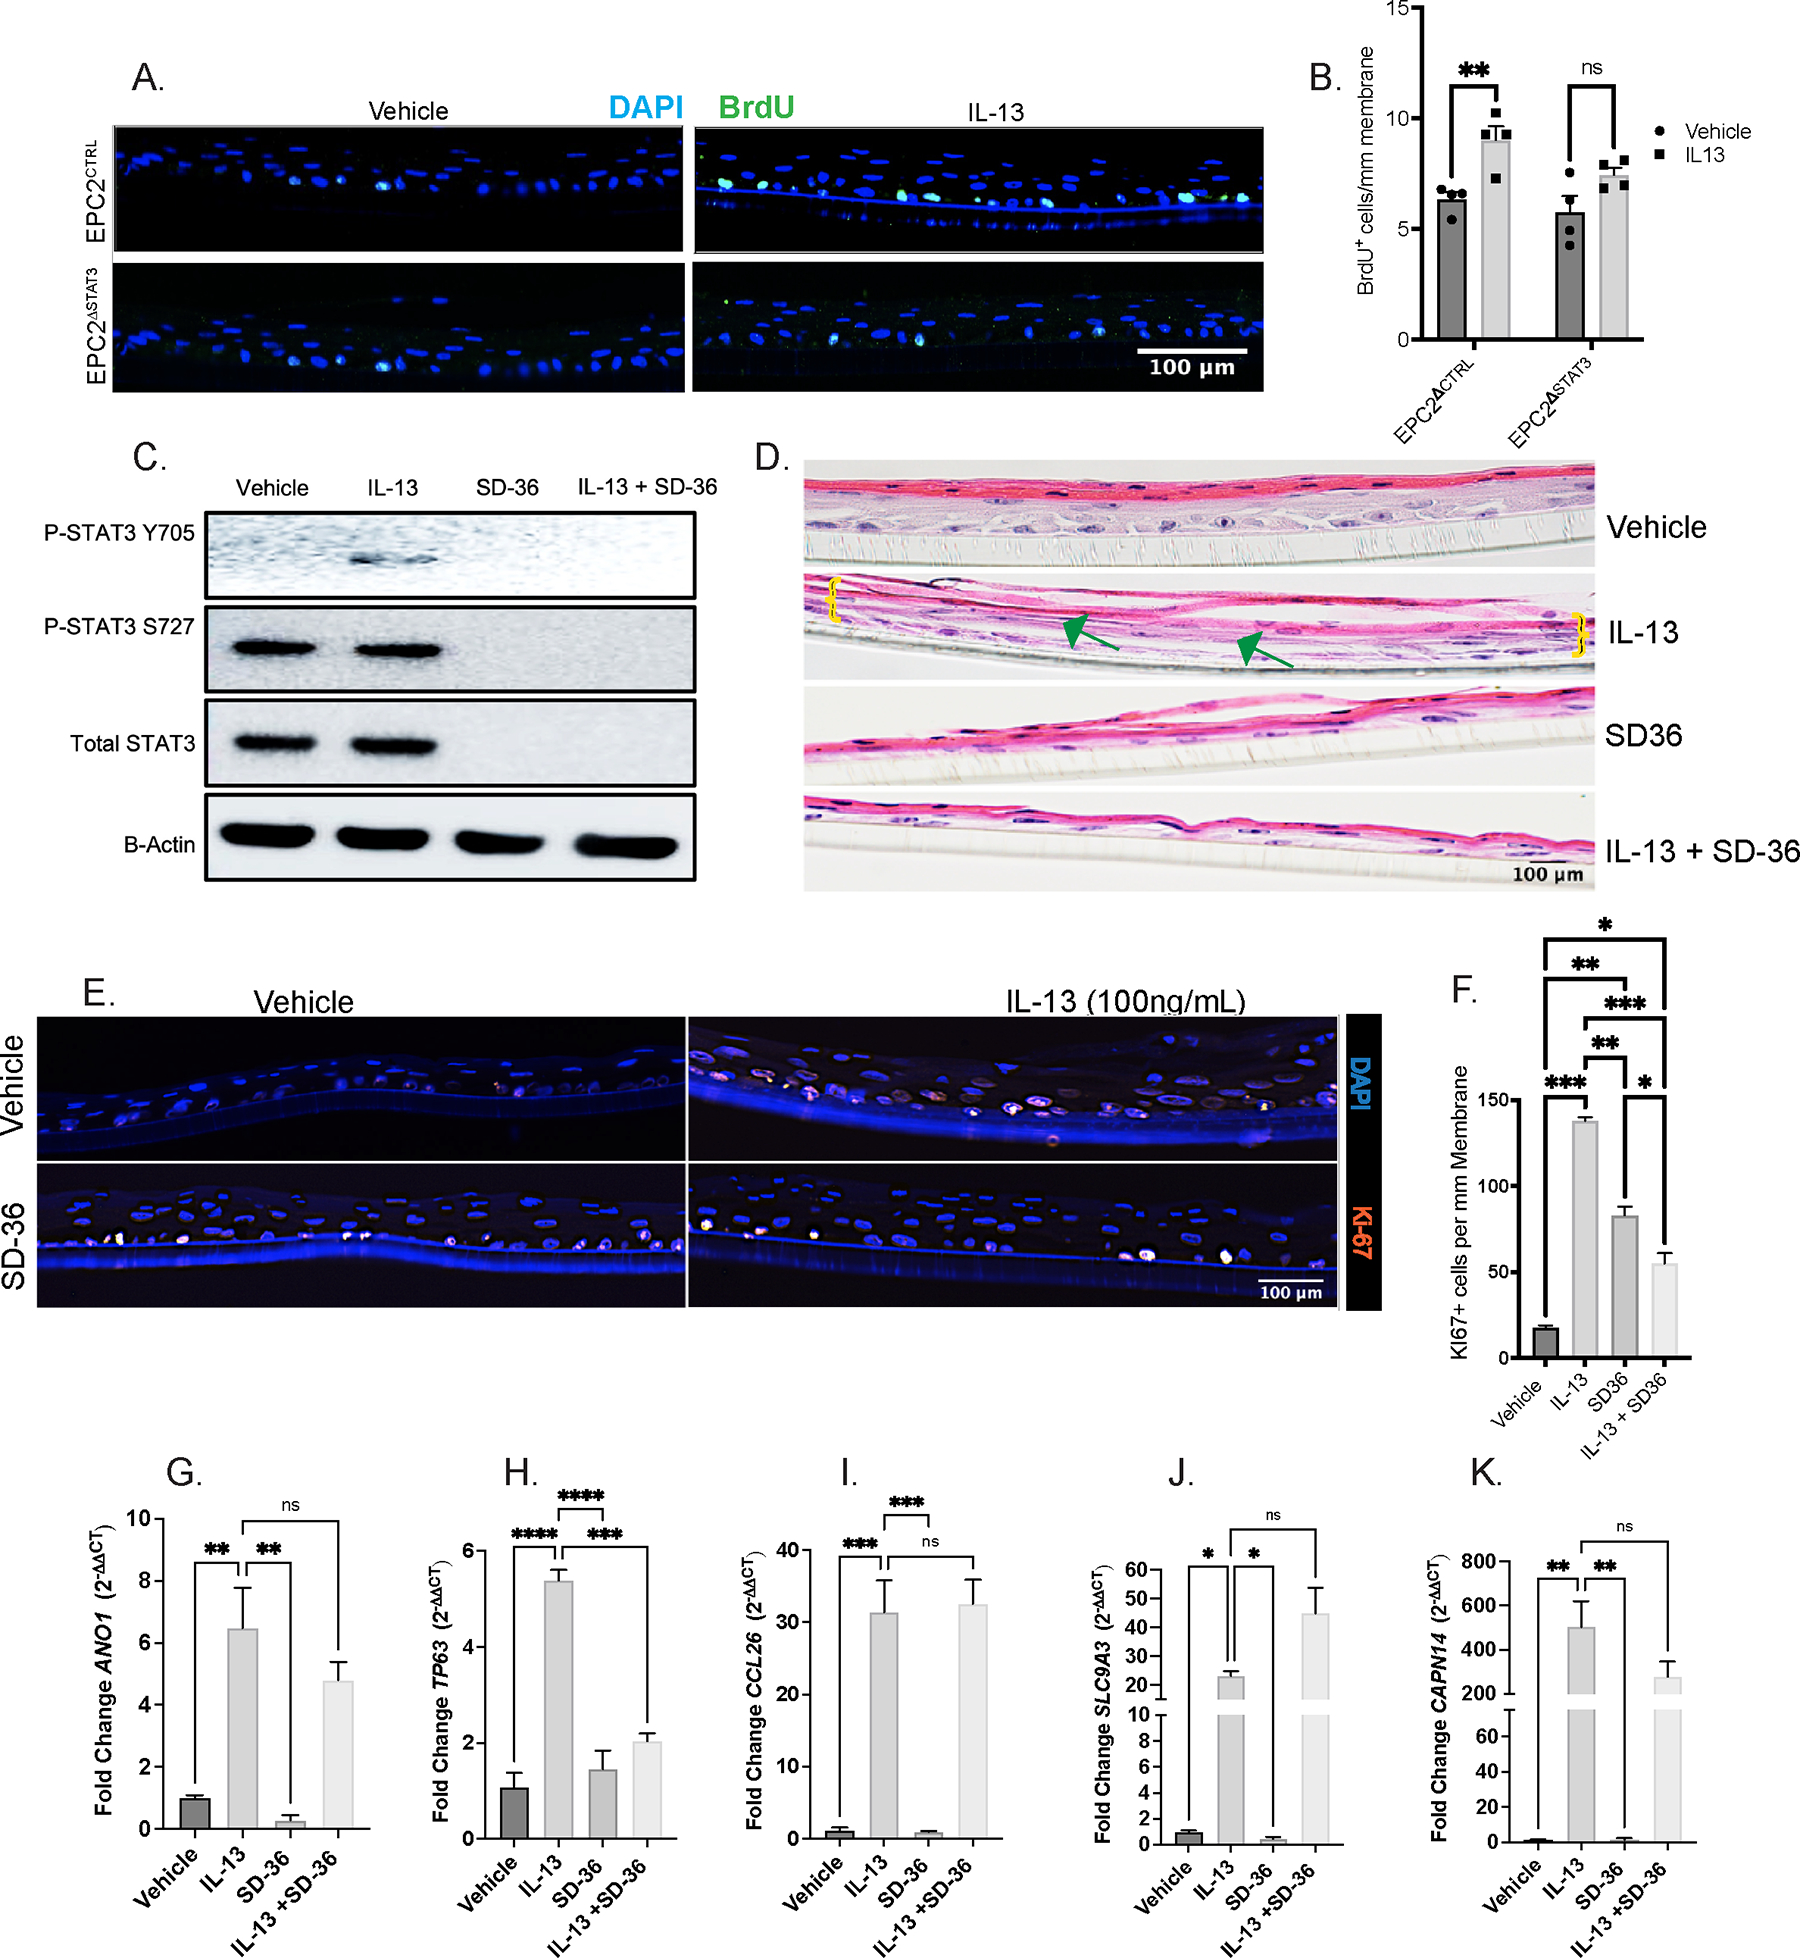
Methods: We performed RNA sequencing, bioinformatics, Western blot, reverse transcriptase quantitative PCR, and histologic analyses on esophageal biopsies from healthy control and patients with EoE, primary esophageal cells derived from patients with EoE, and IL-13-stimulated esophageal epithelial keratinocytes grown at the air-liquid interface (EPC2-ALI). Genetic (shRNA) and pharmacologic (proteolysis-targeting chimera degrader) approaches and in vivo model of IL-13-induced esophageal epithelial remodeling (Krt5-rtTA x tetO-IL-13Tg) were used to define the role of signal transducer and activator of transcription 3 (STAT3) and STAT6 and secreted frizzled-related protein 1 (SFRP1) in esophageal epithelial proliferation.

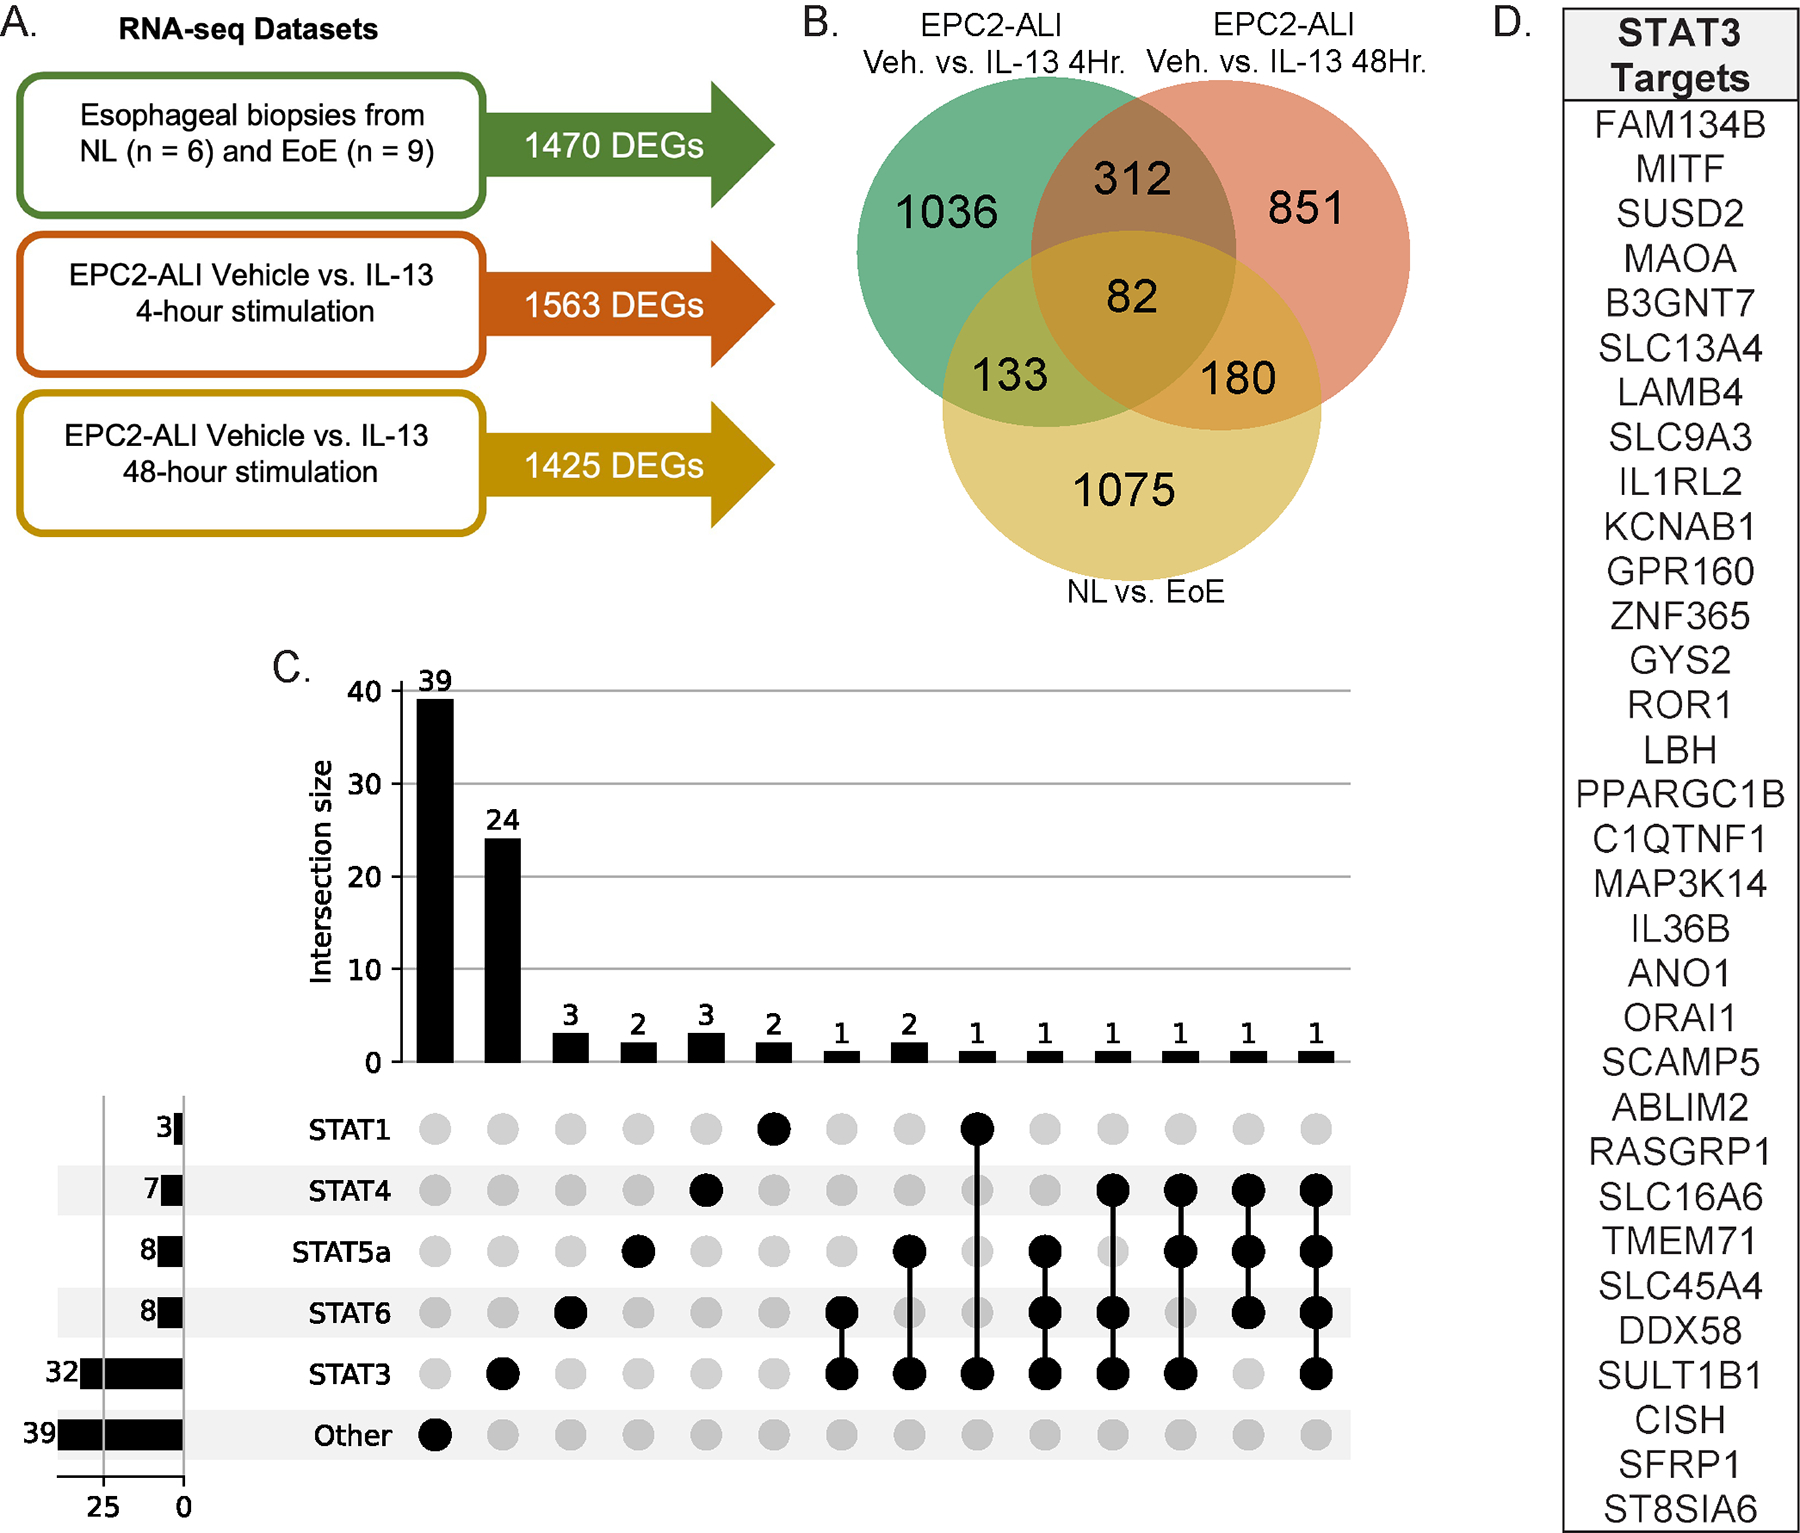
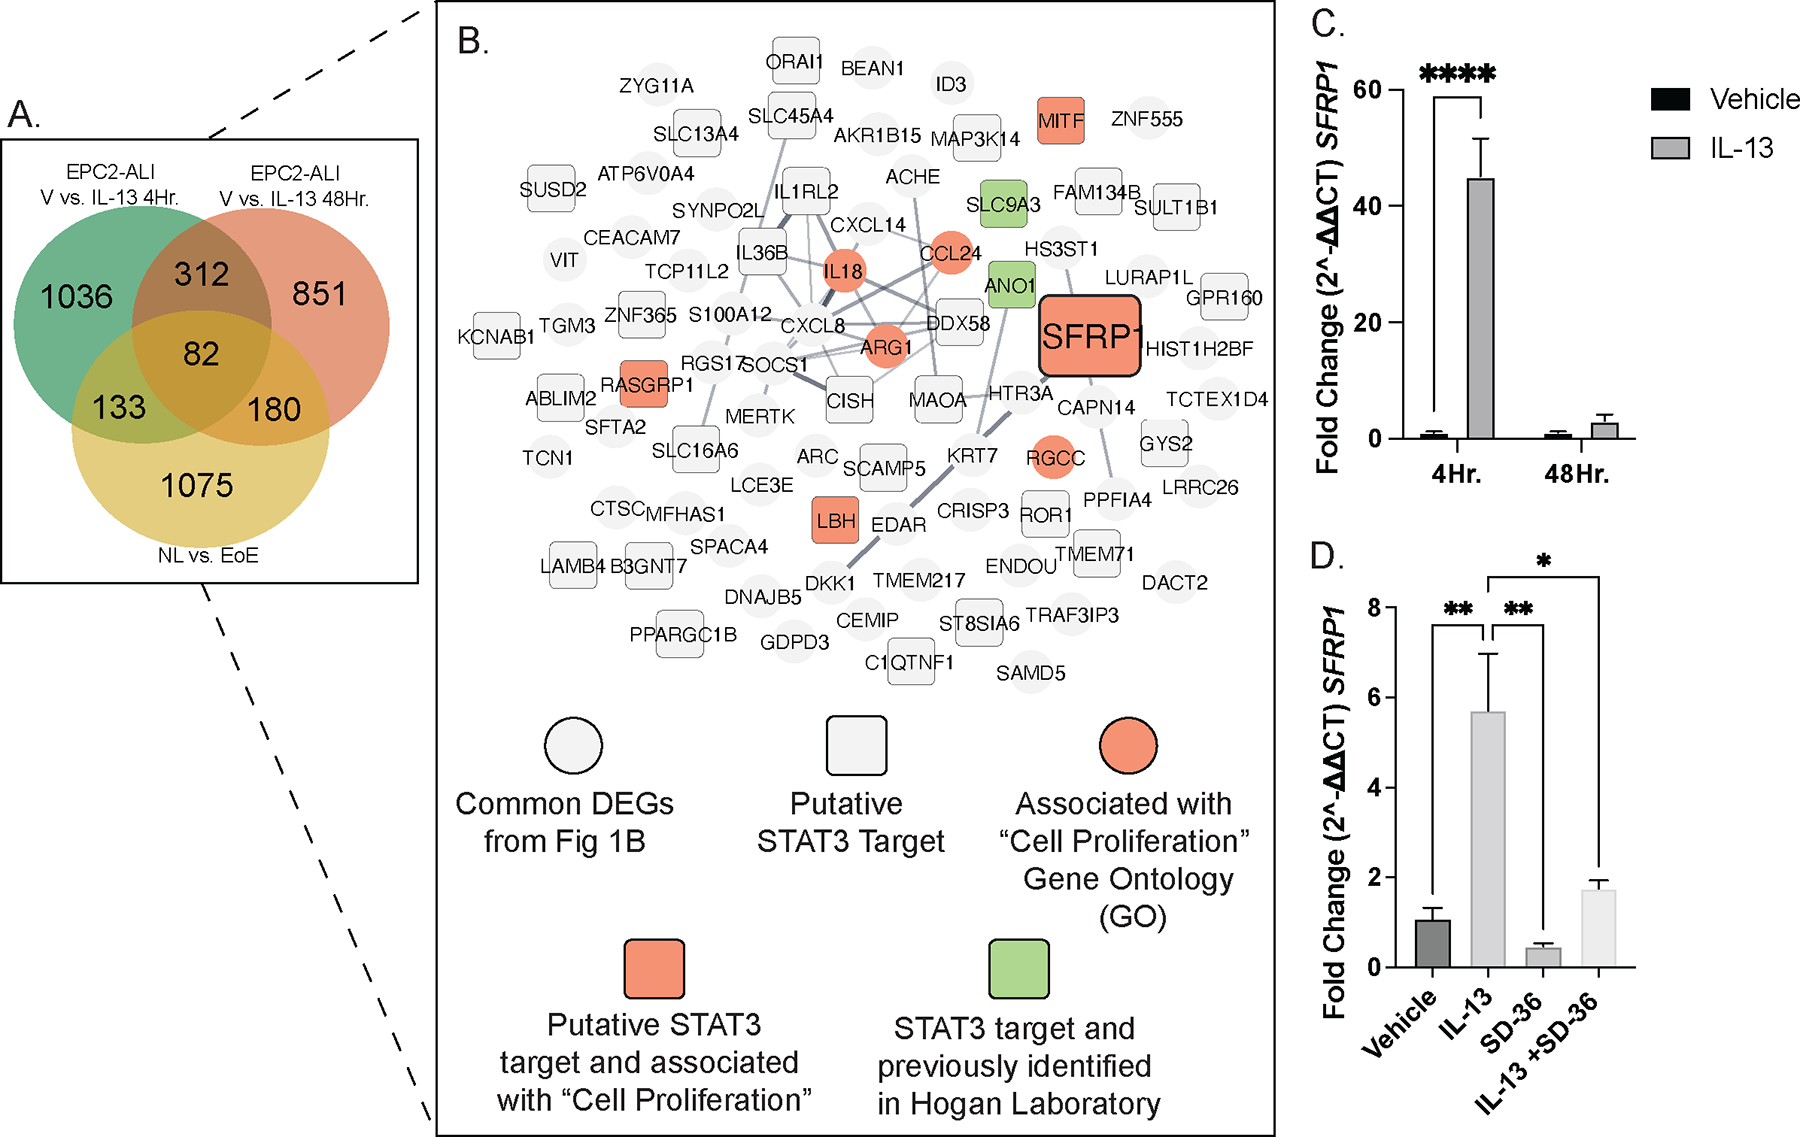
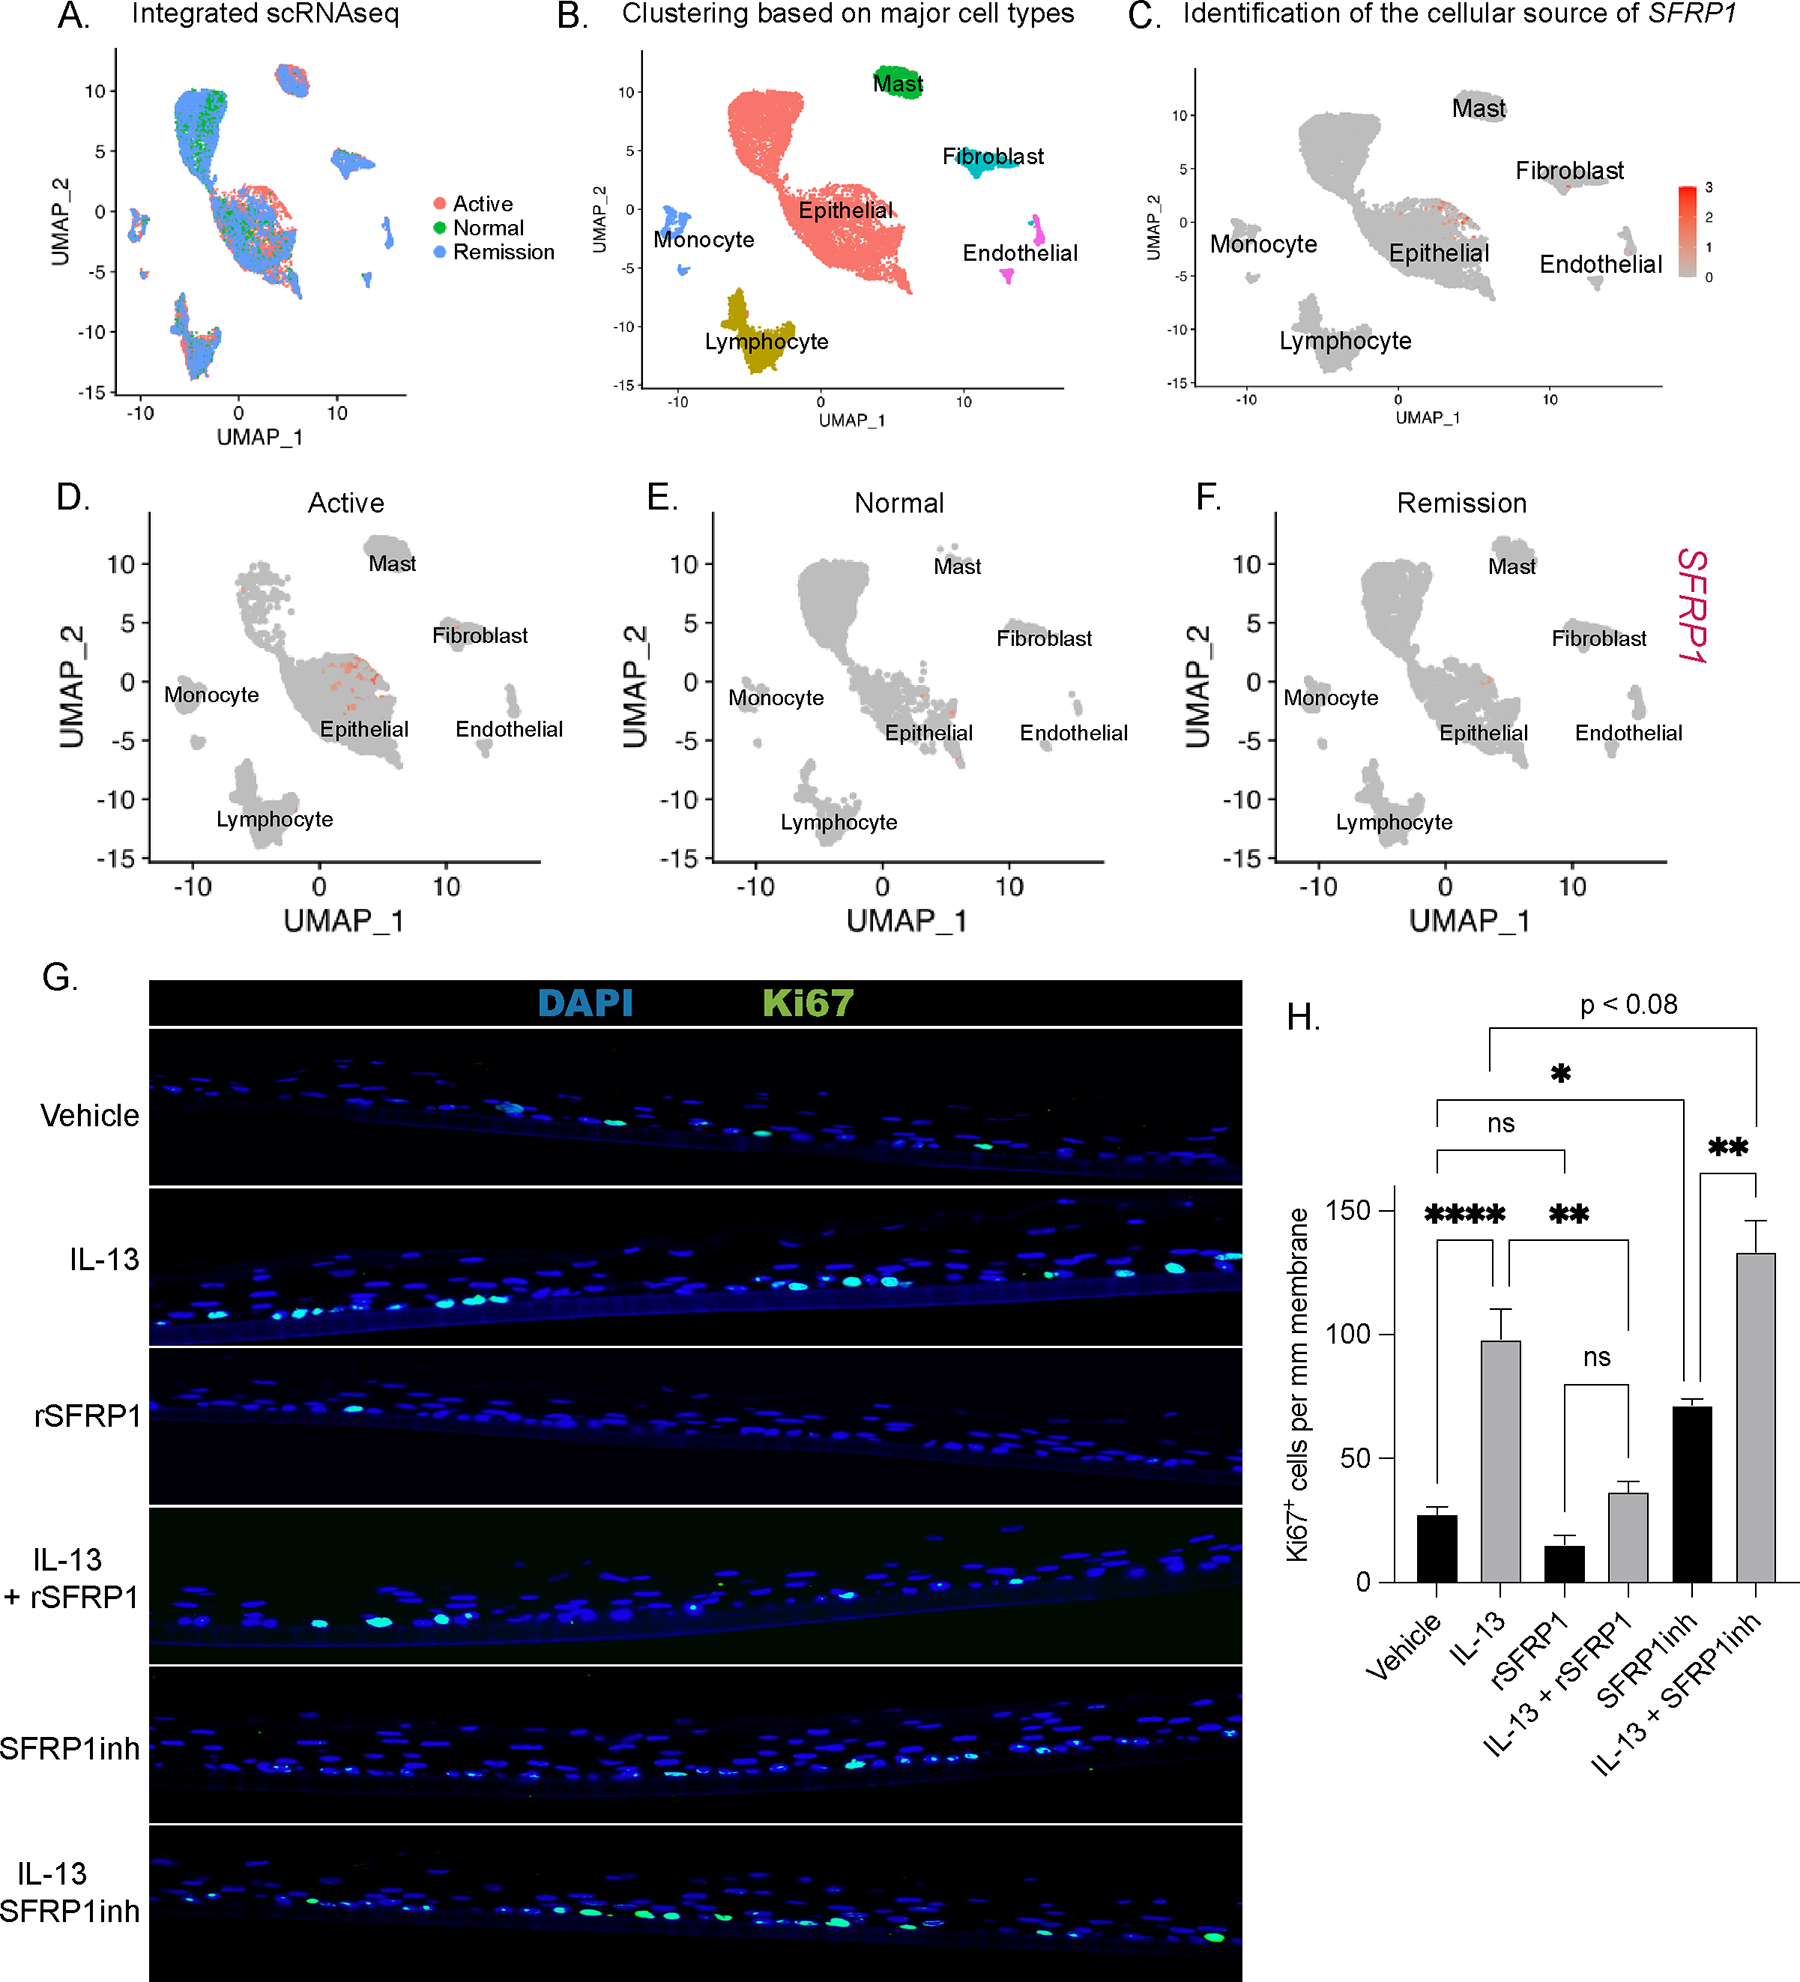
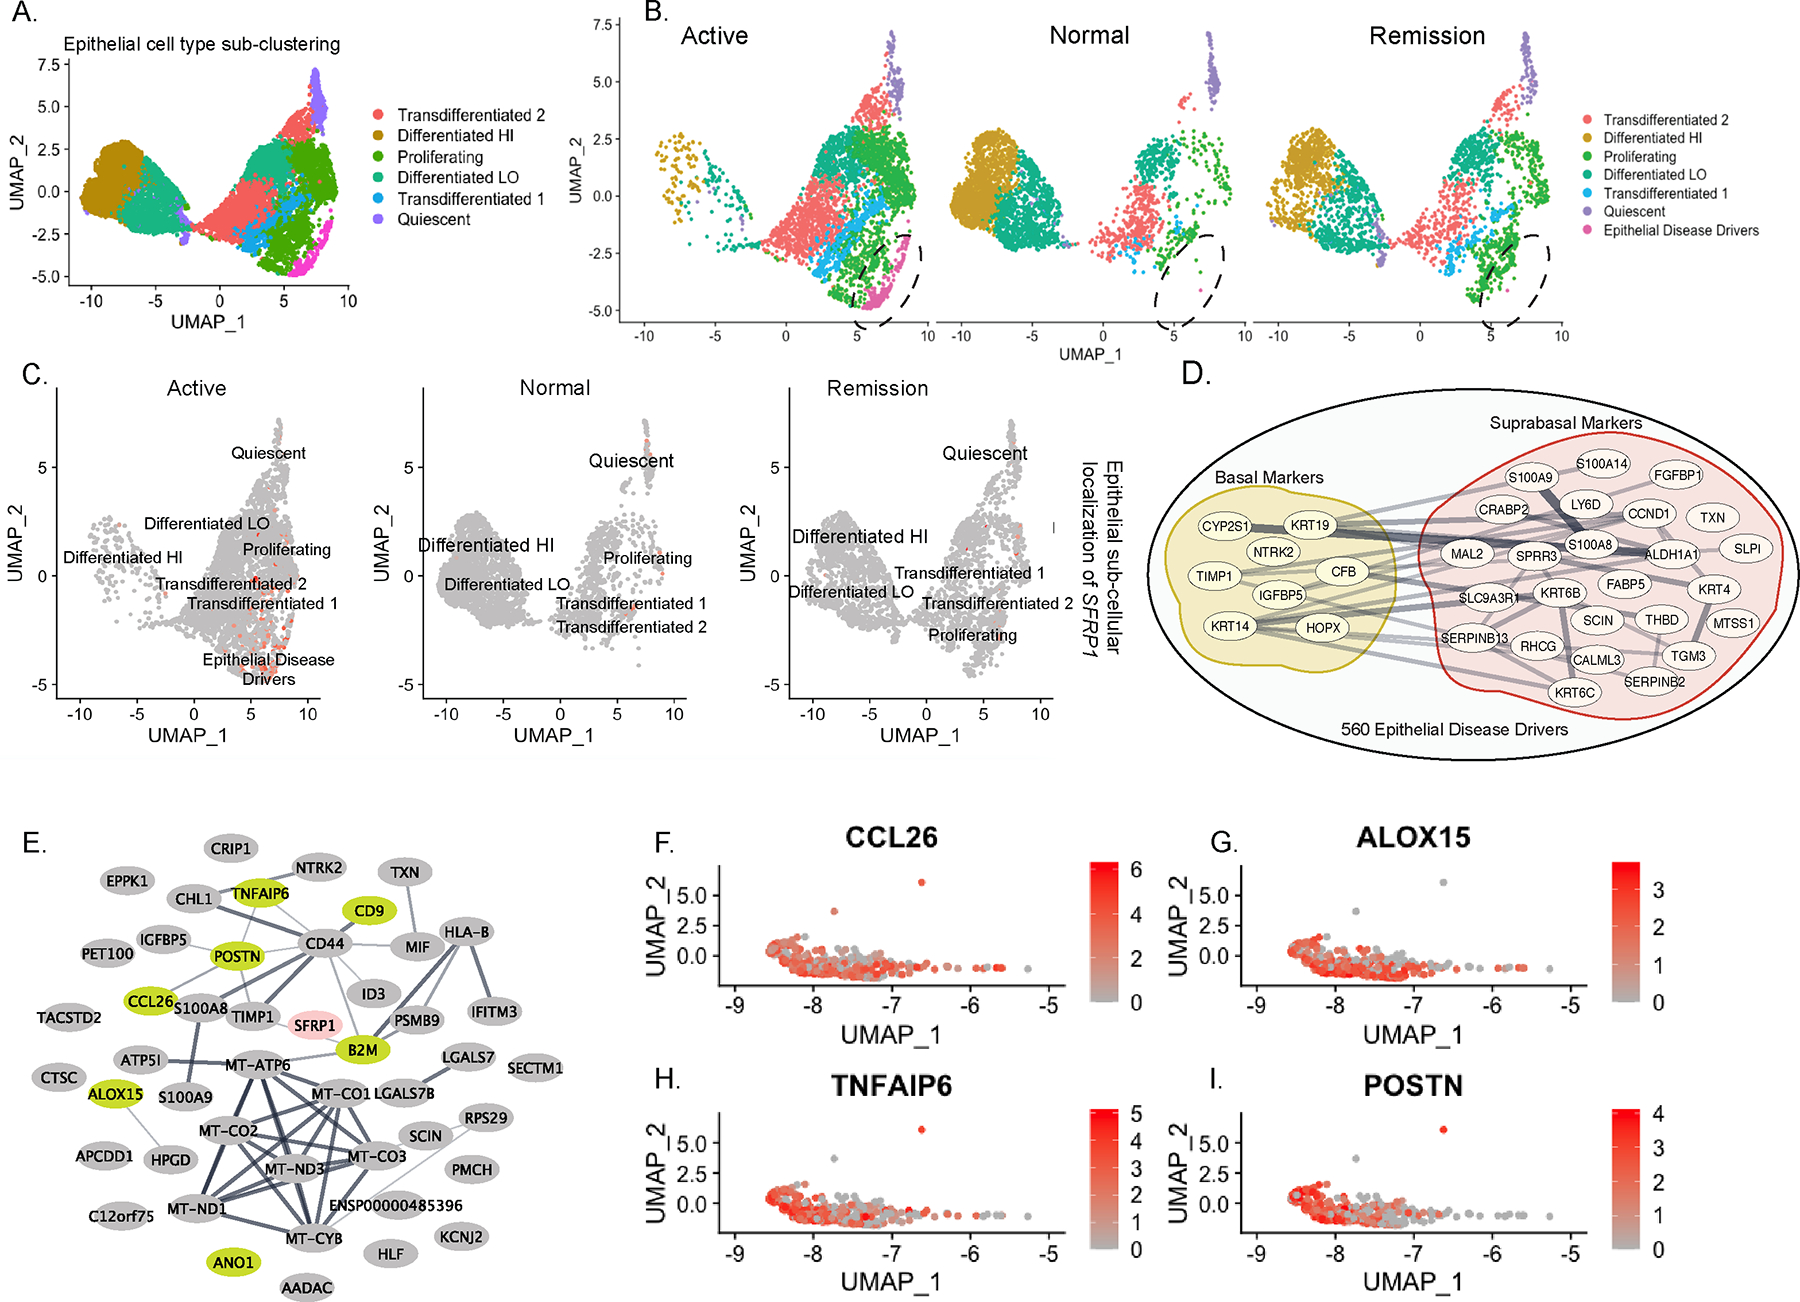
Results: RNA-sequencing analysis of esophageal biopsies (healthy control vs EoE) and EPC2-ALI revealed 82 common differentially expressed genes that were enriched for putative STAT3 target genes. In vitro and in vivo analyses revealed a link between IL-13-induced STAT3 and STAT6 phosphorylation, SFRP1 mRNA expression, and esophageal epithelial proliferation. In vitro studies showed that IL-13-induced esophageal epithelial proliferation was STAT3-dependent and regulated by the STAT3 target SFRP1. SFRP1 mRNA is increased in esophageal biopsies from patients with active EoE compared with healthy controls or patients in remission and identifies an esophageal suprabasal epithelial cell subpopulation that uniquely expressed the core EoE proinflammatory transcriptome genes (CCL26, ALOX15, CAPN14, ANO1, and TNFAIP6).

Conclusions: These studies identify SFRP1 as a key regulator of IL-13-induced and STAT3-dependent esophageal proliferation and BZH in EoE and link SFRP1+ esophageal epithelial cells with the proinflammatory and epithelial remodeling response in EoE.

Keywords: Eosinophilic esophagitis, epithelium, proliferation, basal zone hyperplasia, STAT3, SFRP1, bioinformatics.


Conflict of interest statement

Conflict of Interests: SPH receives research grant support from Regeneron Pharmaceuticals. MC: Consultant: Regeneron, Allakos, Adare/Ellodi, Shire/Takeda, AstraZeneca, Sanofi, Bristol Myers Squibb, Phathom. Research funding: Regeneron, Allakos, Shire/Takeda, AstraZeneca, Adare/Ellodi, Danone. The remaining authors declare that the research was conducted in the absence of any commercial or financial relationships that could be construed as a potential conflict of interest.

Figures

Figure 1:
Figure 1:. Enrichment of STAT3-regulated genes in EoE and IL-13-stimulated EPC2-ALI.
A. RNA sequencing (RNAseq) datasets and associated differentially expressed gene (DEG) counts B. Venn diagram of common and unique DEGs from three independent RNAseq datasets C. UpSet plot of putative STAT protein targets from the 82 common esophageal epithelial-specific EoE genes D. List of putative STAT3 targets from the 82 esophageal epithelial-specific EoE genes.
Figure 2:
Figure 2:
IL-13 activates STAT3 in EPC2-ALI and primary esophageal cells derived from patient biopsies. A. Schematic of EPC2-ALI culture system B. Western blot of EPC2-ALI under Vehicle and IL-13-stimulated conditions with probing for phosphorylation of STAT3 (Y705, S727) and STAT6 (Y641) C. Schematic of STAT6 and STAT3 activation kinetics from EPC2-ALI stimulated with Vehicle or IL-13 time-course D. Representative diagram of 3D esophageal epithelial cell organization and marker expression with Krt15- expressing basal cells at the basolateral surface and Krt4-expressing squamous cells towards the apical surface E. Immunofluorescence (IF) staining of 3D primary esophageal epithelium stained for Krt15 (green), Krt4 (red), and DAPI (blue) F. IF image from the basolateral surface of the 3D stack with Krt15+ basal epithelial cells G. IF image from the apical surface of the 3D stack with Krt4+ squamous epithelial cells H. IF staining of basal cells (Krt15; green) and proliferative cells (Ki67; pink). I. Western blot of IL-13-stimulated primary esophageal cells for STAT3 and STAT6 phosphorylation J-K. qPCR mRNA fold-change of ANO1 and CCL26 in IL-13-stimulated primary esophageal cells with representative passages 3 and 6. Repeated measures ANOVA were performed on IL-13-time course western blot densitometry analyses to determine the statistical significance of IL-13 stimulation on expression of proteins over time. Ordinary one-way ANOVA with Tukey’s multiple comparisons test were performed on qPCR analyses of the mean fold-change expression values across groups. * p < .05, ** p < 0.01, *** p < 0.001, **** p < 0.0001.
Figure 3:
Figure 3:
Mice with inducible overexpression of IL-13 in esophageal epithelial cells exhibit epithelial remodeling and increased STAT3 expression. A. Schematic of in vivo model of IL-13-induced esophageal epithelial remodeling B-C. H&E staining of Dox+ Krt5-rtTA x WT (WT) and Dox+ Krt5-rtTA xTetO-IL-13Tg (Tg) mouse esophagus; yellow arrows indicate DIS, green bars indicate BZH and red bars indicate total epithelial thickness D-E. Immunohistochemistry (IHC) staining for Ki67 for esophageal basal proliferation of WT and Tg esophagus; green arrows indicate Ki67+ cells F-G. Masson’s Trichrome staining for collagen deposition in WT and Tg mice H. Measurement of total epithelial thickness I. Percentage of basal zone to total epithelial thickness J. Measurement of dilated intercellular spaces (nM) K. Quantification of Ki67+ cells/mm epithelium L. Spearman correlation analysis between Ki67+ cells/mm epithelium and esophageal epithelial thickness in WT and Tg mice. Individual data points represent 1 mouse. Welch’s t tests were performed to compare differences in quantifications of epithelial thickness, percent basal zone, dilated intercellular spaces, and Ki67+ cells / mm epithelium between WT and Tg mice. * p < .05, ** p < 0.01, *** p < 0.001, **** p < 0.0001. Data represented as means ± SEMs of three independent experiments.
Figure 4:
Figure 4:
STAT3 protein expression in mice with inducible overexpression of IL-13 in esophageal epithelial cells. IHC staining of total STAT3 protein in A. Dox+ Krt5-rtTA x WT (WT) mouse esophagus with no primary antibody B. WT mouse esophagus and C. in Dox+ Krt5-rtTA x TetO-IL-13Tg (Tg) mouse esophagus. IHC staining of phosphorylated STAT3 (pSTAT3-Y705) in D. WT mouse esophagus and E. Tg mouse esophagus. All issues were counterstained with nuclear hematoxylin stain. Staining was performed on mouse tissues extracted from three independent experiments.
Figure 5:
Figure 5:
IL-13-induced esophageal epithelial proliferation requires STAT3. A. Immunofluorescence staining of Brdu (green) and DAPI of EPC2CTRL and EPC2ΔSTAT3 cells under Vehicle and IL-13 stimulation B. Quantification of Brdu+ cells/mm membrane C. Western blot of EPC2-ALI probing for total (STAT3), phosphorylated STAT3 (pSTAT3-Y705 and pSTAT3-S727), and total STAT6 (STAT6) in the presence and absence of IL-13 and selective STAT3 degrader, SD-36 D. Hematoxylin & Eosin staining showing epithelial remodeling (BZH, DIS) in EPC2-ALI in the presence and absence of IL-13 and SD-36; green arrow points to DIS and yellow brackets mark basal cell expansion E. IF staining for Ki67 (red) for basal cell proliferation and DAPI (blue) in EPC2-ALI in the presence and absence of IL-13 and SD-36 F. Quantification of Ki67+ cells/mm membrane G-K. qPCR for mRNA fold-change of ANO1, TP63, CCL26, SLC9A3, and CAPN14, respectively, in the presence and absence of IL-13 and SD-36. Ordinary one-way ANOVA with Tukey’s multiple comparisons test were performed on qPCR analyses and quantification of Brdu+ cells/mm membrane of the mean fold-change expression values across groups. Data represented as means ± SEMs of three independent experiments, with n = 3 samples per group. * p < .05, ** p < 0.01, *** p < 0.001, **** p < 0.0001.
Figure 6:
Figure 6:
SFRP1 is a novel candidate gene which is associated with cell proliferation and is a STAT3 target. A. Venn diagram of common and unique DEGs from three independent RNAseq datasets, showing 82 common esophageal epithelial-specific EoE genes B. network map of the esophageal epithelial-specific EoE DEGs identifying candidate gene, SFRP1; gray circle: common DEGs from Fig 1B, gray square: putative STAT3 targets, purple circle: associated with “Cell Proliferation” gene ontology (GO), orange square: putative STAT3 target and associated with “Cell Proliferation” GO, and pink square: putative STAT3 target and previously studied in Hogan Laboratory C. qPCR mRNA fold-change of SFRP1 in EPC2-ALI cells stimulated with Vehicle and IL-13 at 4- and 48-hours. D. qPCR mRNA fold-change of SFRP1 in EPC2-ALI cells stimulated with Vehicle and IL-13 in the presence and absence of SD-36. E-F. IHC staining of SFRP1 protein in D. Krt5-rtTA x WT (WT) mouse esophagus and E. Krt5-rtTA x TetO-IL-13Tg (Tg) mouse esophagus. qPCR data represented as means ± SEMs of three independent experiments, with n = 3 samples per group. Staining was performed on mouse tissues extracted from three independent experiments. * p < .05, ** p < 0.01, *** p < 0.001, **** p < 0.0001.
Figure 7:
Figure 7:
Esophageal epithelial cells are cellular sources of SFRP1 expression and IL-13-induced esophageal proliferation is regulated by SFRP1. A. Seurat-integrated single-cell RNA sequencing (scRNAseq) samples consisting of n = 5 Active, n = 3 Remission, and n = 2 Normal esophageal patient biopsies B. scRNAseq clustering of integrated samples based on major cell types which are annotated as Epithelial, Mast, Endothelial, Fibroblast, Monocyte, and Lymphocyte C. mRNA expression of SFRP1 amongst the six annotated clusters D-F. cell-type-specific mRNA expression of SFRP1 separated by disease state (Active, Normal, and Remission) G-H. IF staining of Ki67 and quantification in EPC2-ALI in the presence or absence of IL-13, recombinant SFRP1 protein (rSFRP1) and SFRP1 pharmacologic antagonist, WAY316606 (SFRP1inh). Ordinary one-way ANOVA with Tukey’s multiple comparisons test were performed on quantification of Ki67+ cells/mm membrane of the mean fold-change expression values across groups. Data represented as means ± SEMs of three independent experiments, with n = 3 samples per group. * p < .05, ** p < 0.01, *** p < 0.001, **** p < 0.0001.
Figure 8:
Figure 8:. A novel esophageal epithelial cell cluster present exclusively in Active EoE scRNAseq samples is a potent source of SFRP1.
A. Sub-clustering of the integrated and combined “Epithelial Cell” cluster identified in Fig 7B into six predominant subpopulations B. Sub-clustered epithelial populations separated by disease state (Active, Normal, Remission) and identification of a seventh sub-population in the “Active” samples. C. SFRP1 mRNA expression in epithelial subpopulations separated by disease state (Active, Normal, Remission) D. Mapping of 560 genes expressed in the seventh epithelial subpopulation present in Active disease, upon the top 100 “Basal” and “Suprabasal” markers E. Network of top 50 differentially expressed genes present in the Disease-Associated epithelial population, depicting canonical genes highly differentially expressed in EoE (green). F-I. mRNA expression of EoE pro-inflammatory genes CCL26, ALOX15, TNFAIP6, and POSTN in the Disease-Associated epithelial population.

References

    1. Aceves SS, Ackerman SJ. Relationships between eosinophilic inflammation, tissue remodeling, and fibrosis in eosinophilic esophagitis. Immunol Allergy Clin North Am 2009; 29:197–211, xiii-xiv. - PMC - PubMed
    1. Collins MH. Histopathology of eosinophilic esophagitis. Dig Dis 2014; 32:68–73. - PubMed
    1. Dellon ES. Cost-effective care in eosinophilic esophagitis. Ann Allergy Asthma Immunol 2019; 123:166–72. - PMC - PubMed
    1. Furuta GT, Katzka DA. Eosinophilic Esophagitis. N Engl J Med 2015; 373:1640–8. - PMC - PubMed
    1. Gonsalves NP, Aceves SS. Diagnosis and treatment of eosinophilic esophagitis. Journal of Allergy and Clinical Immunology 2020; 145:1–7. - PMC - PubMed

Publication types

MeSH terms