. 2023 Oct 15:170:453-463.
doi: 10.1016/j.actbio.2023.08.048. Epub 2023 Aug 29.

Modeling the kinetics of lymph node retention and exposure of a cargo protein delivered by biotin-functionalized nanoparticles

Affiliations

Modeling the kinetics of lymph node retention and exposure of a cargo protein delivered by biotin-functionalized nanoparticles

Paul R Hartmeier et al. Acta Biomater. .

Abstract

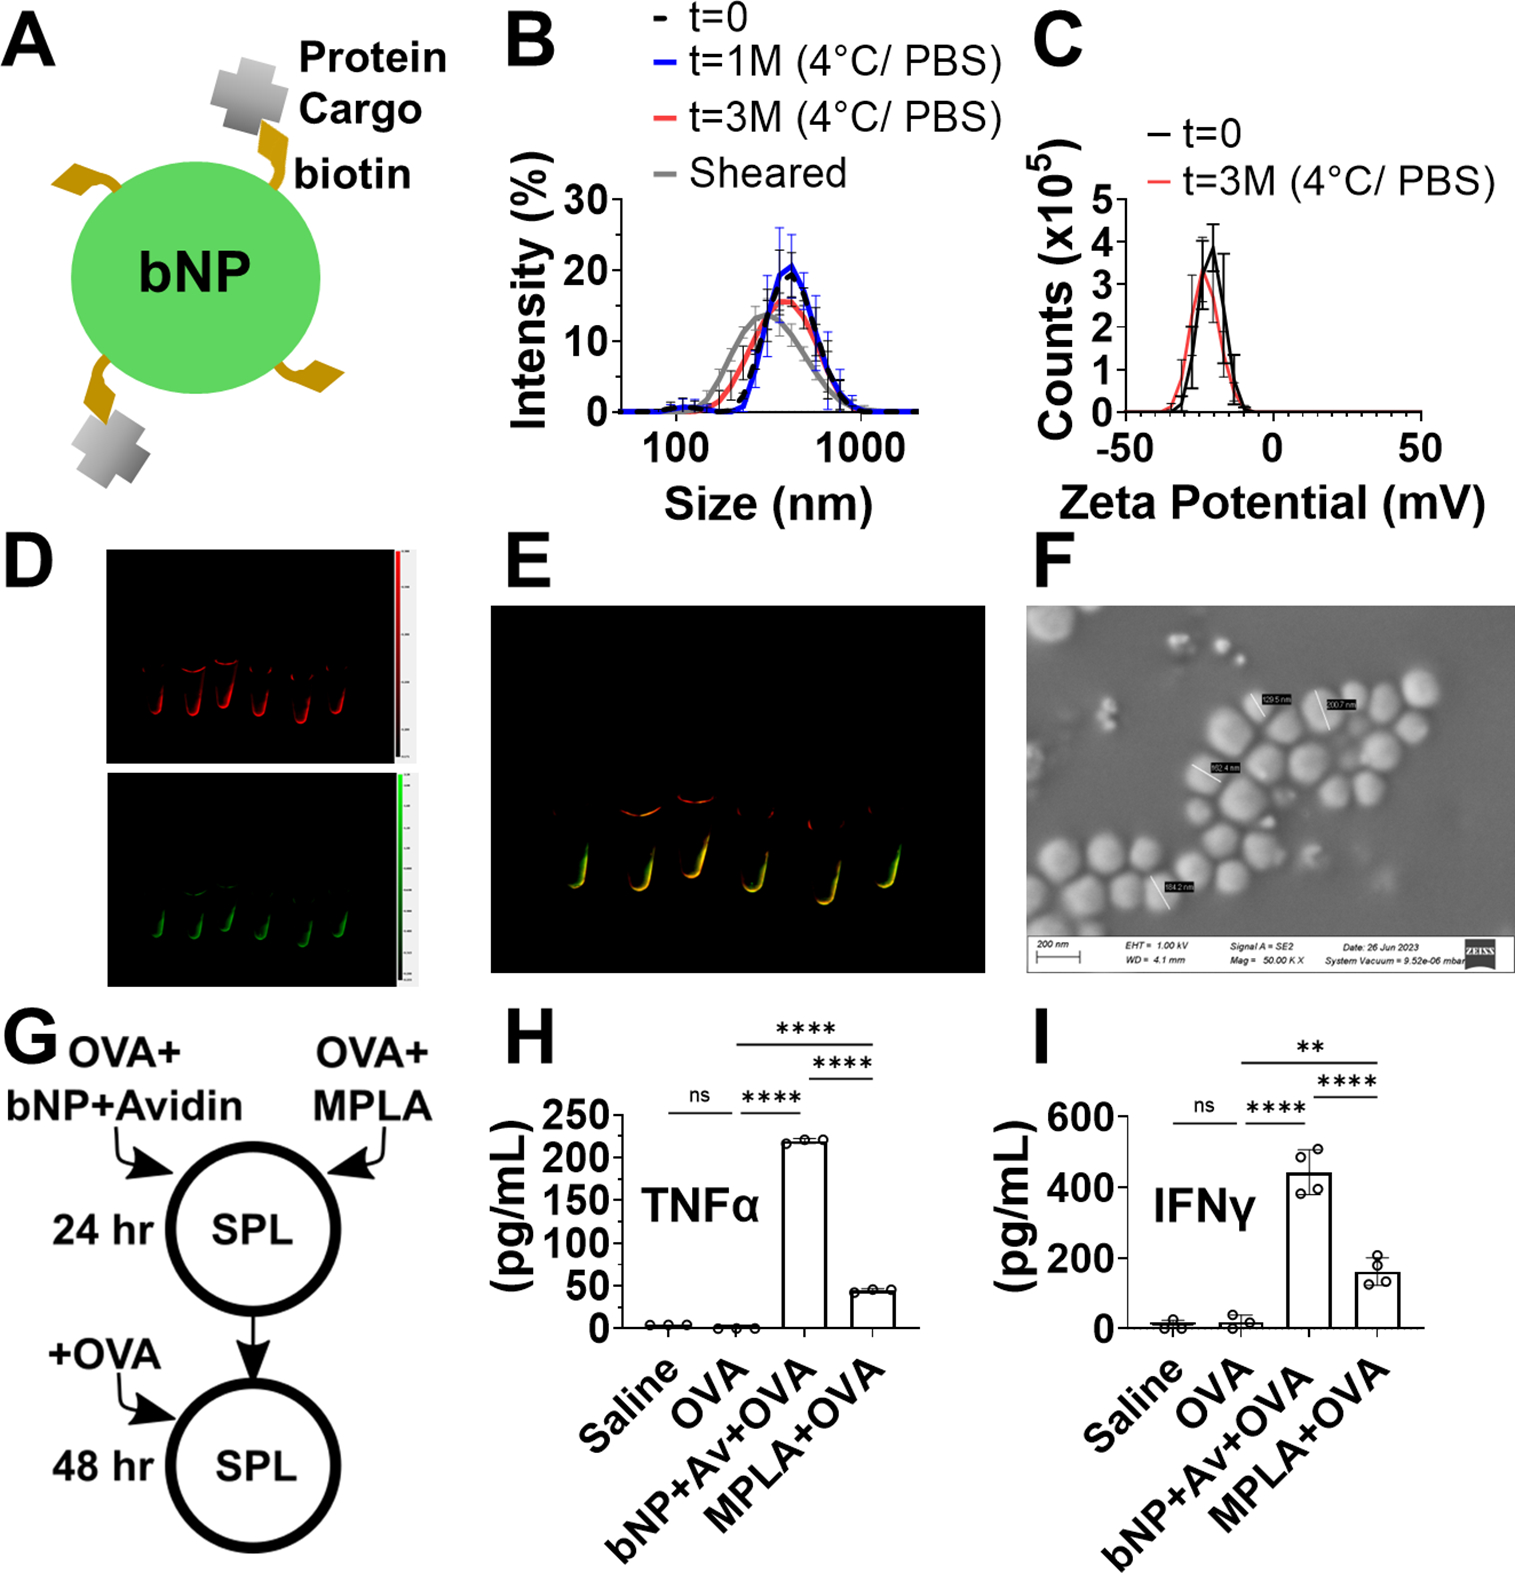
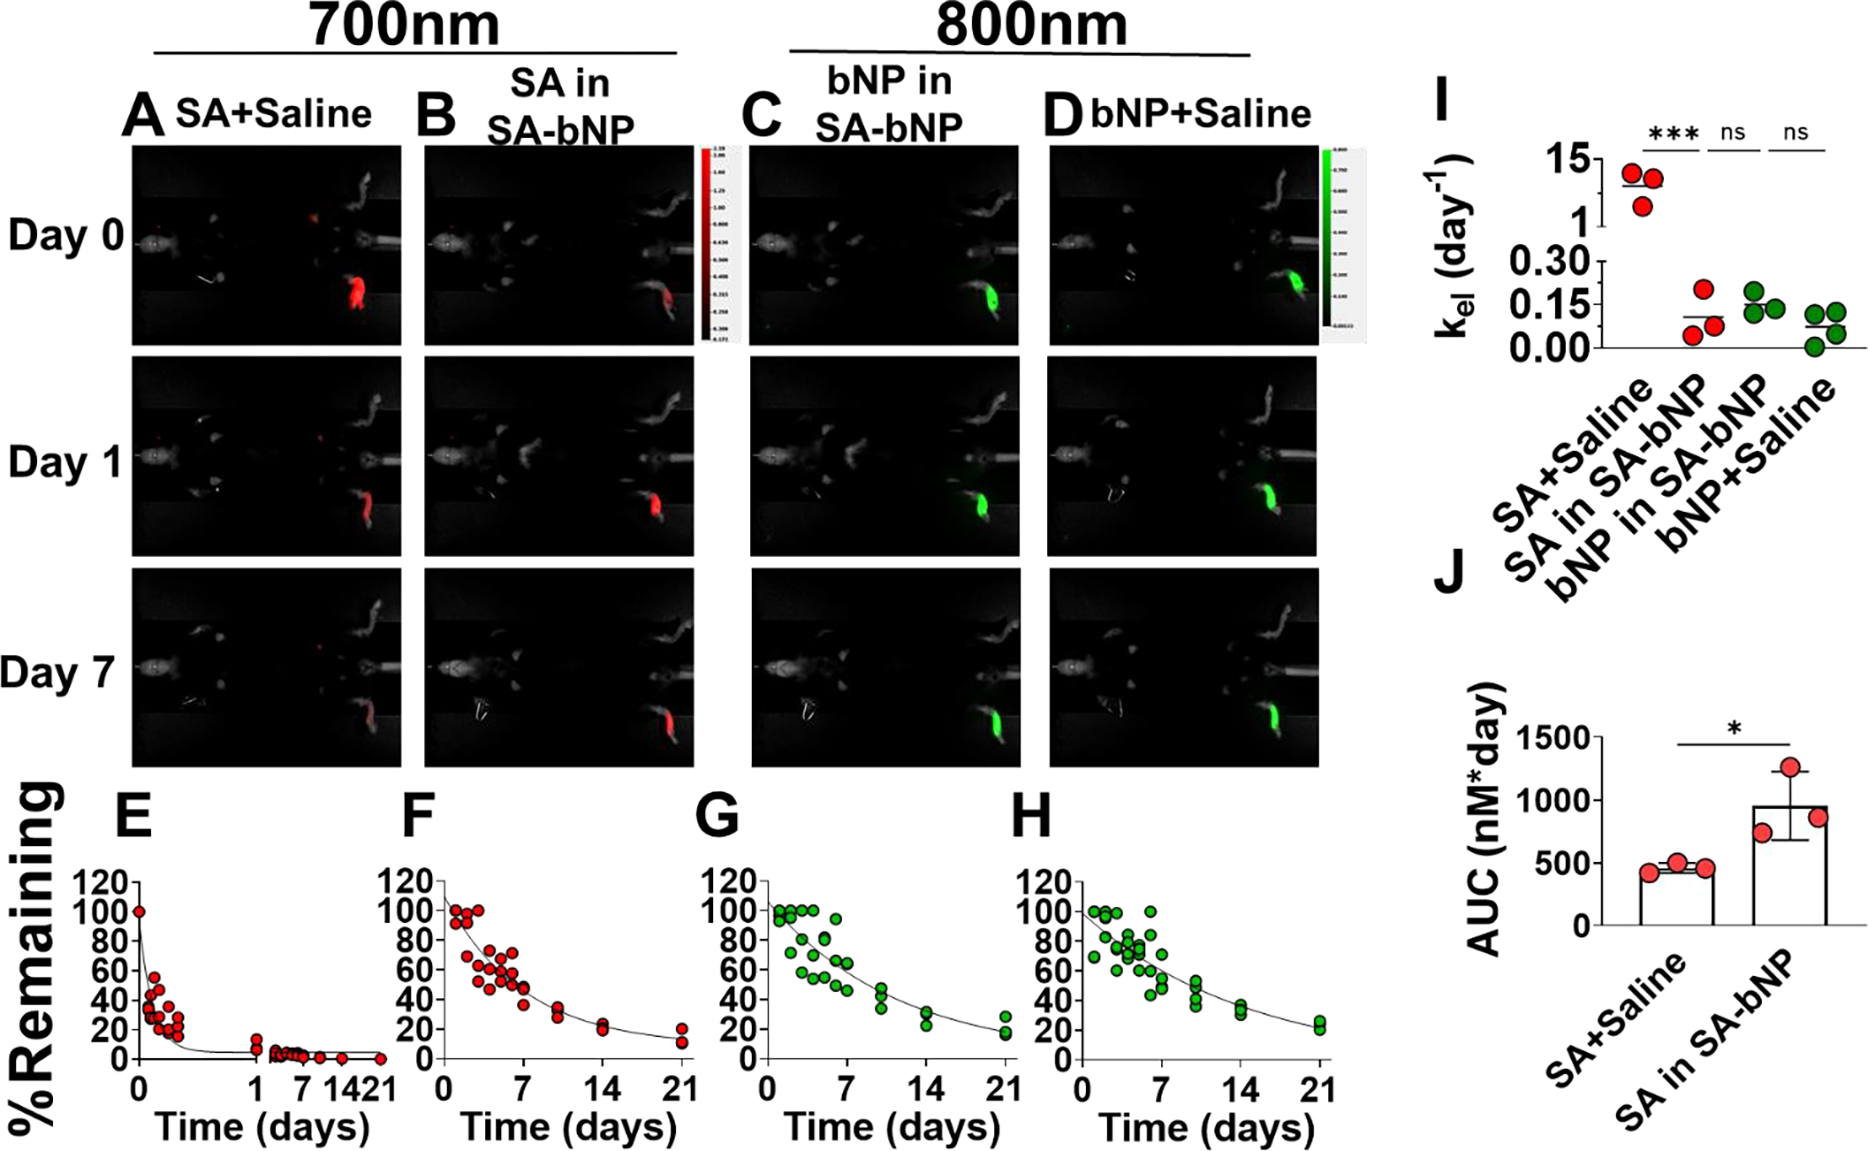
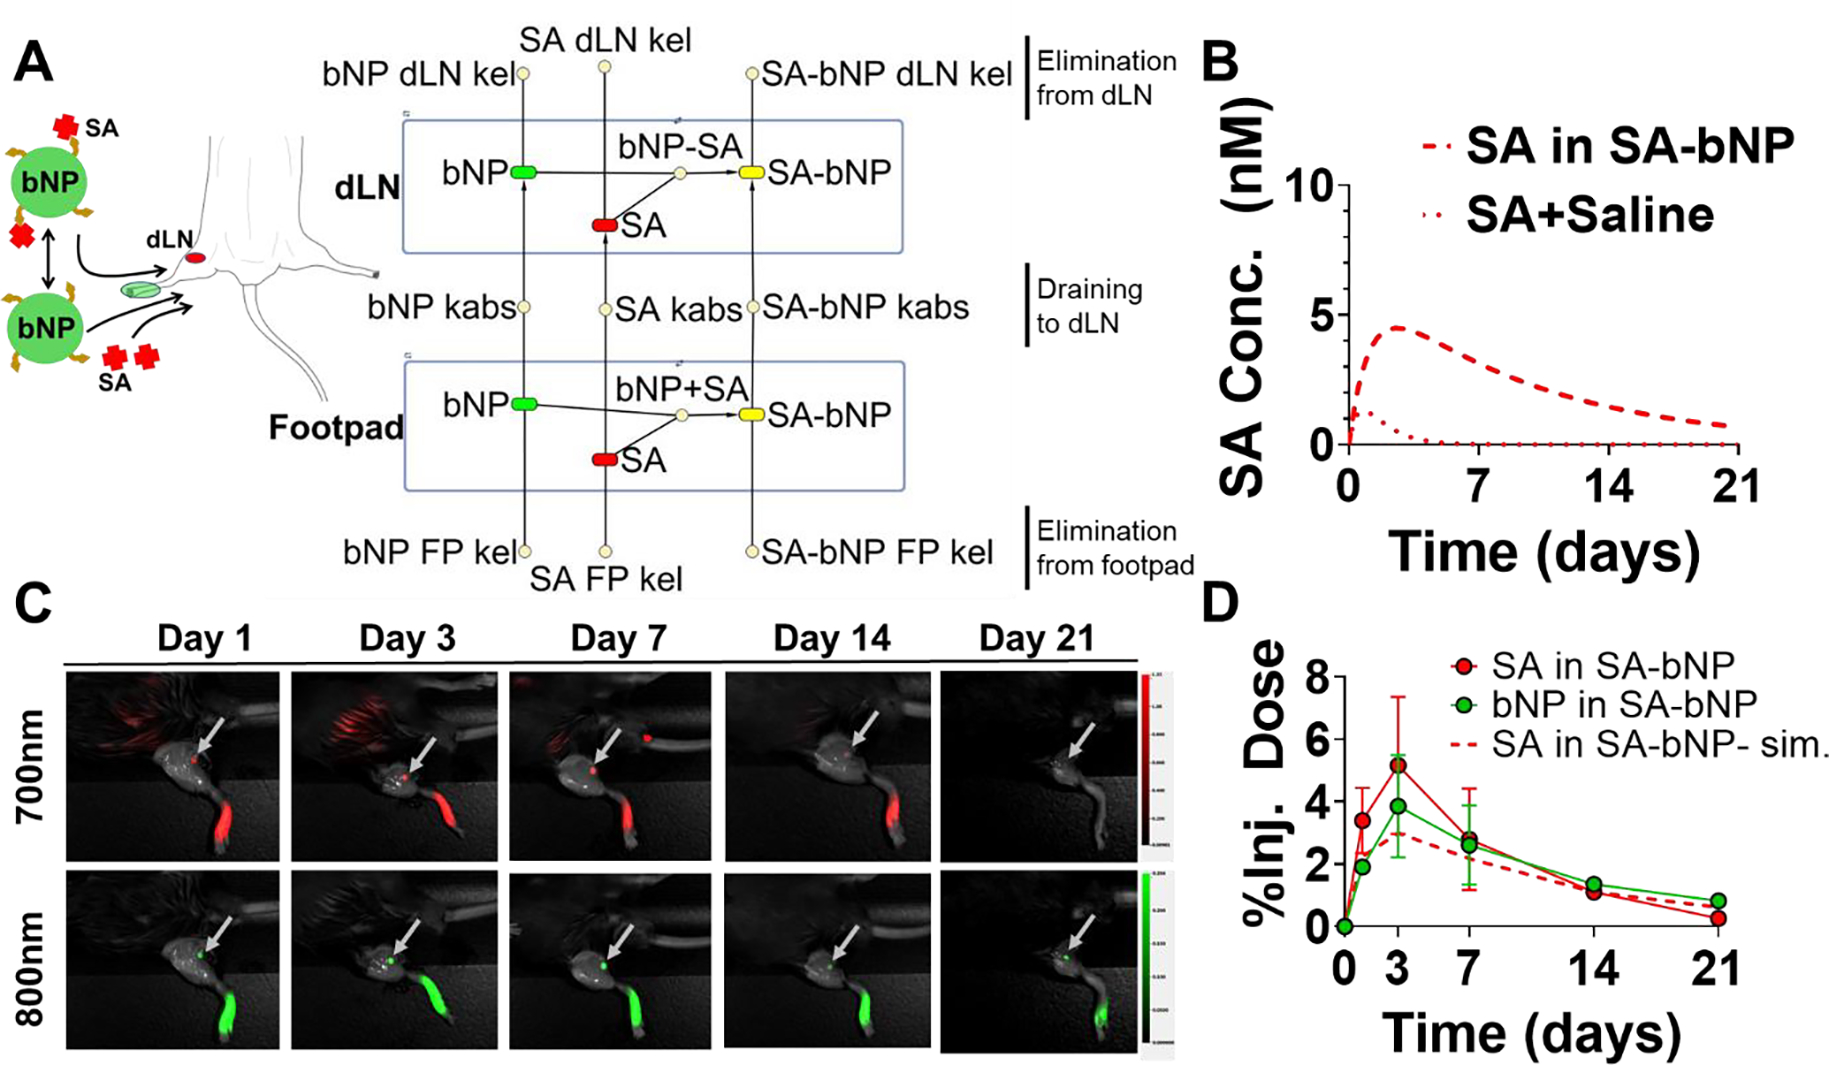
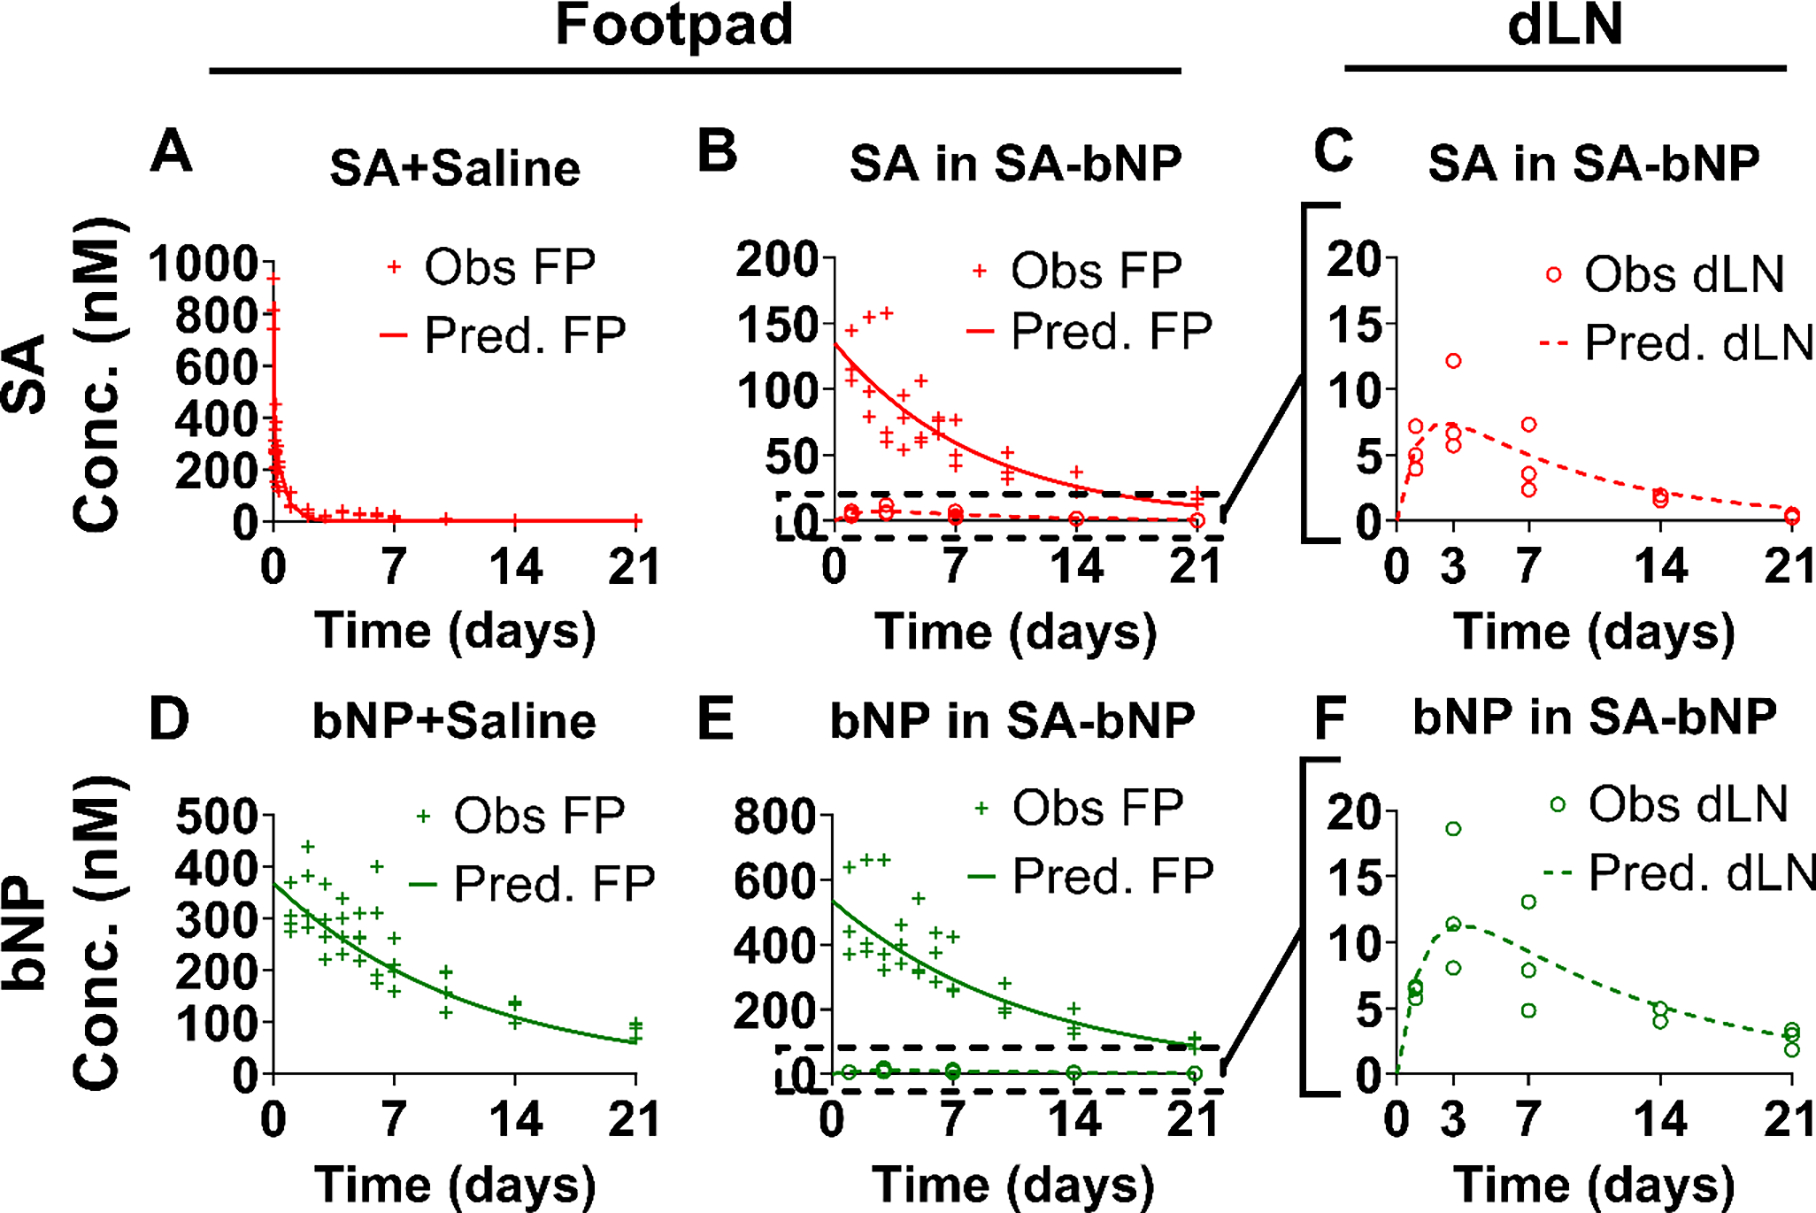
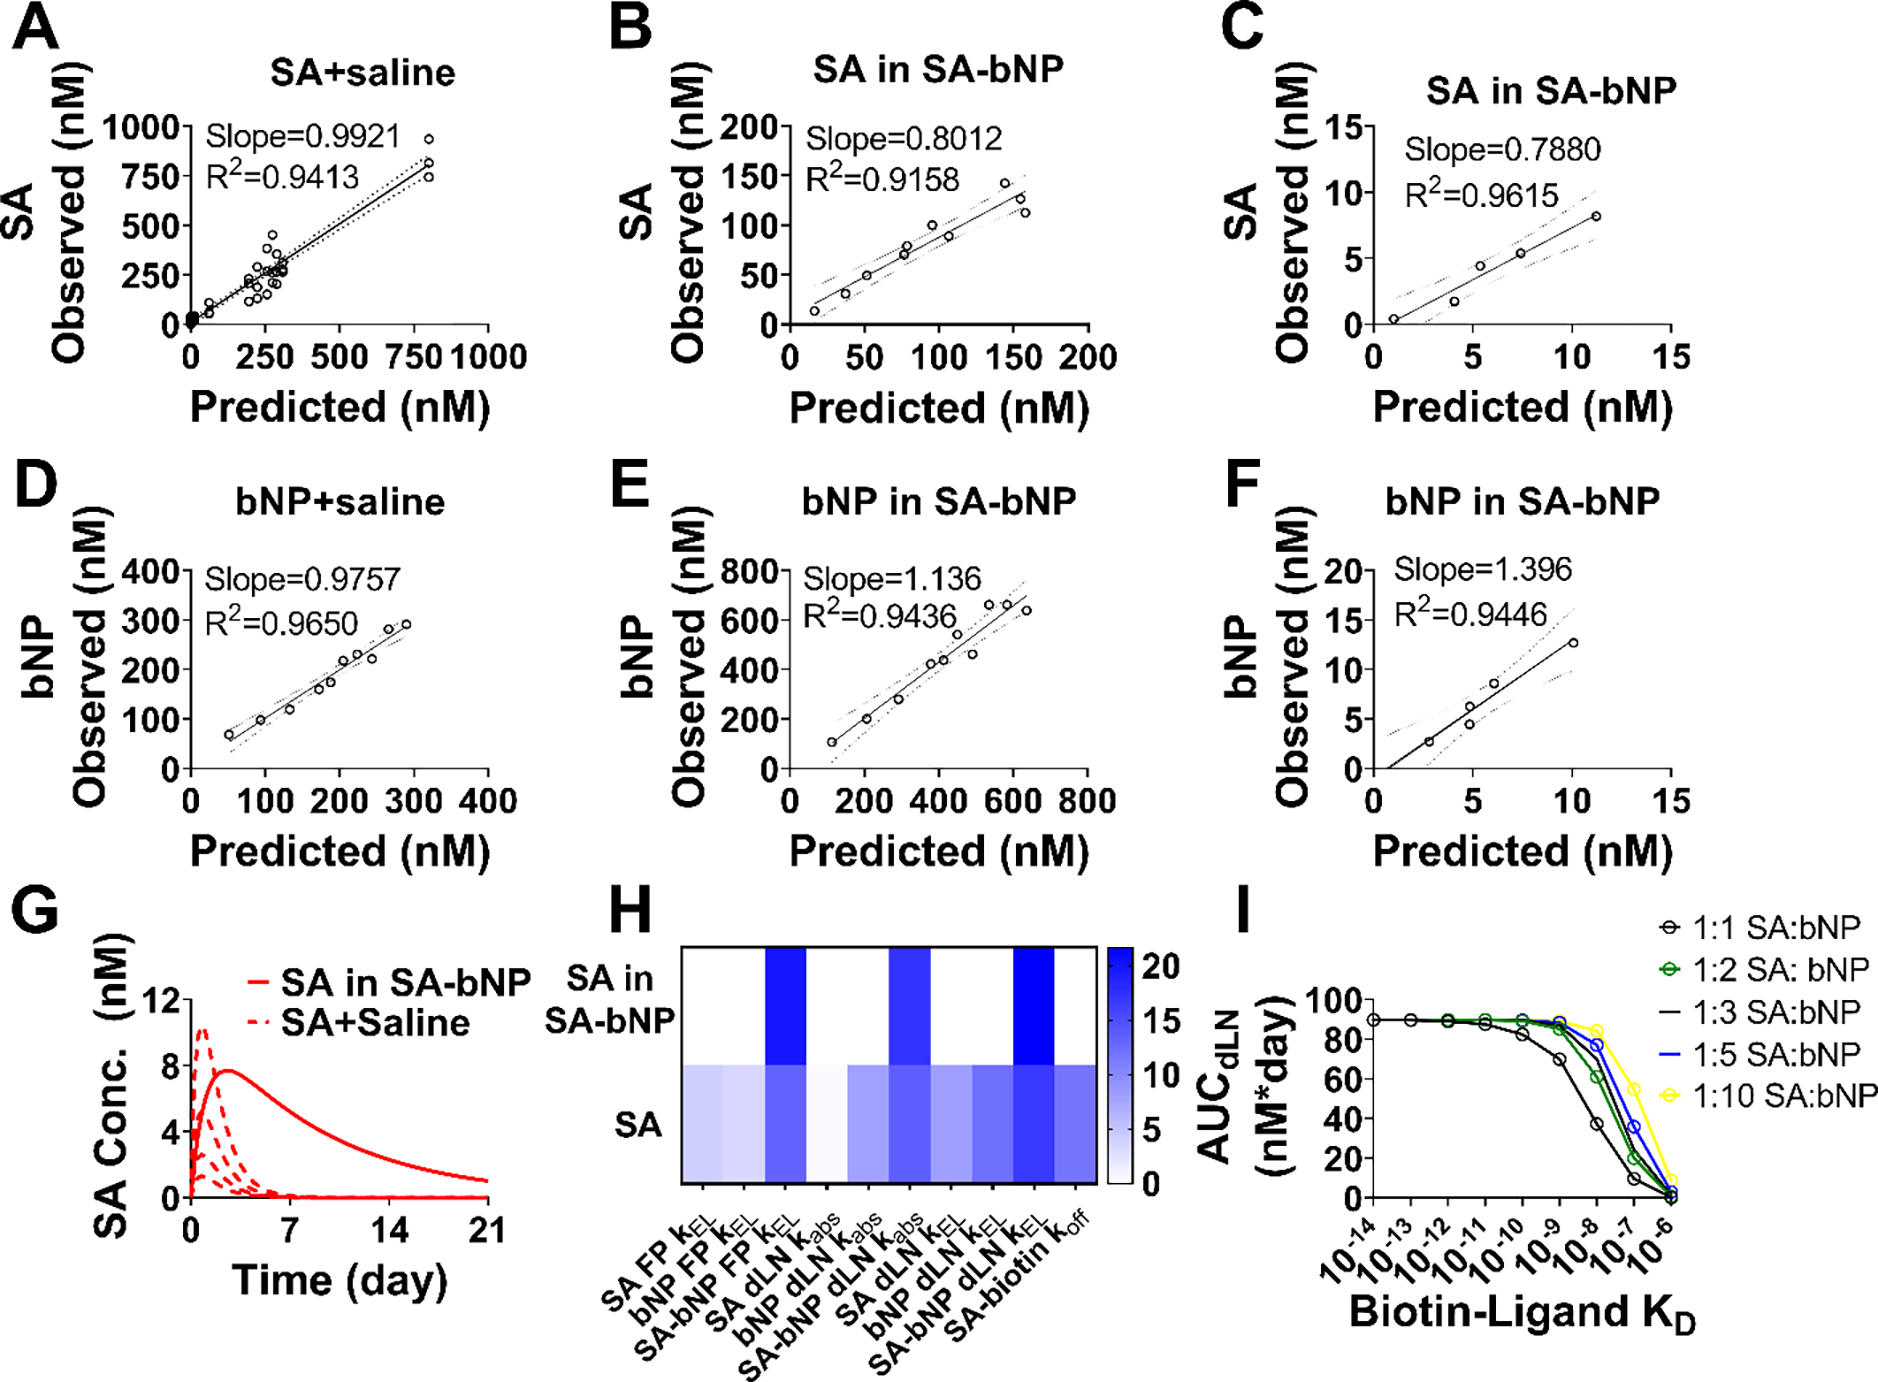
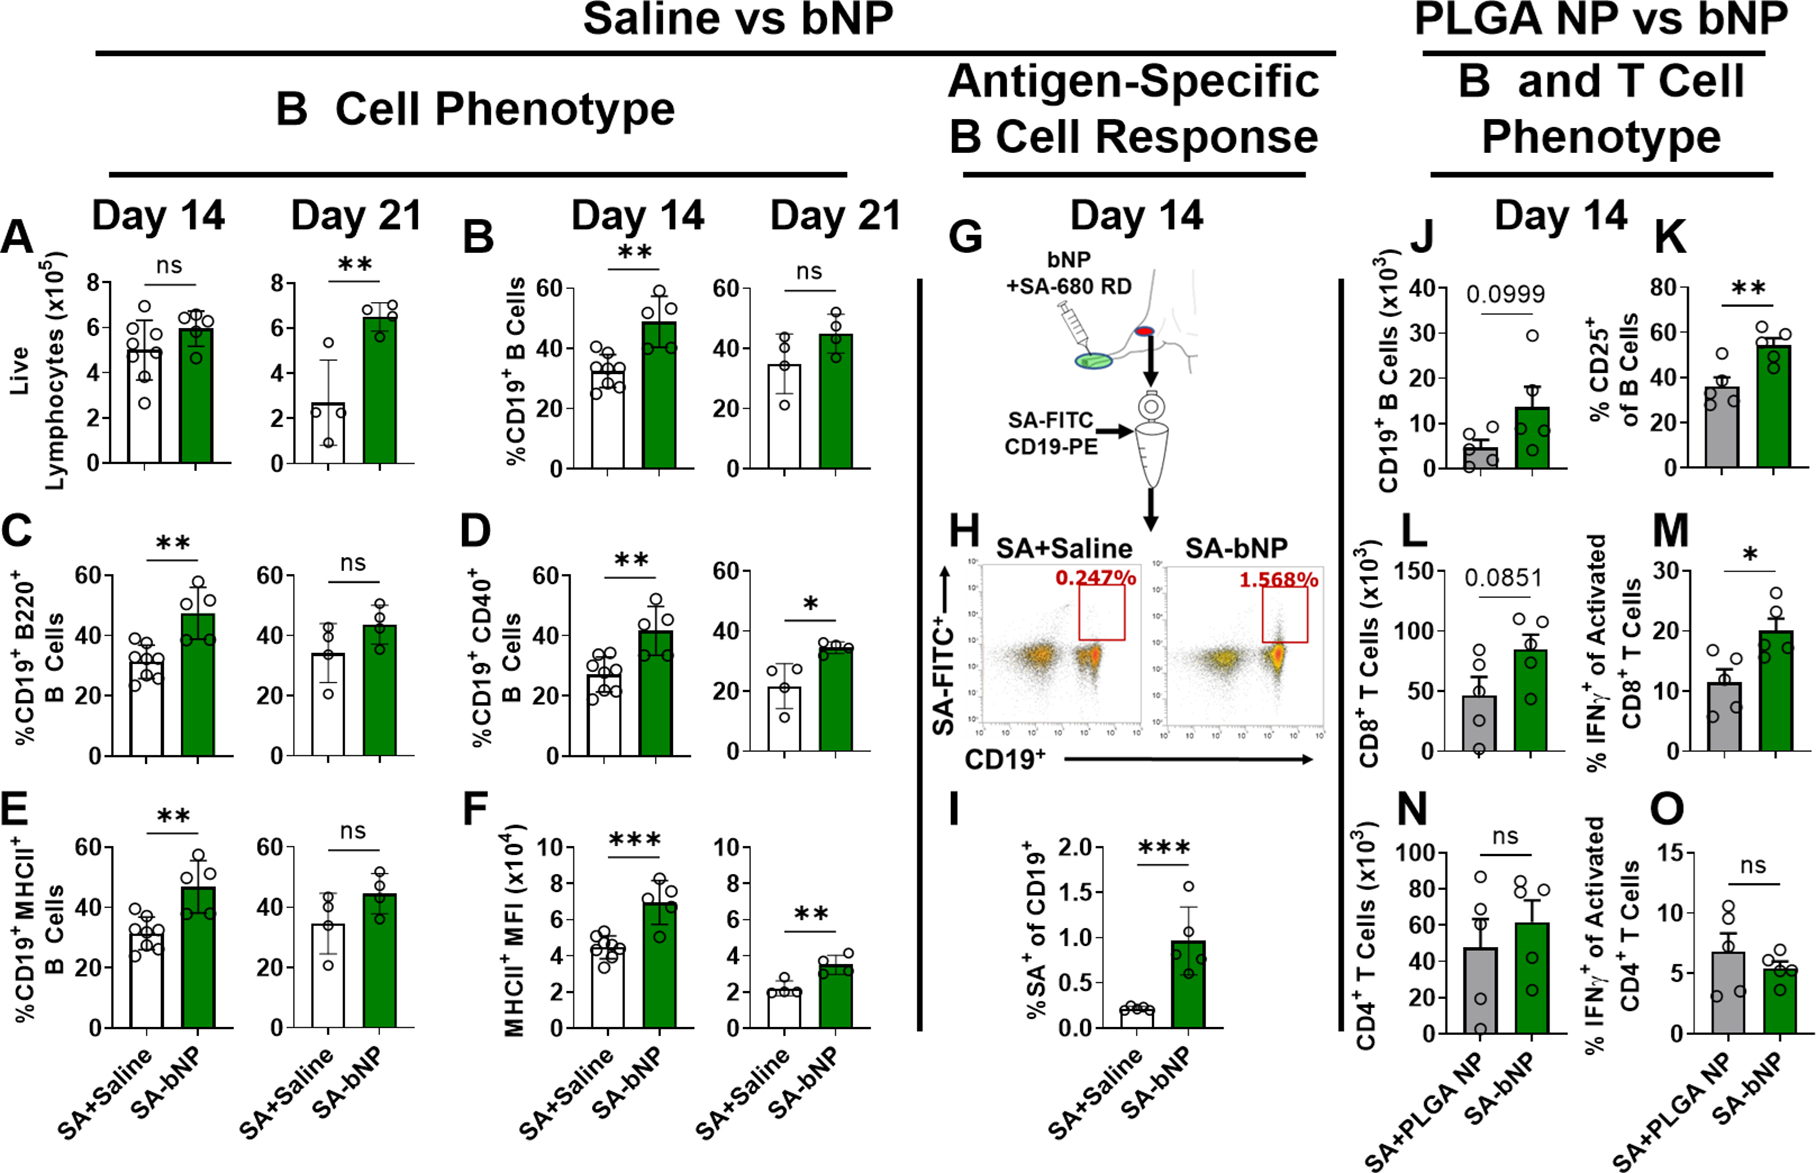
Generation of protective immunity through vaccination arises from the adaptive immune response developed primarily in the lymph nodes drained from the immunization site. Relative to the intramuscular route, subcutaneous administration allows for direct and rapid access to the lymphatics, but accumulation of soluble protein antigens within the lymph nodes is limited. Subunit vaccines also require immune stimulating adjuvants which may not accumulate in the same lymph nodes simultaneously with antigen. Herein we report the use of biotinylated poly (lactic-co-glycolic acid) nanoparticles (bNPs) to enhance delivery of a model protein antigen to the lymphatics. bNPs provide dual functionality as adjuvant and vehicle to localize antigens with stimulated immune cells in the same draining lymph node. Using streptavidin as a model antigen, which can be loaded directly onto the bNP surface, we evaluated the kinetics of lymph node occupancy and adaptive immune responses in wildtype C57BL/6 mice. Antigen exposure in vivo was significantly improved through surface loading onto bNPs, and we developed a working kinetic model to account for the retention of both particles and antigen in draining lymph nodes. We observed enhanced T cell responses and antigen-specific B cell response in vivo when antigen was delivered on the particle surface. This work highlights the advantage of combining intrinsic adjuvant and antigen loading in a single entity, and the utility of kinetic modeling in the understanding of particle-based vaccines. STATEMENT OF SIGNIFICANCE: Development of safe and effective subunit vaccines depends on effective formulations that render optimized exposure and colocalization of antigens and adjuvants. In this work, we utilize a nanoparticle system which features self-adjuvanting properties and allows for surface loading of recombinant protein antigens. Using in vivo imaging, we demonstrated prolonged co-localization of the antigen and adjuvant particles in draining lymph nodes and provided evidence of B cell activation for up to 21 days following subcutaneous injection. A pharmacokinetic model was developed as a step towards bridging the translational gap between particulate-based vaccines and observed outcomes. The results have implications for the rational design of particle-based vaccines.

Keywords: Lymphatics, adjuvant; Modeling; Nanoparticles; PLGA, pharmacokinetics; Subcutaneous depot; Subunit vaccine.


Conflict of interest statement

Declaration of Competing Interests Authors declare that they have no competing interests.

Figures

Fig. 1.
Fig. 1.. Design and Characterization of Adjvuanting Biotinylated Nanoparticles.
A, Conceptual design of bNP for surface loaded antigen delivery and adjuvanting effect from free biotin. B, bNP size from DLS at time of manufacture and after 1 and 3 months in PBS/ 4°C. C, bNP zeta potential from DLS at time of manufacture and after 1 and 3 months in PBS/ 4°C. D Fluorescent signal of pelleted SA-680 RD (red) bound to NIR bNP (green) after 21 days in RPMI media at 37 °C (n=6). E, Overlay of 700 and 800 nm fluorescence from panel D. F, SEM micrographs of NIR bNPs after 21 days in RPMI media at 37 °C. G, Schematic of ex vivo splenic cell (SPL) experiments. H, Tumor necrosis factor alpha (TNFα) concentration from mouse splenic cell cultures following 24-hour incubation with OVA (1μg/mL) with and without bNPs (500 μg/mL) or MPLA (20 μg/mL) as adjuvants. I, IFNγ concentration from re-plated cells in suspension cultures primed with 1μg/mL OVA (with and without adjuvant) for 24 hours and restimulated with OVA alone for 48 hours. *,**, ***, **** p<0.05, <0.01, <0.001 and <0.0001 respectively, by 1-way ANOVA
Fig. 2.
Fig. 2.. In vivo Near Infrared Imaging following Subcutaneous Administration.
C57/black mice were administered SA+saline, SA-bNP or bNP+saline SC into the right footpad (n=3 each group). Injection volume was 40 μL in each group through a 28G needle. SA was loaded onto bNPs by incubation with an approximately 2x molar excess of SA: bNP surface biotin for 30 minutes. Unbound SA was washed from particles by centrifugation and decanting supernatant 2x. SA+saline was injected at the calculated maximum biotin binding on bNPs. T=0 SA+saline dose was higher than SA-bNP dose due to incomplete binding of SA on bNP and washing steps to remove unbound SA. Observed fluorescence in the 700nm channel for SA+saline (A) and SA in SA-bNP (B), and in the 800nm channel for bNP in SA-bNP (C) and unloaded bNPs (D). Normalized injection site elimination profiles vs time for SA+Saline (E), SA in SA-bNP (F) bNP in SA-bNP (G), and bNP+saline (H). I, Elimination rate constants from injection site. Data was fitted to a 1-compartment PK model utilizing Matlab symbiology. J, Area under the curve for free and bound SA in the injection site were calculated from concentration vs time data. *,**, ***p<0.05, <0.01, and <0.001 respectively, by 1-way ANOVA or two-tailed T-test.
Fig. 3.
Fig. 3.. Development of 2-Compartment Model for Antigen Lymph Node Occupancy.
(A) 2-compartment model for elimination of bNP and SA from the footpad (injection site) to the dLN; both can be eliminated separately or as a bound complex (SA-bNP). SA binding constant was incorporated to account for the reversibility of the SA-biotin interaction according to its reported kD (10−14 M). (B) Simulated SA concentration in the dLN vs time for SA+saline and SA-bNP utilizing estimated dLN absorbance and elimination constants from literature values. (C) Observed fluorescence from the injection site and popliteal dLN for SA-bNPs up to 21 days. (D) Observed dLN concentration (as % injected dose) vs time curves for SA in SA-bNP and bNP in SA-bNP in the dLN over 21 days.
Fig. 4.
Fig. 4.. Modeling Lymph Node Occupancy from In Vivo Data up to 21 Days.
Observed versus predicted concentration vs time curves fitted to the developed 2-compartment model utilizing MatLab symbiology for SA+saline footpad kinetics (A), SA in SA-bNP footpad and dLN kinetics (B&C), bNP+saline footpad kinetics (D), and bNP in SA-bNP footpad and dLN kinetics (E&F).
Fig. 5.
Fig. 5.. Evaluation of 2-Compartment Model:
Representative Observed t=0 FP concentration for each mouse was input into the final model (Fig. 3A) and the predicted FP concentration calculated for 1-,2-,3-,4-,5-,6-,7-,10-,14- and 21 days for SA+saline (A), SA in SA-bNP (B), and SA in SA-bNP dLN concentration (C), bNP+saline (D), bNP in SA-bNP (E), bNP in SA-bNP dLN concentration (F). dLN observed values were not individually tracked and were taken from each serial timepoint (1-,3-,7-, 14- and 21-days) and averaged to determine the fit of the model. Slopes were determined using linear regression (Graphpad) and presented with 95% confidence intervals (--). G, Simulated SA accumulation in the dLN as either SA+saline or SA in SA-bNP. SA+saline was simulated at 1, 2, 4 and 8x of the SA-bNP dose to evaluate increases in accumulation at higher doses. H, Sensitivity analysis of SA accumulation in the dLN for SA in SA-bNP and dissociated SA. I, Simulated KD versus dLN AUC for SA-bNP to determine impact of weaker dissociation constants between biotin and antigen. Curves were calculated for increasing ratios of biotin binding sites (bNP): SA to determine mitigation strategies for weaker binding constants.
Fig. 6.
Fig. 6.. In Vivo Activation of Lymphocytes:
B cell and T cell responses to SA-bNP vs SA+Saline or SA-bNP vs PLGA NP dLNs. SA-bNP vs SA+saline at 14- and 21-days: SA+saline and SA-bNP doses were equivalent at time of injection (Fig. S10). A, total live lymphocytes. B, % CD19+ B cells. C, %B220+ of CD19+ B cells. D, %CD40+ of CD19+ B cells. E, %MHCII+ of CD19+ B cells. F, MFI of MHCII within high CD19+B220+ B cells. G, schematic for B cell antigen-specific response evaluation. H, Side scatter analysis for SA+saline dLN B cell response. K, Side scatter analysis for SA-bNP dLN B cell response. I, %SA-FITC+ of CD19+ B cells. SA-bNP vs SA+PLGA NP: J, Total CD19+ cells. K, %CD25+ cells of CD19+ B cells. L, Total CD8+ T cells. M, %IFNg+ of CD8+ T cells. N, Total CD4+ T cells. O, %IFNg+ of CD4+ T cells. *, **, *** p<0.05, <0.01, <0.001 respectively, by two-tailed T-test. Non-significant values <0.10 are listed as numerical values.

Similar articles

References

    1. Graham BS, Gilman MSA, McLellan JS, Structure-Based Vaccine Antigen Design, Annu Rev Med 70 (2019) 91–104. - PMC - PubMed
    1. Ghattas M, Dwivedi G, Lavertu M, Alameh MG, Vaccine Technologies and Platforms for Infectious Diseases: Current Progress, Challenges, and Opportunities, Vaccines (Basel) 9(12) (2021) 1490. - PMC - PubMed
    1. Pulendran B, P SA, O’Hagan DT, Emerging concepts in the science of vaccine adjuvants, Nat Rev Drug Discov 20(6) (2021) 454–475. - PMC - PubMed
    1. Irvine DJ, Read BJ, Shaping humoral immunity to vaccines through antigen-displaying nanoparticles, Current opinion in immunology 65 (2020) 1–6. - PMC - PubMed
    1. Moyer TJ, Zmolek AC, Irvine DJ, Beyond antigens and adjuvants: formulating future vaccines, J Clin Invest 126(3) (2016) 799–808. - PMC - PubMed

Publication types

LinkOut - more resources