. 2023 Dec;28(1):2251237.
doi: 10.1080/13510002.2023.2251237.

Low intensity pulsed ultrasound ameliorates Adriamycin-induced chronic renal injury by inhibiting ferroptosis

Affiliations

Low intensity pulsed ultrasound ameliorates Adriamycin-induced chronic renal injury by inhibiting ferroptosis

Zhi-Qiang Ouyang et al. Redox Rep. 2023 Dec.

Abstract

Objective: It is very important to develop a new therapeutic strategy to cope with the increasing morbidity and mortality of chronic kidney disease (CKD). As a kind of physical therapy, low intensity pulsed ultrasound (LIPUS) has remarkable anti-inflammatory and repair-promoting effects and is expected to become a new therapeutic method for CKD. This study aims to clarify the treatment effect of LIPUS on CKD-related renal inflammation and fibrosis, and to further explore the potential signal network of LIPUS treatment for ameliorating chronic renal injury.

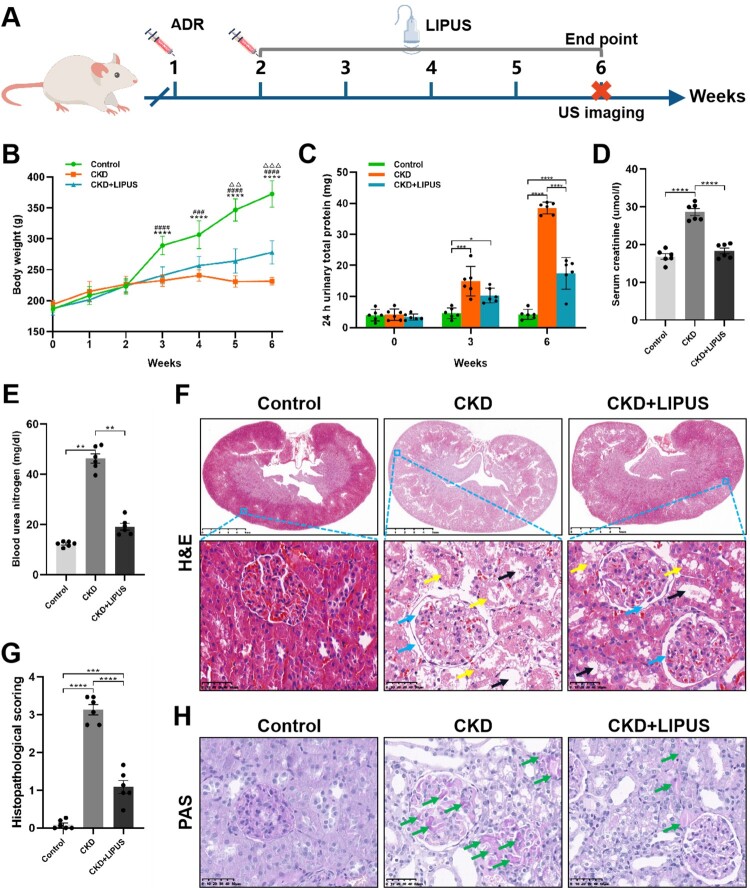
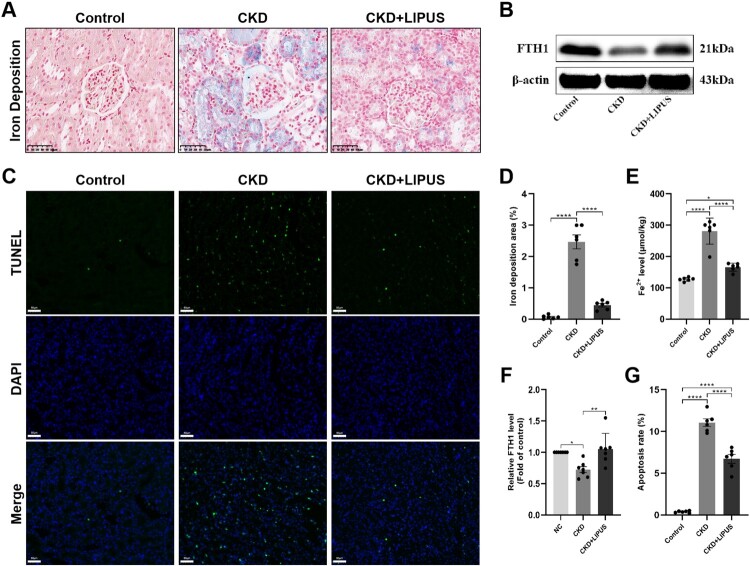
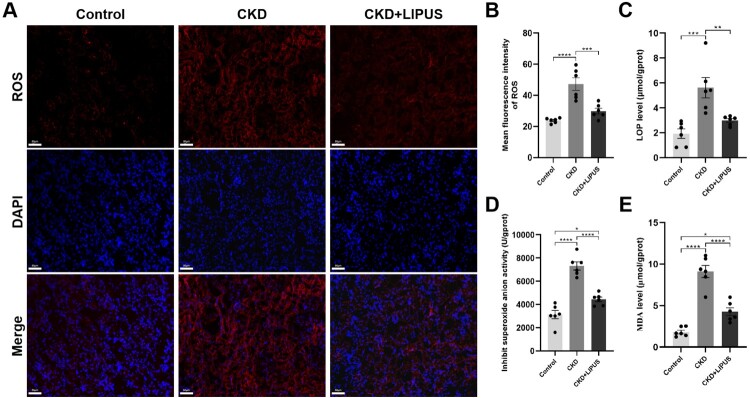
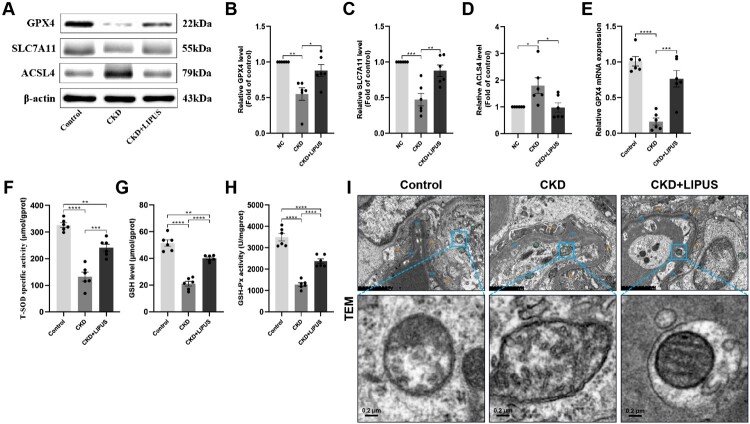
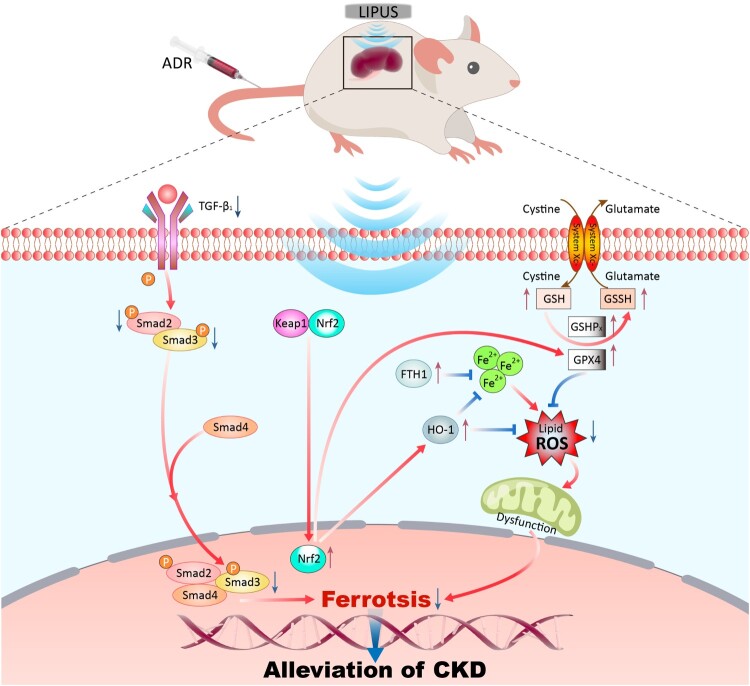
Methods: A rat model simulating the progress of CKD was established by twice tail-vein injection of Adriamycin (ADR). Under anesthesia, bilateral kidneys of CKD rats were continuously stimulated by LIPUS for four weeks. The parameters of LIPUS were 1.0 MHz, 60 mW/cm2, 50% duty cycle and 20 min/d.

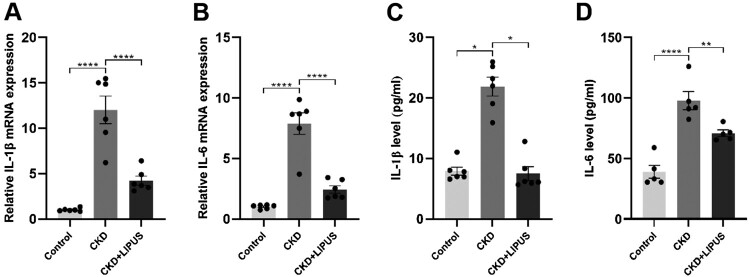
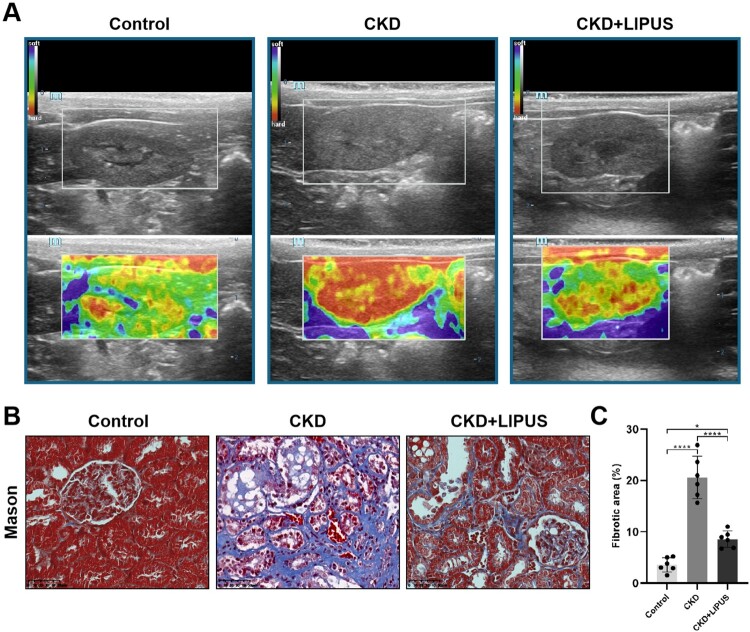
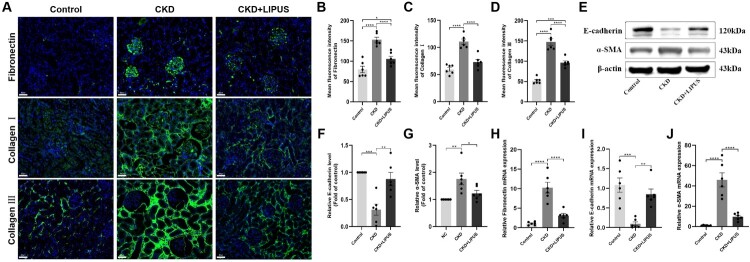
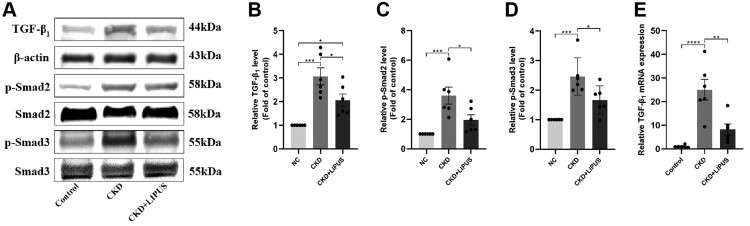
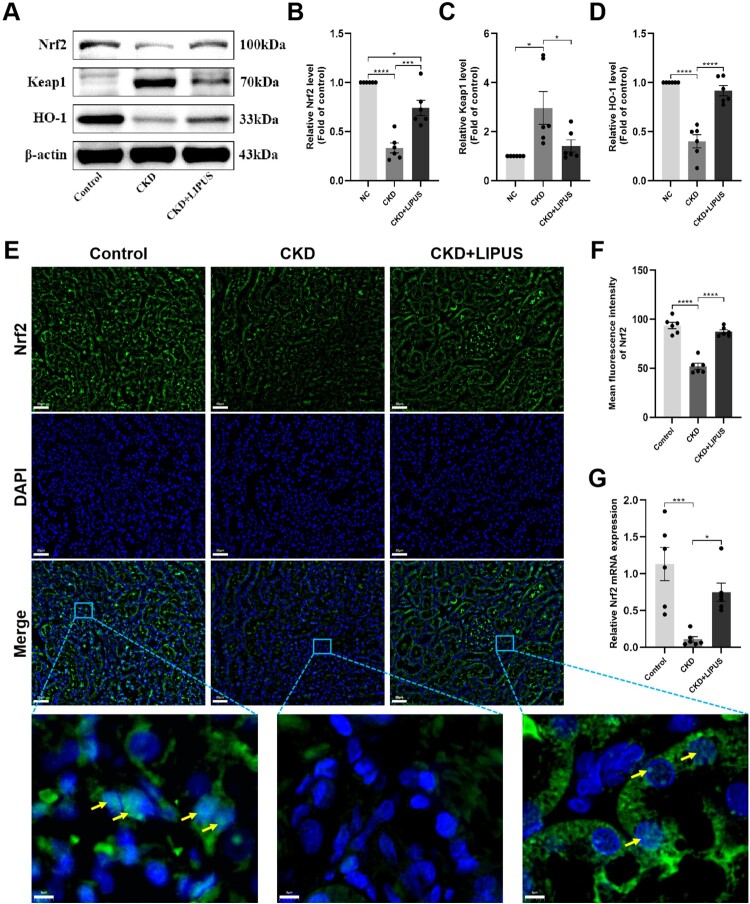
Results: LIPUS treatment effectively inhibited ADR-induced renal inflammation and fibrosis, and improved CKD-related to oxidative stress and ferroptosis. In addition, the therapeutic effect of LIPUS is closely related to the regulation of TGF-β1/Smad and Nrf2/keap1/HO-1 signalling pathways.

Discussion: This study provides a new direction for further mechanism research and lays an important foundation for clinical trials.

Keywords: Chronic kidney disease; Ferroptosis; Fibrosis; Inflammation; Low intensity pulsed ultrasound; Nrf2/keap1/HO-1 pathway; Oxidative stress; TGF-β1/Smad pathway.


Conflict of interest statement

No potential conflict of interest was reported by the author(s).

Figures

Figure 1.
Figure 1.
Treatment with LIPUS alleviated the deteriorations of renal function and pathological damage in the ADR-induced CKD rat. (A) A schematic of LIPUS treatment. (B) Changes in body weight overtime (****p < 0.0001 vs. the Control/CKD group, ###p < 0.001, ####p < 0.0001 vs. the CKD/CKD + LIPUS group, △△p < 0.01, △△△p < 0.001, vs. the Control/CKD + LIPUS group). (C) Changes of 24 h urinary total protein at the 0th, 3rd and 6th weeks. (D, E) Levels of serum creatinine and blood urea nitrogen at the 6th week. (F) Representative micrographs of haematoxylin eosin (H&E) staining in each group. Scale bar, 5 mm/50 μm. Renal histological damage including glomerular dilatation (blue arrows), tubular dilatation (black arrows), tubular epithelial injury and lumen destruction (yellow arrows). (G) Histopathological scoring. (H) Representative micrographs of periodic acid Schiff (PAS) staining in each group. Scale bar, 50 μm. Glycogen was accumulated in dilated renal glomeruli and tubules (green arrows). Data represent the mean ± standard error of the mean (SEM) for 6 rats in each group. *p < 0.05, ** p < 0.01, ***p < 0.001, **** p < 0.0001.
Figure 2.
Figure 2.
Treatment with LIPUS suppressed the expression of inflammatory factors in the ADR-induced CKD rat. The mRNA expression levels of (A) IL-1β (interleukin-1β) and (B) IL-6 (interleukin-6) in rat kidney tissue were assayed by real-time quantitative polymerase chain reaction (RT-qPCR). (C) The protein expression levels of (C) IL-1β and (D) IL-6 in rat kidney tissue were assayed by enzyme linked immunosorbent assay (ELISA). Data represent the mean ± standard error of the mean (SEM) for 6 rats in each group. *p < 0.05, ** p < 0.01, **** p < 0.0001.
Figure 3.
Figure 3.
Treatment with LIPUS ameliorated kidney hardness and renal fibrosis in the ADR-induced CKD rat. (A) Representative elastic map of each group on the classical ultrasound image in coronal views. The elastic map is colour-coded from 0 to 45 kPa, with red representing the hardest, yellow representing relatively hard, green representing relatively soft, and blue represents the softest. (B) Representative micrographs of Masson’s trichrome staining in each group. Scale bar, 50 μm. (C) Quantification of fibrotic area, expressed as a percentage of the total area. Data represent the mean ± standard error of the mean (SEM) for 6 rats in each group. *p < 0.05, **** p < 0.0001.
Figure 4.
Figure 4.
Treatment with LIPUS inhibited the expression of fibrin and fibrosis factor in the ADR-induced CKD rat. (A) The expression levels of fibronectin, collagen I and collagen III in rat kidney tissue were assayed by immunofluorescence. Scale bar, 50 μm. The absolute expression levels of fibronectin (B), collagen I (C) and collagen III (D) were quantified as the average fluorescence intensity. (E) The protein expression levels of E-cadherin and α-smooth muscle actin (α-SMA) in rat kidney tissue were assayed by western blotting (WB). Relative expression levels of E-cadherin (F) and α-SMA (G) in each group. The mRNA expression levels of fibronectin (H), E-cadherin (I) and α-SMA (J) in rat kidney tissue were proved by real-time quantitative polymerase chain reaction (RT-qPCR). Data represent the mean ± standard error of the mean (SEM) for 6 rats in each group. *p < 0.05, ** p < 0.01, ***p < 0.001, **** p < 0.0001.
Figure 5.
Figure 5.
Treatment with LIPUS improved iron deposition and apoptosis in the ADR-induced CKD rat. (A) Representative micrographs of iron staining in each group. Scale bar, 50 μm. (D) Quantification of iron deposition area, expressed as a percentage of the total area. (E) The levels of Fe2+ in rat kidney tissue were assayed by enzyme linked immunosorbent assay (ELISA). (B) The protein expression level of ferritin heavy chain 1 (FTH1) in rat kidney tissue was assayed by western blotting (WB). (F) Relative expression levels of FTH1. (C, G) Representative micrographs of TUNEL staining and result of apoptosis analysis in each group. Data represent the mean ± standard error of the mean (SEM) for 6 rats in each group. *p < 0.05, ** p < 0.01, **** p < 0.0001.
Figure 6.
Figure 6.
Treatment with LIPUS inhibited ferroptosis-related oxidative stress in the ADR-induced CKD rat. (A) Representative micrographs of reactive oxygen species (ROS) staining in each group. Scale bar, 50 μm. (B) The absolute expression level of ROS was quantified as the average fluorescence intensity. The levels of lipid peroxide (LPO) (C), superoxide anionic (O2-) (D) and malondialdehyde (MDA) (E) in rat kidney tissue were assayed by enzyme linked immunosorbent assay (ELISA). Data represent the mean ± standard error of the mean (SEM) for 6 rats in each group. *p < 0.05, ** p < 0.01, ***p < 0.001, **** p < 0.0001.
Figure 7.
Figure 7.
Treatment with LIPUS strengthened ferroptosis-related antioxidative stress and improved the function of mitochondria in the ADR-induced CKD rat. (A) The protein expression levels of glutathione peroxidase 4 (GPX4), solute carrier family 7 member (SLC7A11) and acyl-CoA synthetase long-chain family member 4 (ACSL4) in rat kidney tissue were assayed by western blotting (WB). Relative expression levels of GPX4 (B), SLC7A11 (C) and ACSL4 (D) in each group. The mRNA expression level of GPX4 (E) in rat kidney tissue were proved by real-time quantitative polymerase chain reaction (RT-qPCR). The levels of total superoxide dismutase (T-SOD) (F), glutathione (GSH) (G) and glutathione peroxidase (GSH-Px) (H) in rat kidney tissue were assayed by enzyme linked immunosorbent assay (ELISA). (I) Ultrastructural alterations of tubular epithelial cells (TECs) were analysed using transmission electron microscopy. scale bar, 2.0μm/0.2μm. Abbreviations: BM, basement membrane; FP, foot process; M, mitochondria. Data represent the mean ± standard error of the mean (SEM) for 6 rats in each group. *p < 0.05, ** p < 0.01, ***p < 0.001, **** p < 0.0001.
Figure 8.
Figure 8.
Treatment with LIPUS regulated TGF-β1/Smad pathway. (A) The protein expression levels of TGF−β1, phosphorylated Smad2 (p-Smad2) and phosphorylated Smad3 (p-Smad3) in rat kidney tissue were assayed by western blotting (WB). Relative expression levels of TGF−β1 (B), p-Smad2 (C) and p-Smad3 (D) in each group. The mRNA expression level of TGF−β1 (E) in rat kidney tissue were proved by real-time quantitative polymerase chain reaction (RT-qPCR). Data represent the mean ± standard error of the mean (SEM) for 6 rats in each group. *p < 0.05, ** p < 0.01, ***p < 0.001, **** p < 0.0001.
Figure 9.
Figure 9.
Treatment with LIPUS regulated Nrf2/Keap1/HO-1 signalling pathway by promoting the expression of NRF 2 and nuclear translocation. (A) The protein expression levels of nuclear factor erythroid 2-related factor 2 (Nrf2), kelch-like ECH-associated protein 1 (Keap1) and haeme oxygenase-1 (HO-1) in rat kidney tissue were assayed by western blotting (WB). Relative expression levels of Nrf2 (B), Keap1 (C) and HO-1 (D) in each group. (E) The expression level and nuclear translocation (yellow arrows) of Nrf2 detected by immunofluorescence. Scale bar, 50 μm/5μm. (G) The mRNA expression level of Nrf2 in rat kidney tissue were proved by RT-qPCR. Data represent the mean ± standard error of the mean (SEM) for 6 rats in each group. *p < 0.05, ***p < 0.001, **** p < 0.0001.
Figure 10.
Figure 10.
Schematic diagram of LIPUS treating CKD by inhibiting ferroptosis through regulating the TGF-β1/Smad and the Nrf2/Keap1/HO-1 signalling pathway

References

    1. Global, regional, and national burden of chronic kidney disease, 1990-2017: a systematic analysis for the Global Burden of Disease Study 2017 . Lancet. 2020;395(10225):709–733. doi:10.1016/S0140-6736(20)30045-3 - DOI - PMC - PubMed
    1. Xie Y, Bowe B, Mokdad AH, et al. . Analysis of the global burden of disease study highlights the global, regional, and national trends of chronic kidney disease epidemiology from 1990 to 2016. Kidney Int. 2018;94(3):567–581. doi:10.1016/j.kint.2018.04.011 - DOI - PubMed
    1. Stenvinkel P, Heimbürger O, Paultre F, et al. . Strong association between malnutrition, inflammation, and atherosclerosis in chronic renal failure. Kidney Int. 1999;55(5):1899–1911. doi:10.1046/j.1523-1755.1999.00422.x - DOI - PubMed
    1. Meng XM, Nikolic-Paterson DJ, Lan HY.. Inflammatory processes in renal fibrosis. Nat Rev Nephrol. 2014;10(9):493–503. doi:10.1038/nrneph.2014.114 - DOI - PubMed
    1. Ying S, Tan M, Feng G, et al. . Low-intensity pulsed ultrasound regulates alveolar bone homeostasis in experimental periodontitis by diminishing oxidative stress. Theranostics. 2020;10(21):9789–9807. doi:10.7150/thno.42508 - DOI - PMC - PubMed

Substances