. 2023 Aug 31;14(1):5303.
doi: 10.1038/s41467-023-40741-9.

Portosystemic shunt placement reveals blood signatures for the development of hepatic encephalopathy through mass spectrometry

Affiliations

Portosystemic shunt placement reveals blood signatures for the development of hepatic encephalopathy through mass spectrometry

Ana Carolina Dantas Machado et al. Nat Commun. .

Abstract

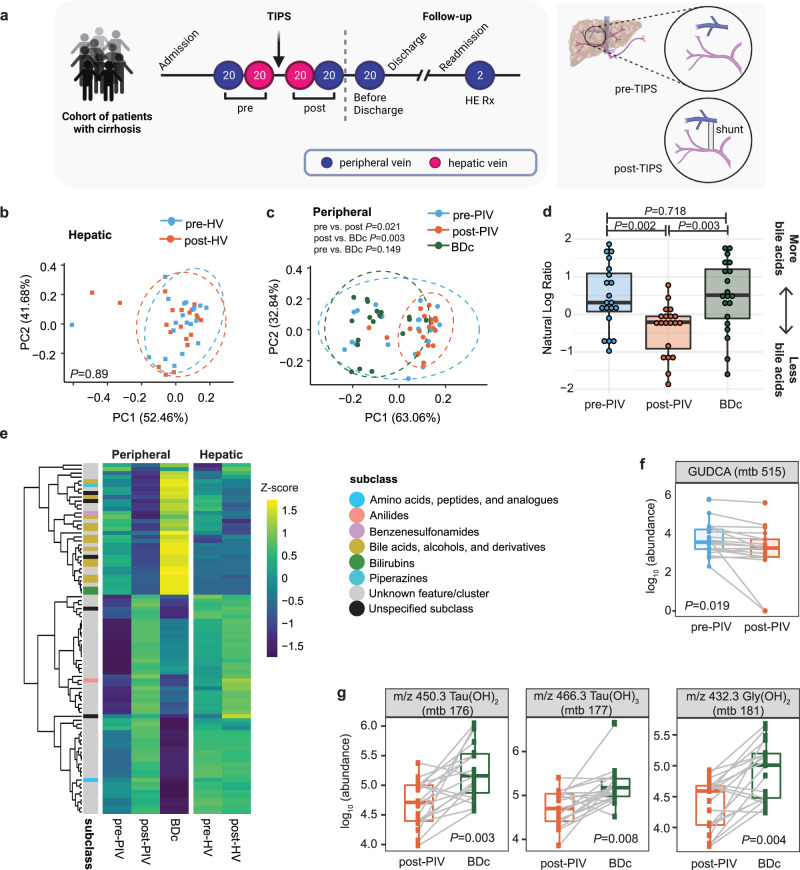
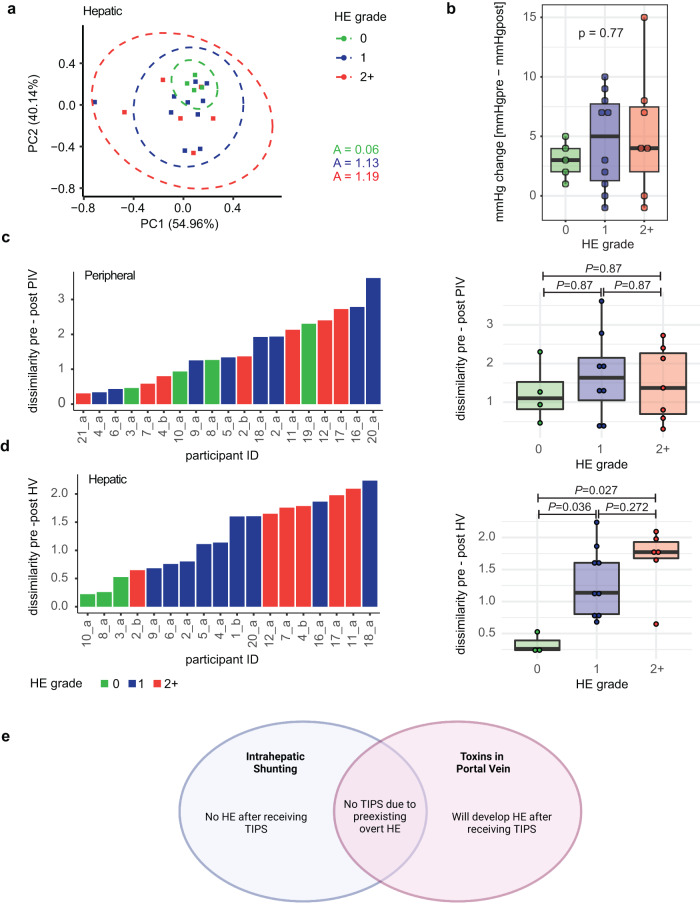
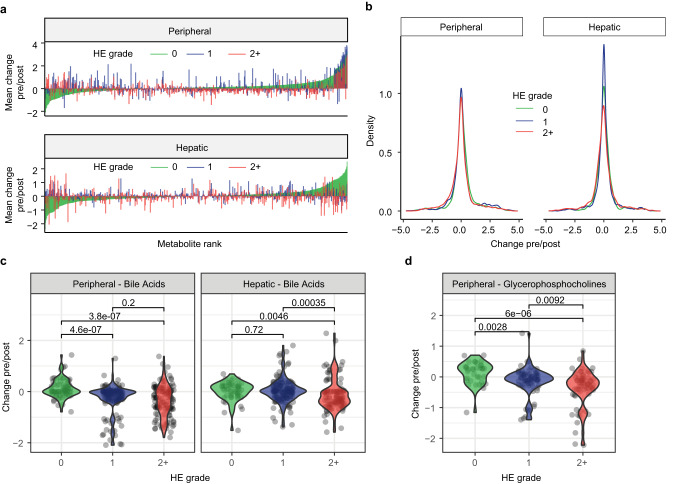
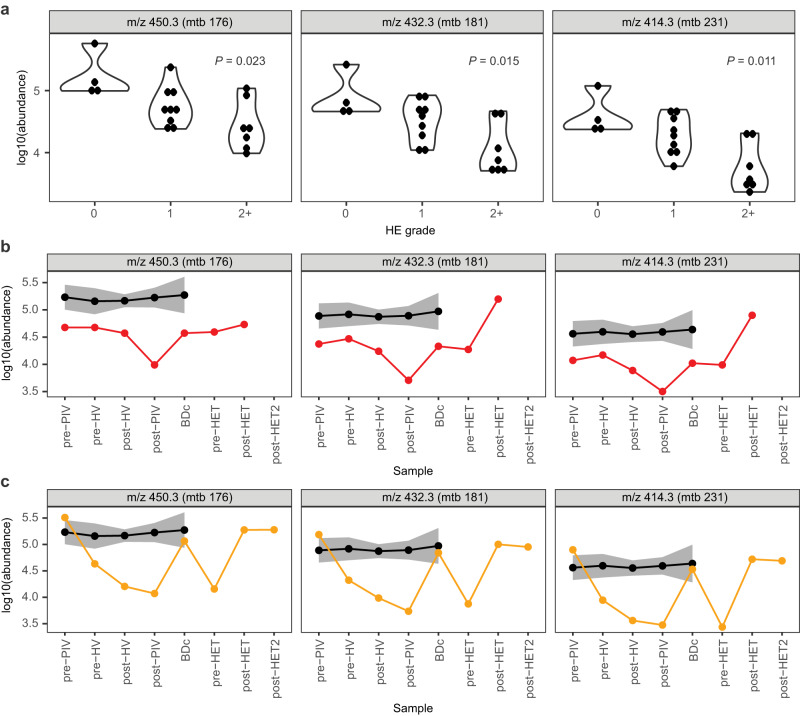
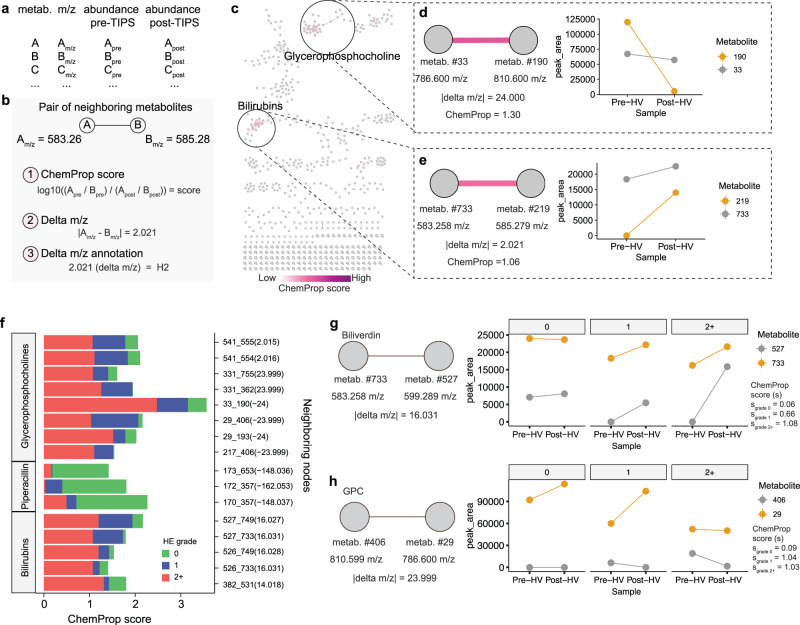
Elective transjugular intrahepatic portosystemic shunt (TIPS) placement can worsen cognitive dysfunction in hepatic encephalopathy (HE) patients due to toxins, including possible microbial metabolites, entering the systemic circulation. We conducted untargeted metabolomics on a prospective cohort of 22 patients with cirrhosis undergoing elective TIPS placement and followed them up to one year post TIPS for HE development. Here we suggest that pre-existing intrahepatic shunting predicts HE severity post-TIPS. Bile acid levels decrease in the peripheral vein post-TIPS, and the abundances of three specific conjugated di- and tri-hydroxylated bile acids are inversely correlated with HE grade. Bilirubins and glycerophosphocholines undergo chemical modifications pre- to post-TIPS and based on HE grade. Our results suggest that TIPS-induced metabolome changes can impact HE development, and that pre-existing intrahepatic shunting could be used to predict HE severity post-TIPS.


Conflict of interest statement

Am.Z. is a co-founder, acting chief medical officer, and equity-holder in Endure Biotherapeutics. P.C.D. is a scientific advisor and holds equity to Cybele and a Co-founder, advisor and holds equity in Ometa, Arome and Enveda with prior approval by UC-San Diego and consulted in 2023 for DSM animal health. A.A.A. is a founder of Arome Science Inc. The remaining authors declare no competing interests.

Figures

Fig. 1
Fig. 1. The effect of TIPS placement on the hepatic and peripheral metabolomes.
a Blood sample collection design. Peripheral vein (purple) and hepatic vein (pink) blood samples were collected pre- and post-TIPS, and following readmission for HE treatment. Visual of the location a shunt is placed during TIPS. Created with Biorender.com. b, c Robust principal component analysis (RPCA) showing metabolome dissimilarities across participants in (b) pre-hepatic vein (sky blue squares) and post-hepatic vein (orange squares) samples and (c) pre-peripheral vein (sky blue circles), post-peripheral vein (orange circles), and before discharge (green circles) samples. d The natural log ratio of bile acids to bilirubins (pairwise Wilcoxon, FDR corrected at q-value 0.05, n = 20 participants). e Heatmap showing the 87 unique metabolites that were significantly different between at least two of the three timepoints (paired two-sided Wilcoxon, FDR corrected at q-value 0.1); 25 unique metabolites significantly different pre vs. post-TIPS and 84 significantly different post-peripheral vein vs. before discharge (FDR < 0.1). f Pre- vs. post-peripheral vein levels of GUDCA, (paired two-sided Wilcoxon P = 0.019, n = 19 participants). g Examples of bile acids that were significantly different post-peripheral vein vs. before discharge (paired two-sided Wilcoxon, FDR corrected at q-value 0.05, n = 19 participants). (GUDCA=Glycoursodeoxycholic acid; m/z 450.3 Tau(OH)2 (mtb 176), m/z 466.3 Tau(OH)3 (mtb 177), and m/z 432.3 Gly(OH)2 (mtb 181) are annotated as bile acids through suspect library matching). The boxplots show median and upper and lower quartiles. The extreme lines show the highest and lowest value. The boxplot is overlaid with the visualization of single observations. Colors represent samples collected at different time points: sky blue (pre-TIPS); orange (post-TIPS); green (before discharge). PIV=peripheral vein; HV = hepatic vein; BDc = before discharge. Source data are provided as a Source Data file.
Fig. 2
Fig. 2. TIPS placement effect on metabolite patterns based on HE severity.
a RPCA plot showing metabolome dissimilarities across participants post-TIPS in hepatic vein samples stratified by HE grade. A is the area within the ellipsis. b Pressure change was calculated as the difference between direct portal vein pressure measurements pre- and post-TIPS (Kruskal–Wallis test, n = 22 participants). Comparison of the (c) peripheral vein (n = 19 participants) and (d) hepatic vein (n = 18 participants) dissimilarity distances pre- to post-TIPS for each participant based on HE grade. Left: a ranked bar plot showing the (c) pre- to post-peripheral vein or (d) pre- to post-hepatic vein dissimilarity distances for each participant. Right: boxplot showing the same data but grouped by participant HE grade (pairwise Wilcoxon, FDR corrected at q-value 0.05). Dissimilarity is defined as the robust Aitchison β-diversity calculated with DEICODE. HE grade: 0 = none (green); 1 = mild (blue); 2+ = severe (red). The boxplots show median and upper and lower quartiles. The extreme lines show the highest and lowest value. The boxplot is overlaid with the visualization of single observations. e Theoretical framework on the relationship between intrahepatic shunting, portal neurotoxins, and development of HE. Created with Biorender.com. PIV peripheral vein; HV hepatic vein; BDc before discharge. Source data are provided as a Source Data file.
Fig. 3
Fig. 3. Change from baseline (pre/post) for individual metabolites.
a Mean change in pre/post abundance for each metabolite based on HE grade for peripheral or hepatic vein samples. Features are ordered in ascending order for HE grade “0” group. b Density plot of the change pre/post in metabolite abundances of each participant based on HE grade. Kolmogorov–Smirnov test peripheral: 0 vs 2+, P = 1.3e−13; 0 vs 1, P = 1.0e−03; 1 vs 2+, P = 2.4e−09; hepatic: 0 vs 2+, P = 5.7e−08; 0 vs 1, P = 0.08; 1 vs 2+, P = 2.2e−16. Change pre/post TIPS for bile acids (peripheral and hepatic vein samples) (c) and glycerophosphocholines (peripheral samples) (d) between participants based on their HE grade (0, 1, or 2+). Change pre/post is defined as the log10(abundancepost/abundancepre) for each participant’s metabolites. HE grade: 0 = none (green); 1 = mild (blue); 2+ = severe (red). Source data are provided as a Source Data file.
Fig. 4
Fig. 4. Levels of bile acids in plasma of TIPS participants based on HE grade.
a Bile acid levels and significant abundance differences in the post-TIPS peripheral blood based on HE grade. HE grade: 0=none; 1=mild; 2 + =severe (Kruskal-Wallis test, FDR < 0.2). Longitudinal levels of bile acids in two participants readmitted with HE grade 2+ represented by red (b, participant 11_a) and orange (c, participant 12_a) compared to participants with HE grade 0 (black line, n = 4; shaded areas represent SEM). PIV peripheral vein, HV hepatic vein, BDc before discharge, HET hepatic encephalopathy treatment. Source data are provided as a Source Data file.
Fig. 5
Fig. 5. Chemical proportionality of neighboring metabolites pre- to post-TIPS placement.
a, b Schematic representation of the (a) quantification table from FBMN and (b) data that can be deduced from neighboring metabolites, including the ChemProp score, which is calculated as the log-ratio of two neighboring metabolites pre- and post-TIPS. c Network representation of hepatic ChemProp scores highlighting high-scoring clusters. d, Specific examples of metabolite pairs within (d) glycerophosphocholines (GPC) and (e) bilirubins clusters that display high ChemProp scores. Metabolite ID and m/z are shown for metabolites, and associated delta m/z shown for metabolite pairs. f ChemProp scores for pairs of neighboring metabolites that diverged the most on their scores based on HE grade. PIV peripheral vein, HV hepatic vein. g, h Examples of 2 metabolite pairs (within bilirubin and glycerophosphocholine subclasses) from panel (f) with divergent ChemProp scores based on HE grade. Median is shown for specific metabolites at each timepoint. HE grade: 0 = none (green); 1 = mild (blue); 2+ = severe (red). Source data are provided as a Source Data file.

Update of

Similar articles

Cited by

References

    1. Madsen M, Kimer N, Bendtsen F, Petersen AM. Fecal microbiota transplantation in hepatic encephalopathy: a systematic review. Scand. J. Gastroenterol. 2021;56:560–569. - PubMed
    1. Wijdicks, E. F. M. Hepatic encephalopathy. N. Engl. J. Med. 10.1016/j.mcna.2008.03.009 (2016).
    1. Häussinger D, et al. Hepatic encephalopathy. Nat. Rev. Dis. Primer. 2022;8:43. - PubMed
    1. Sanyal AJ, Bosch J, Blei A, Arroyo V. Portal hypertension and its complications. Gastroenterology. 2008;134:1715–1728. - PubMed
    1. Nakamura T, et al. Physiologic measurement of intrahepatic shunted blood flow by means of D-galactose-1C14. Angiology. 1971;22:344–353. - PubMed

Publication types

Substances