. 2023 Aug 31;14(1):5291.
doi: 10.1038/s41467-023-41117-9.

Antibody-mediated neutralization of galectin-3 as a strategy for the treatment of systemic sclerosis

Affiliations

Antibody-mediated neutralization of galectin-3 as a strategy for the treatment of systemic sclerosis

Céline Ortega-Ferreira et al. Nat Commun. .

Abstract

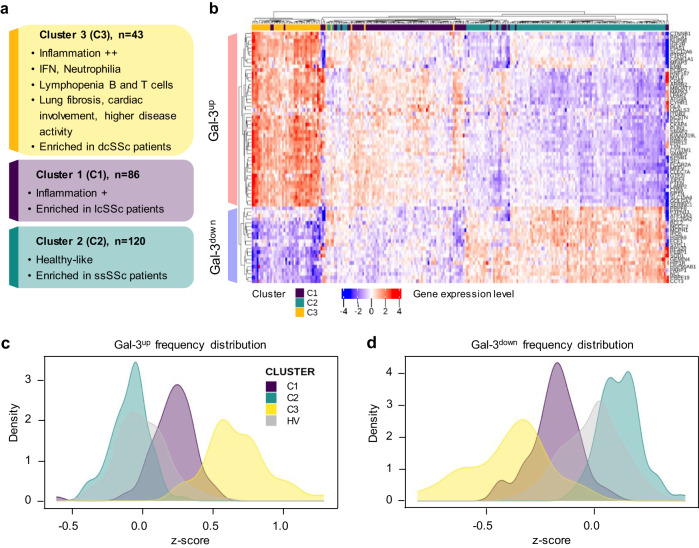
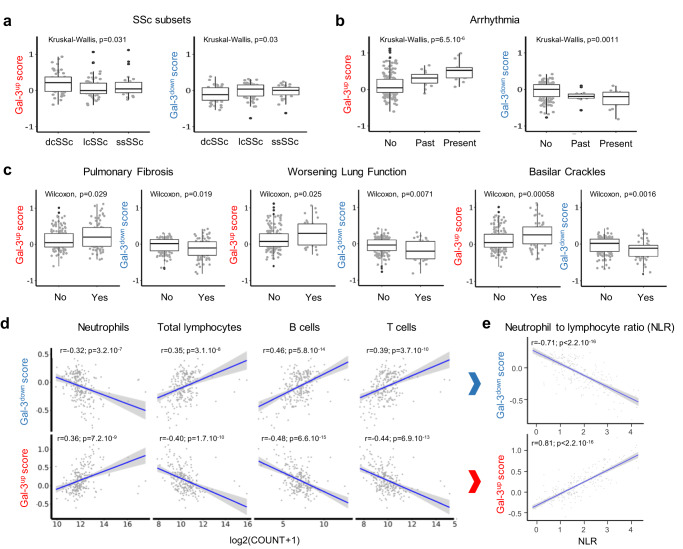
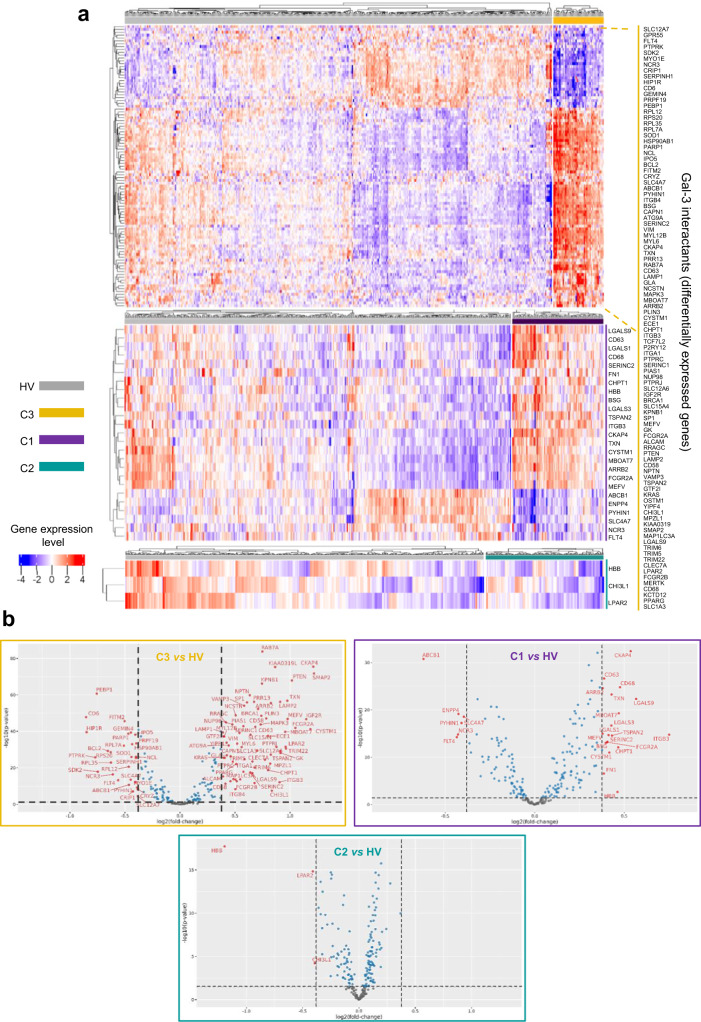
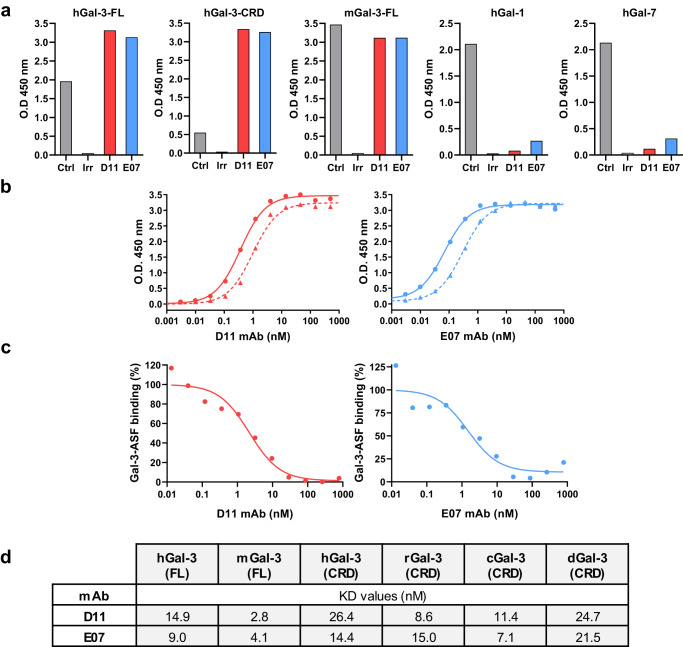
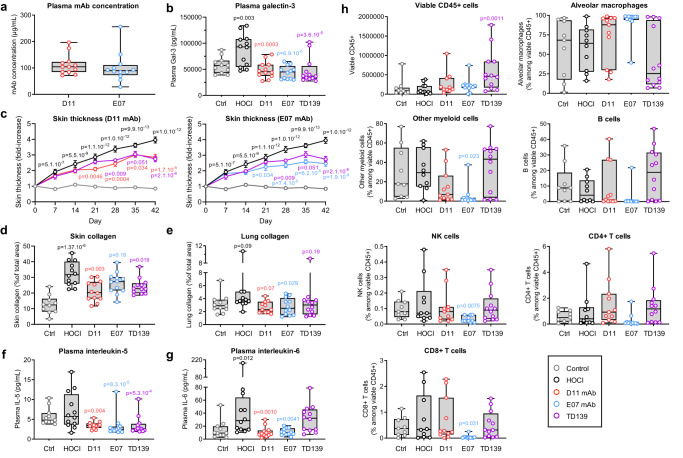
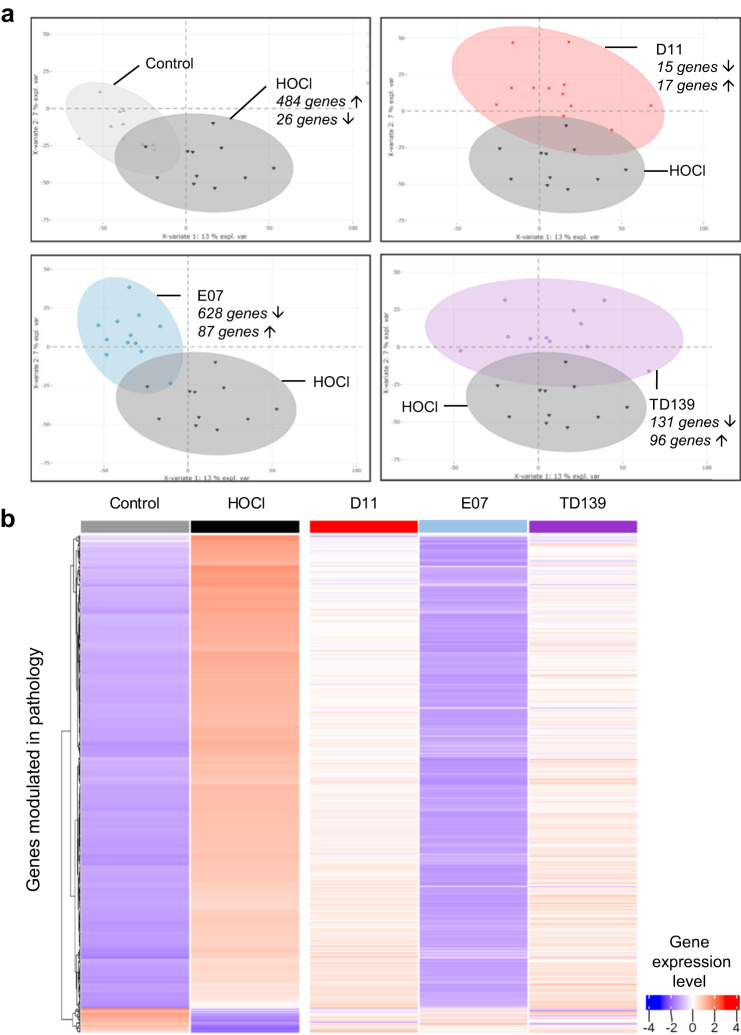
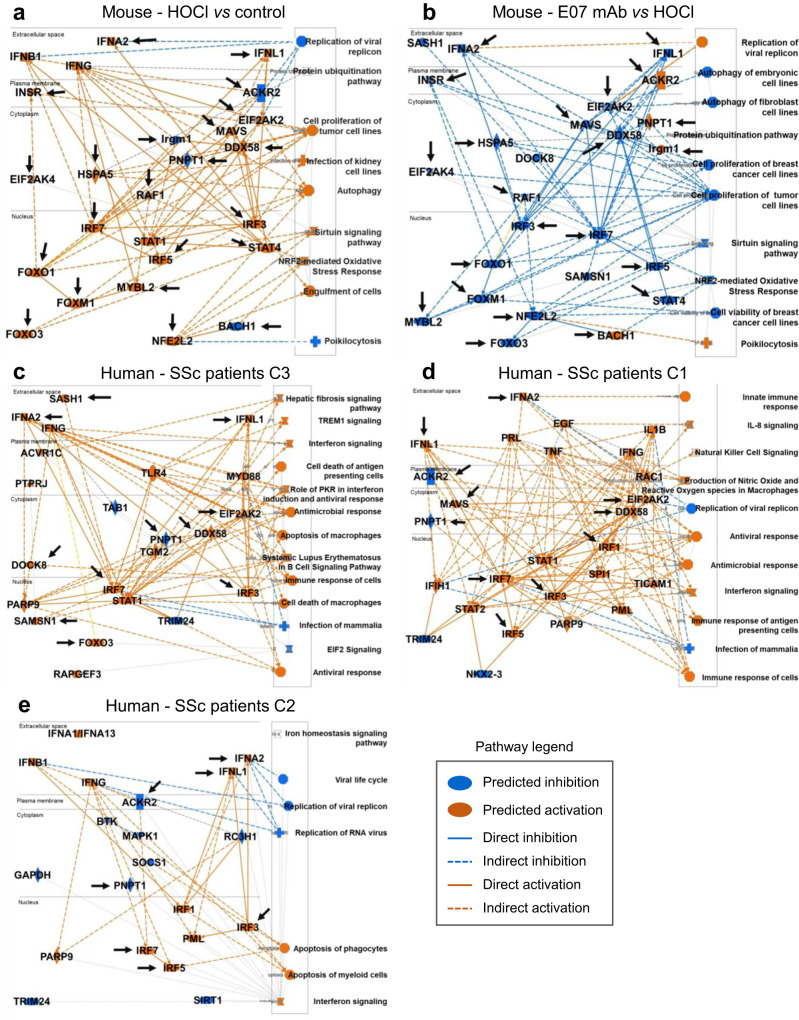
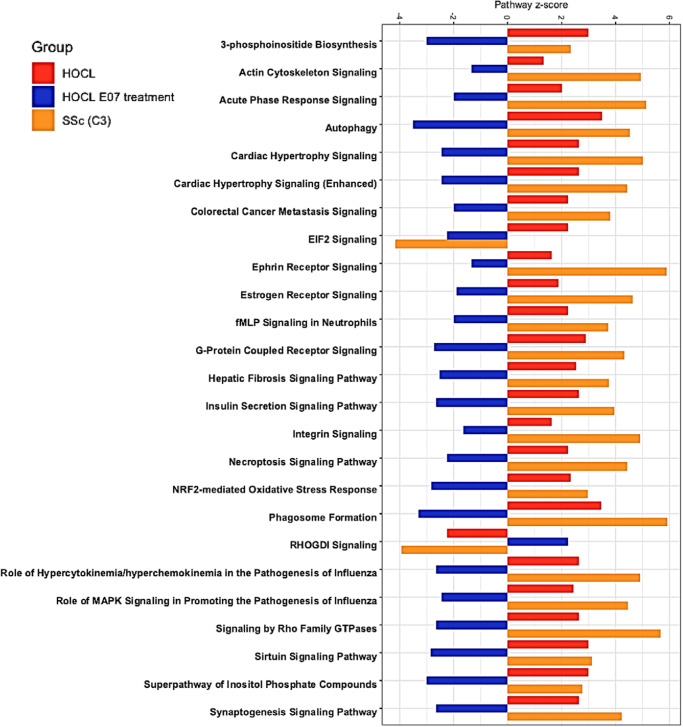
Systemic sclerosis (SSc) is an autoimmune, inflammatory and fibrotic disease with limited treatment options. Developing new therapies is therefore crucial to address patient needs. To this end, we focused on galectin-3 (Gal-3), a lectin known to be associated with several pathological processes seen in SSc. Using RNA sequencing of whole-blood samples in a cross-sectional cohort of 249 patients with SSc, Gal-3 and its interactants defined a strong transcriptomic fingerprint associated with disease severity, pulmonary and cardiac malfunctions, neutrophilia and lymphopenia. We developed new Gal-3 neutralizing monoclonal antibodies (mAb), which were then evaluated in a mouse model of hypochlorous acid (HOCl)-induced SSc. We show that two of these antibodies, D11 and E07, reduced pathological skin thickening, lung and skin collagen deposition, pulmonary macrophage content, and plasma interleukin-5 and -6 levels. Moreover, E07 changed the transcriptional profiles of HOCl-treated mice, resulting in a gene expression pattern that resembled that of control mice. Similarly, pathological pathways engaged in patients with SSc were counteracted by E07 in mice. Collectively, these findings demonstrate the translational potential of Gal-3 blockade as a therapeutic option for SSc.


Conflict of interest statement

Servier is the owner of the described therapeutic Gal-3 mAbs for which a patent application (EP22305372) has been filed. G.R., M.L.G., and J.S. are regular employees of Mabqi, a company providing contract research services and having received fees from Servier for the generation of Gal-3 neutralizing mAbs (contract number CT0081211). D.L., S.S., M.J., and T.G. are employees of the Université de Lille, which received fees from Servier for conducting evaluations in the HOCl model (contract number CT0089360). D.L. is or has been a consultant for Actelion, Boehringer Ingelheim, Octapharma, CSL Behring, Takeda, and Servier. The following authors: C.O., P.S., S.H., L.C., A.C., S.B., E.N., B.N., B.F., A.L., F.L., S.E., S.C., N.P., T.Q.N., and F.D. were regular employees of Servier at the time the research project. E.D. was a Ph.D student financed by Servier at the time of the research project. J.V. was a post-doc financed by Servier at the time of the research project.

Figures

Fig. 1
Fig. 1. Molecular characterization of SSc patient clusters and their Gal-3 fingerprint.
a Description of patient clusters C1, C2, and C3 characteristics based on their main molecular pathways and clinical features. b Gene expression heatmap of the top 69 Gal-3 interactants allowing to discriminate SSc patients clusters from each other (C3, yellow: n = 43; C1, purple: n = 86; C2, turquoise: n = 120). Gene expression intensities are displayed as colors ranging from blue for the lowest expression level to red for the highest expression level as shown in the key. Each individual subject is represented by one vertical line. Differentially expressed Gal-3 interactants are represented by individual horizontal lines and listed on the right. c, d Frequency distribution plots of Gal-3up (c) and Gal-3down (d) scores for each SSc patient cluster and healthy volunteers (HV). dcSSc, lcSSc, and ssSSc, diffuse cutaneous, limited cutaneous, and sine scleroderma systemic sclerosis, respectively.
Fig. 2
Fig. 2. Association between SSc patient subsets, impaired cardiac and lung functions, immune cell populations, and Gal-3 scores.
a Association between Gal-3up and Gal-3down scores and SSc patients subsets collected for 141 patients (dcSSc, diffuse cutaneous SSc: n = 49; lcSSc, limited cutaneous SSc: n = 64; ssSSc, sine scleroderma SSc: n = 28). b Association between Gal-3up and Gal-3down scores and cardiac arrythmia collected for 223 patients: no 194; past 15; present 14). c Association between Gal-3up and Gal-3down scores and lung dysfunction assessed by pulmonary fibrosis (data collected for 231 patients: no 145; yes 86), worsening lung function (data collected for 221 patients: no 185; yes 36), and basilar crackles (data collected for 248 patients: no 189; yes 59). Results in ac are depicted as boxes and whiskers plots defined by minimal, maximal, and median values in each dataset. The upper whisker extends from the hinge to the largest value no further than 1.5 * IQR from the hinge (where IQR is the inter-quartile range or distance between the first and third quartiles). The lower whisker extends from the hinge to the smallest value at most 1.5 * IQR of the hinge. Data beyond the end of the whiskers are called outlying points and are plotted individually. Statistical analyses were performed using the Kruskal–Wallis test (a, b) or the two-sided Wilcoxon test (c). d Correlation between Gal-3up and Gal-3down scores and blood immune cell populations. Data were collected from n = 211 patients. e Correlation between Gal-3up and Gal-3down scores and neutrophil to lymphocyte ratio calculated from d. Two-sided Pearson’s correlation coefficient was used for statistical analyses performed on log-transformed data in d and e, using a linear regression model (blue line) and a 95% confidence interval represented by the gray area. All p-values are reported in each panel.
Fig. 3
Fig. 3. Gene expression heatmap and volcano plots of Gal-3 interactants differentially expressed between each SSc patient cluster and healthy volunteers (HV).
a Heatmap, gene expression intensities are displayed as colors ranging from blue for the lowest expression level to red for the highest expression level as shown in the key. Healthy volunteers (HV) are represented by the gray bar, and patients of the C3 (n = 43), C1 (n = 86), and C2 (n = 120) clusters are represented by the yellow (top figure), purple (middle figure) and turquoise (bottom figure) bars, respectively. Each individual subject is represented by one vertical line. Differentially expressed Gal-3 interactants are represented by individual horizontal lines and listed on the right. b Volcano plot representations of Gal-3 interactants differentially expressed between C3 and HV (upper left panel), C1 and HV (upper right panel), and C2 and HV (bottom panel). The horizontal dotted line indicates the p-value cut-off (FDR 1.3). The vertical dotted lines indicate the fold-change cut-off values (minus 1.3 and plus 1.3). Gray dots represent the genes below the p-value and fold-change cut-off values; blue dots represent the genes fulfilling the p-value criterion but not the expected fold-change cut-off; red dots represent genes fulfilling all statistical requirements and correspond to genes identified as ‘differentially expressed’. The detailed list of Gal-3 interactants differentially expressed between each cluster and HV is presented in Supplementary Data 2.
Fig. 4
Fig. 4. Binding characteristics of D11 and E07 mAbs to Gal-3, Gal-1, and Gal-7.
a Binding of D11 and E07 mAbs to human (h) and mouse (m) Gal-3 constructs (FL, full-length; CRD, carbohydrate recognition domain) and their selectivity towards human Gal-1 and Gal-7, measured by ELISA. Each mAb (D11, red; E07, blue) was tested at 20 µg/mL, and the appropriate positive control (commercial antibody against Gal-3, Gal-1, or Gal-7; Ctrl, gray bars) was used at 5 µg/mL. An irrelevant IgG (Irr) was used as a negative control for each assay. b Dose–response ELISA of D11 and E07 mAbs binding to hGal-3 (solid lines) and mGal-3 (dotted lines). c Dose–response competition between asialofetuin (ASF) and D11 and E07 mAbs to hGal-3. d KD values of D11 and E07 mAbs to recombinant Gal-3 from multiple species (h, human; m, mouse; r, rat; c, cynomolgus; d, dog) by SPR. Data are representative of one experiment performed during the anti-Gal-3 IgG selection flow scheme.
Fig. 5
Fig. 5. Efficacy of anti-Gal-3 treatments in the mouse model of HOCl-induced SSc.
Control (Ctrl, light gray open circles) and HOCl (dark open circles) groups represent vehicle-receiving and pathology-induced mice, respectively. D11 (red open circles), E07 (blue open circles) and TD139 (purple open circles) groups represent anti-Gal-3 treatments administered in HOCl-induced mice as described in the Methods section. Data are representative of one experiment conducted with 11 biologically independent mice for the control group and n = 12 biologically independent mice for all other groups, except in specific cases due to experimental sample loss or unavailability, as detailed in the source data file. a Plasma Gal-3 exposure of mAbs at termination day. b Plasma Gal-3 levels measured at termination day. c Longitudinal measurements of skin thickness by external caliper. d, e Assessment of collagen deposition by Picrosirius red staining of skin and lung tissue. f, g Plasma levels of IL-5 and IL-6 measured by multiplex cytokine assay at termination day; h FACS immunophenotyping analysis of immune cells in the bronchoalveolar fluid at termination day. All results are depicted as boxes and whiskers plots defined by minimal, maximal, and median values in each dataset, except in c, for which means ± sem values are shown. Statistical analyses in e and h were performed on log-transformed data using a one-way ANOVA for comparison between the HOCl and control group, and with a one-way ANOVA for comparison between all tested items and their HOCl control group, using Dunnett’s adjustment. A similar analysis was performed in d, without log transformation. Statistical analyses in b, f, and g were performed on log-transformed data using a mixed ANCOVA model for comparison between the HOCl and control group, and using a mixed ANCOVA model for comparison between all tested items and their HOCl control group, using Dunnett’s adjustment. Statistical analyses in c were performed using a repeated measures ANOVA for comparison between the HOCl and control group, and with a one-way ANOVA for comparison between all tested items and their HOCl control group, using Dunnett’s adjustment. The baseline (day minus one) was added as covariable.
Fig. 6
Fig. 6. Whole-blood cells RNAseq analysis of anti-Gal-3 treatments in the mouse model of HOCl-induced SSc.
a Partial least-squares-discriminant analysis (PLS-DA) of differential gene expression between HOCl-induced (dark gray) and untreated (control, light gray) group, or HOCl-induced groups treated with D11 (red), E07 (blue) or TD139 (purple), and HOCl untreated group. The number of upregulated (up arrow) or downregulated (down arrow) genes with false discovery rate (FDR) below 0.05 and absolute fold-change (FC) above 1.3 refers to each relevant comparative analysis. b Gene expression heatmap showing the 510 genes differentially expressed between the HOCl-induced and control groups, and their modulation by each anti-Gal-3 treatment. Each column represents the mean relative gene expression levels of n = 11 (control) or n = 12 (HOCl, D11, E07, TD139) mice per group. Each gene is represented by one horizontal line. Gene expression intensities are displayed as colors ranging from blue for the lowest expression level to red for the highest expression level as shown in the key. The relative FC and FDR values are reported in Supplementary Data 3.
Fig. 7
Fig. 7. Ingenuity pathway prediction analysis of Gal-3 entities modulated in the mouse model of HOCl-induced SSc and in patients with SSc.
a Prediction of entities modulated in HOCl-treated versus untreated control mice. b Prediction of entities modulated by E07 mAb treatment versus control HOCl-induced mice. Orange and blue colors indicate predicted activation or inhibition, respectively, as indicated in the key legend code. Black arrows in a and b indicate entities found in common and inversely modulated in both conditions. ce Prediction of entities modulated in SSc patients of the PRECISESADS cohort. The three graphical summaries depict entities modulated in cluster 3 (c), 1 (d), and 2 (e), respectively. Black arrows in ce indicate entities modulated in these patients and found to be inversely modulated by E07 mAb in the mouse model of HOCl-induced SSc (b).
Fig. 8
Fig. 8. Top 25 most representative canonical pathways modulated by E07 mAb in the mouse model of HOCl-induced SSc and in C3 SSc patients.
Horizontal bars represent z-score values for each canonical pathway (below 0, inhibited, above 0, activated) for each condition. Red, HOCl-induced mice versus untreated control mice; Blue, HOCl-induced mice versus HOCl-induced mice treated with E07 mAb; Orange, systemic sclerosis patients, cluster 3 versus healthy volunteers of the PRECISESADS cohort.

References

    1. Dumic J, Dabelic S, Flögel M. Galectin-3: an open-ended story. Biochim. Biophys. Acta. 2006;1760:616–635. - PubMed
    1. Funasaka T, Raz A, Nangia-Makker P. Galectin-3 in angiogenesis and metastasis. Glycobiology. 2014;24:886–891. - PMC - PubMed
    1. Dong R, et al. Galectin-3 as a novel biomarker for disease diagnosis and a target for therapy (Review) Int. J. Mol. Med. 2018;41:599–614. - PMC - PubMed
    1. Joeh E, et al. Mapping glycan-mediated galectin-3 interactions by live cell proximity labeling. Proc. Natl Acad. Sci. (USA) 2020;117:27329–27338. - PMC - PubMed
    1. Slack RJ, Mills R, Mackinnon AC. The therapeutic potential of galectin-3 inhibition in fibrotic disease. Int. J. Biochem. Cell. Biol. 2021;130:105881. - PubMed

Publication types