. 2023 Aug 31;13(1):14308.
doi: 10.1038/s41598-023-41040-5.

Human milk oligosaccharides modulate the intestinal microbiome of healthy adults

Affiliations

Human milk oligosaccharides modulate the intestinal microbiome of healthy adults

Jonathan P Jacobs et al. Sci Rep. .

Abstract

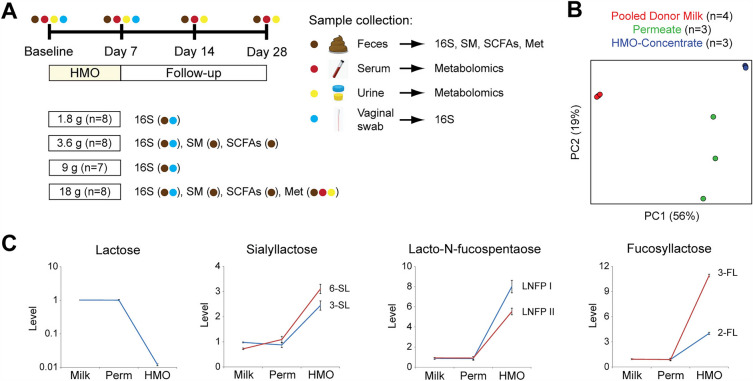
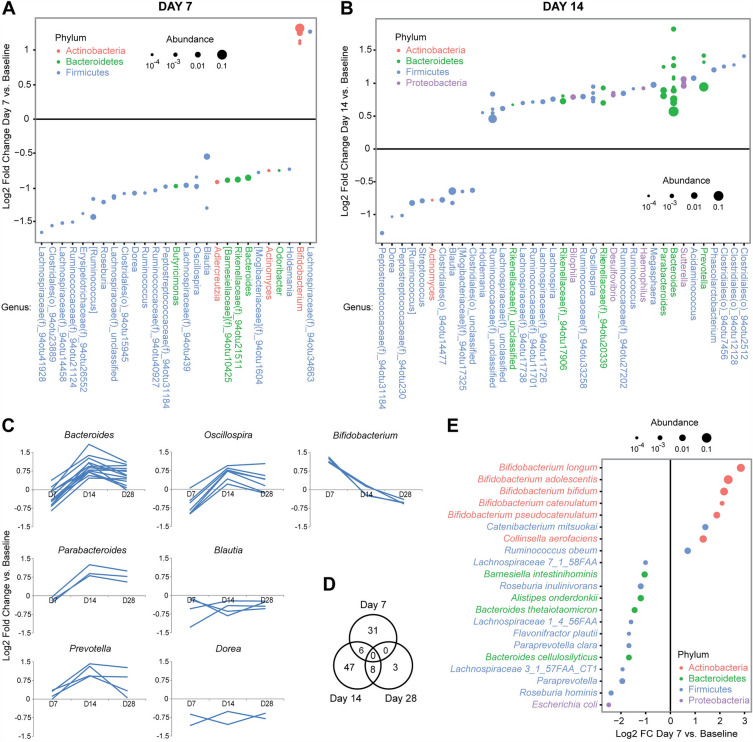
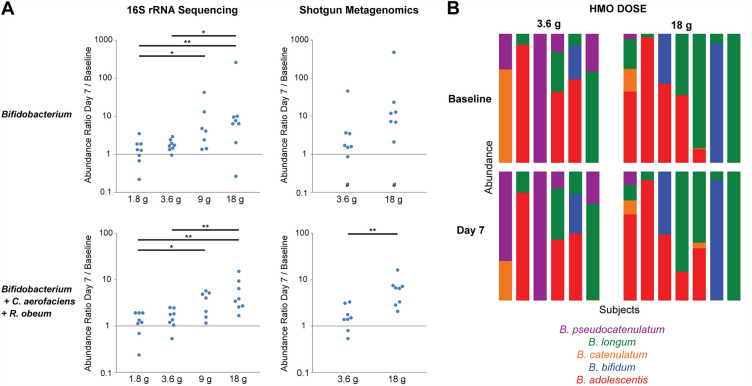
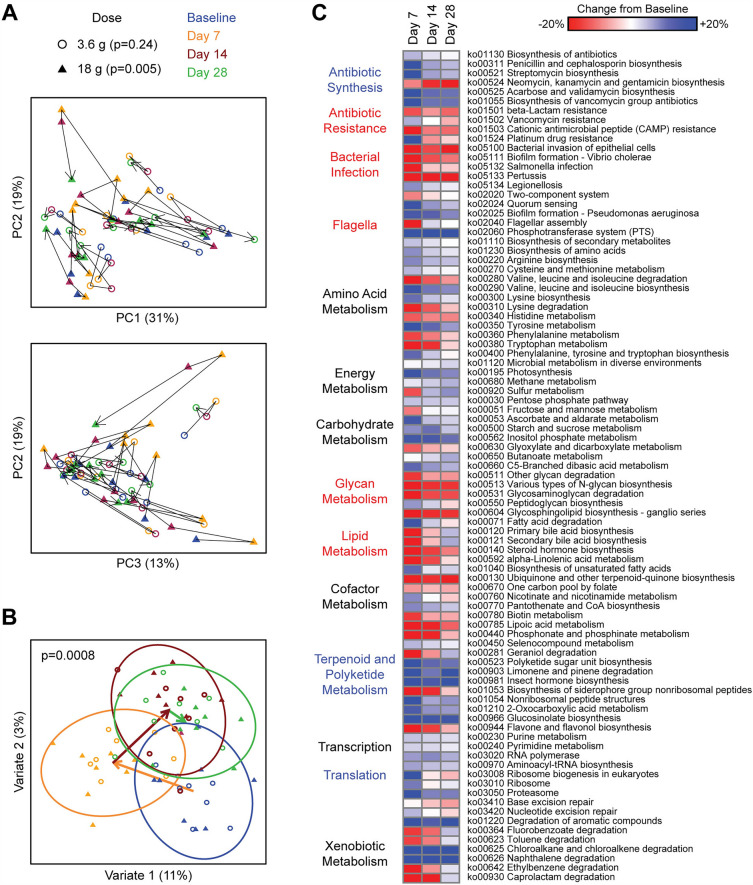
Human milk contains over 200 distinct oligosaccharides, which are critical to shaping the developing neonatal gut microbiome. To investigate whether a complex mixture of human milk oligosaccharides (HMOs) would similarly modulate the adult gut microbiome, HMO-Concentrate derived from pooled donor breast milk was administered orally to 32 healthy adults for 7 days followed by 21 days of monitoring. Fecal samples were collected for 16S rRNA gene sequencing, shotgun metagenomics, and metabolomics analyses. HMO-Concentrate induced dose-dependent Bifidobacterium expansion, reduced microbial diversity, and altered microbial gene content. Following HMO cessation, a microbial succession occurred with diverse taxonomic changes-including Bacteroides expansion-that persisted through day 28. This was associated with altered microbial gene content, shifts in serum metabolite levels, and increased circulating TGFβ and IL-10. Incubation of cultured adult microbiota with HMO-Concentrate induced dose-dependent compositional shifts that were not recapitulated by individual HMOs or defined mixtures of the 10 most abundant HMOs in HMO-Concentrate at their measured concentrations. These findings support that pooled donor HMOs can exert direct effects on adult gut microbiota and that complex mixtures including low abundance HMOs present in donor milk may be required for maximum effect.Registration: ClinicalTrials.gov NCT05516225.


Conflict of interest statement

MLL, DJR, AKS, CA, and VN are current or former (VN) employees of Prolacta Bioscience, Inc. JPJ received consulting fees from Prolacta Bioscience, Inc.

Figures

Figure 1
Figure 1
Study design overview. (A) Diagram depicting allocation of participants to four HMO dose cohorts, each receiving HMO-Concentrate for 7 days followed by 21 days of longitudinal sampling of feces, serum, urine, and vaginal swabs. Assays performed on each sample type are shown by dose cohort. 16S = 16S rRNA gene sequencing, SM = shotgun metagenomics, SCFAs = short chain fatty acids, Met = metabolomics (B) Global metabolomics comparison of pooled donor milk, permeate, and HMO-Concentrate. (C) Levels of lactose and representative examples of sialylated and fucosylated oligosaccharides in HMO-Concentrate. Data were scaled such that the median of all samples was 1.
Figure 2
Figure 2
HMO administration alters gut microbiome composition and diversity. (A) Boxplots show changes in alpha diversity (measured by Chao1 and Shannon index) from baseline at three time points: day 7 (D7), day 14 (D14), and day 28 (D28). Boxes represent the first quartile, median, and third quartile. Whiskers extend to 1.5 times the interquartile range and outlying points are individually plotted. *p < 0.05, **p < 0.01, ***p < 0.001 (B) PCoA plots depicting microbiome composition across the four time points. The two plots show the first three principal coordinates and the percent variation that they explain. Each dot represents one sample, with lines connecting samples collected from each subject. Color represents time point and symbol represents dose group. P-values for each dose group were calculated by Adonis adjusting for subject. (C) Multilevel sPLS-DA plot visualizing shifts in microbiome composition across the four time points controlling for subject. Ellipses indicate the 95% confidence region for each time point. Arrows indicate change in centroids at each time point. P-value was calculated by Adonis for all doses combined, adjusting for subject. (D) Mean relative abundance at the phylum level for all doses combined. *p < 0.05, **p < 0.01, ***p < 0.00001 across all time points.
Figure 3
Figure 3
HMO-Concentrate induces an initial Bifidobacterium expansion followed by further microbiome change including Bacteroides expansion. (A) Differentially abundant OTUs at day 7 were identified from 16S rRNA gene sequencing data by DESeq2 models adjusting for subject. Each dot represents one OTU, which are organized by genus with color representing phylum and dot size proportional to normalized abundance. Effect size is shown as the log2 of the fold change. (B) Differentially abundant OTUs at day 14 relative to baseline are shown. (C) Kinetic profiles of differential OTUs for selected genera. (D) Venn diagram showing the number of differential OTUs relative to baseline at each time point. (E) Differentially abundant species identified by shotgun metagenomics at day 7.
Figure 4
Figure 4
Dose-dependent expansion of intestinal Bifidobacterium without change in species distribution. (A) Graphs depict the ratio of Bifidobacterium relative abundance at day 7 compared to day 0 based upon 16S rRNA gene sequencing or shotgun metagenomics. Each dot represents one patient. The two lower panels show abundance ratios when adding counts of Collinsella aerofaciens and Ruminococcus obeum to Bifidobacterium. # signifies samples without detectable Bifidobacterium. *p < 0.05, **p < 0.005 (B) Stacked bar graphs represent the distribution of Bifidobacterium species in subjects in the 3.6 g and 18 g dose groups at baseline and at day 7 based upon shotgun metagenomics. Each of five detected Bifidobacterium species is represented by a different color. The colored area of each species is proportional to its relative abundance out of all detected Bifidobacterium in a subject. Two subjects with undetectable Bifidobacterium were not included.
Figure 5
Figure 5
HMO treatment alters microbial gene content including induction of antibiotic synthesis pathways and depletion of antibiotic resistance pathways. (A) PCoA plots depicting microbial gene content by shotgun metagenomics across the four time points. Each dot represents one sample, with lines connecting samples collected from each subject. (B) Multilevel sPLS-DA plot visualizing shifts in microbial gene content across the four time points controlling for subject. Ellipses indicate the 95% confidence region for each time point. Arrows indicate change in centroids at each time point. P-value was calculated by Adonis for all doses combined, adjusting for subject. (C) Heat map showing differentially abundant microbial functional pathways (KEGG annotation) ordered by functional category. Color gradient indicates percentage increase or decrease in normalized gene counts belonging to each pathway. Category labels to the left of the heat map are colored if the mean change of differential pathways in that category was greater than 5% (blue) or less than -5% (red).
Figure 6
Figure 6
HMO administration alters circulating levels of metabolites and cytokines. (A, B) Multilevel sPLS-DA plot visualizing shifts in metabolomics profiles in the serum (A) and urine (B) across the four time points controlling for subject. Ellipses indicate the 95% confidence region for each time point. Arrows indicate change in centroids at each time point. P-values were calculated by Adonis, adjusting for subject. (C) Heat map showing differentially abundant serum metabolites, ordered by metabolic pathway assignment. Color gradient indicates percentage increase or decrease in metabolite relative abundance. (D) Boxplots show fold change in measured circulating concentration of TGFβ and IL-10 at each of the study time points compared to baseline. The dotted lines indicate a fold change of 1. *p < 0.05, **p < 0.01.
Figure 7
Figure 7
HMO-Concentrate induces Bifidobacterium expansion in cultured human fecal microbiota. (A) PCoA plots of pooled human fecal microbiota from infants, adults, or elderly donors after 24 h of anaerobic culture with or without varying doses of HMO-Concentrate, 3’-FL, and inulin added to media. (B) Bifidobacterium abundance is shown for each experimental group (mean + /− SEM). *p < 0.05, **p < 0.005, ***p < 0.001 (C) Differentially abundant genera in HMO treated adult and elderly microbiota for 24 h compared to control based on DESeq2 models adjusted for type of microbiota and HMO dosage. (D) PCoA plot and Bifidobacterium abundance for cultured adult microbiota exposed for 24 h to HMO-Concentrate or a mixture of the top 10 most abundant individual HMOs in the concentrate at their measured concentrations.

References

    1. Coppa GV, et al. Changes in carbohydrate composition in human milk over 4 months of lactation. Pediatrics. 1993;91:637–641. doi: 10.1542/peds.91.3.637. - DOI - PubMed
    1. Newburg DS, Morelli L. Human milk and infant intestinal mucosal glycans guide succession of the neonatal intestinal microbiota. Pediatr Res. 2015;77:115–120. doi: 10.1038/pr.2014.178. - DOI - PubMed
    1. Bode L. Human milk oligosaccharides: Every baby needs a sugar mama. Glycobiology. 2012;22:1147–1162. doi: 10.1093/glycob/cws074. - DOI - PMC - PubMed
    1. Bode L, Rudloff S, Kunz C, Strobel S, Klein N. Human milk oligosaccharides reduce platelet-neutrophil complex formation leading to a decrease in neutrophil beta 2 integrin expression. J Leukoc Biol. 2004;76:820–826. doi: 10.1189/jlb.0304198. - DOI - PubMed
    1. Bode L. Human milk oligosaccharides: Prebiotics and beyond. Nutr. Rev. 2009;67(Suppl 2):S183–191. doi: 10.1111/j.1753-4887.2009.00239.x. - DOI - PubMed

Publication types

Associated data