. 2023 Aug 31;13(1):14301.
doi: 10.1038/s41598-023-40734-0.

Housing situations and local COVID-19 infection dynamics using small-area data

Affiliations

Housing situations and local COVID-19 infection dynamics using small-area data

Diana Freise et al. Sci Rep. .

Abstract

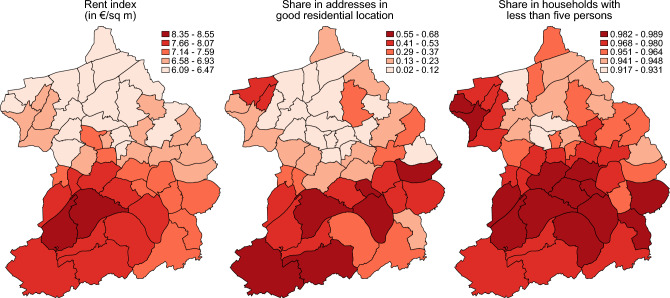
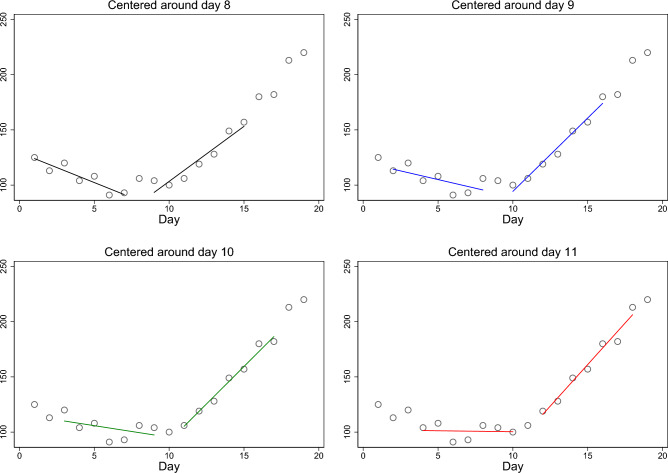
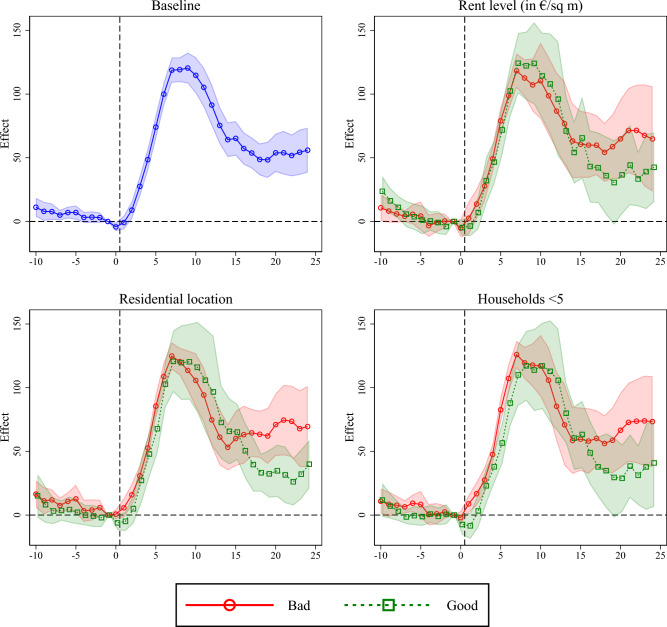
Low socio-economic status is associated with higher SARS-CoV-2 incidences. In this paper we study whether this is a result of differences in (1) the frequency, (2) intensity, and/or (3) duration of local SARS-CoV-2 outbreaks depending on the local housing situations. So far, there is not clear evidence which of the three factors dominates. Using small-scale data from neighborhoods in the German city Essen and a flexible estimation approach which does not require prior knowledge about specific transmission characteristics of SARS-CoV-2, behavioral responses or other potential model parameters, we find evidence for the last of the three hypotheses. Outbreaks do not happen more often in less well-off areas or are more severe (in terms of the number of cases), but they last longer. This indicates that the socio-economic gradient in infection levels is at least in parts a result of a more sustained spread of infections in neighborhoods with worse housing conditions after local outbreaks and suggests that in case of an epidemic allocating scarce resources in containment measures to areas with poor housing conditions might have the greatest benefit.


Conflict of interest statement

The authors declare no competing interests.

Figures

Figure 1
Figure 1
Illustration of the regional variation of cumulative cases between local districts. Each map shows cumulative cases per 1000 inhabitants for a specific time frame. The figure was created using Stata 17 (https://www.stata.com/).
Figure 2
Figure 2
Illustration of the regional variation in housing characteristics between local districts. Classification is based on k-means partition cluster analysis. The figure was created using Stata 17 (https://www.stata.com/).
Figure 3
Figure 3
Stylized example of local Corona outbreak identification for one district. The vertical axis measures the 7-day incidence. The figure was created using Stata 17 (https://www.stata.com/).
Figure 4
Figure 4
Number of outbreaks in neighborhoods. The figure was created using Stata 17 (https://www.stata.com/).
Figure 5
Figure 5
Event study results. Coefficients corresponding to μj in Eq. 3. μ-1 is restricted to zero. 95% confidence intervals reported. Standard errors clustered on district level. The figure was created using Stata 17 (https://www.stata.com/).
Figure 6
Figure 6
Event study results. Coefficients corresponding to μj in Eq. 3. μ-1 is restricted to zero. Regressions additionally account for (cumulative) cases up to day t-15. 95% confidence intervals reported. Standard errors clustered on district level. The figure was created using Stata 17 (https://www.stata.com/).

References

    1. World Health Organization. Daily cases and deaths by date reported to WHO. https://covid19.who.int/WHO-COVID-19-global-data.csv (2022).
    1. Barber RM, et al. Estimating global, regional, and national daily and cumulative infections with SARS-CoV-2 through Nov 14, 2021: A statistical analysis. The Lancet. 2021 doi: 10.1016/S0140-6736(22)00484-6. - DOI - PMC - PubMed
    1. Franch-Pardo I, Napoletano BM, Rosete-Verges F, Billa L. Spatial analysis and GIS in the study of COVID-19. A review. Sci. Total Environ. 2020;739:140033. doi: 10.1016/j.scitotenv.2020.140033. - DOI - PMC - PubMed
    1. Franch-Pardo I, Desjardins MR, Barea-Navarro I, Cerdà A. A review of GIS methodologies to analyze the dynamics of COVID-19 in the second half of 2020. Trans. GIS: TG. 2021;25:2191–2239. doi: 10.1111/tgis.12792. - DOI - PMC - PubMed
    1. Nazia N, et al. Methods used in the spatial and spatiotemporal analysis of COVID-19 epidemiology: A systematic review. Int. J. Environ. Res. Public Health. 2022 doi: 10.3390/ijerph19148267. - DOI - PMC - PubMed

Publication types