. 2023 Dec;7(12):1627-1635.
doi: 10.1038/s41551-023-01081-7. Epub 2023 Aug 31.

Profiling of repetitive RNA sequences in the blood plasma of patients with cancer

Affiliations

Profiling of repetitive RNA sequences in the blood plasma of patients with cancer

Roman E Reggiardo et al. Nat Biomed Eng. 2023 Dec.

Abstract

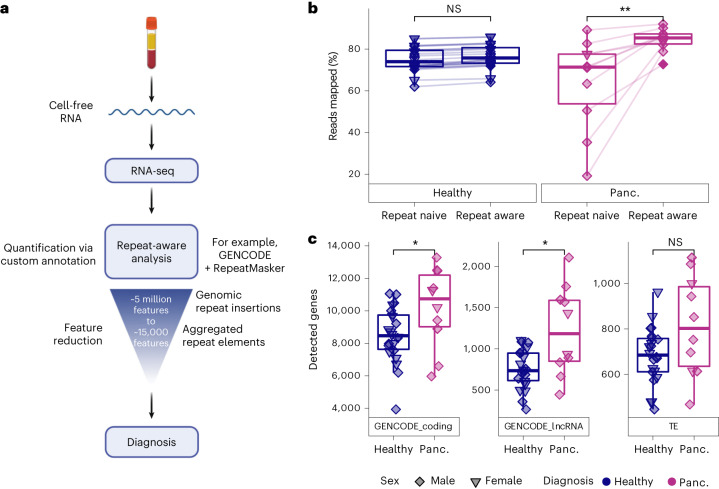
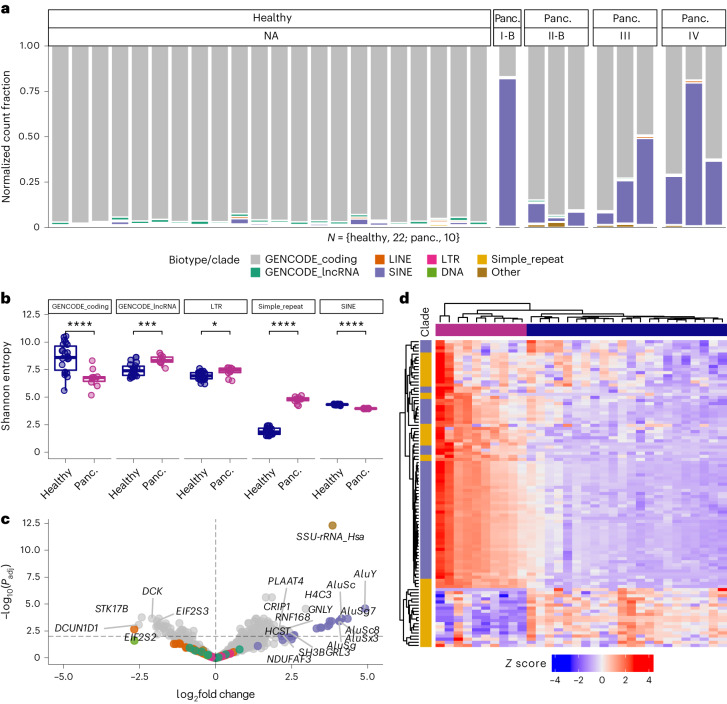
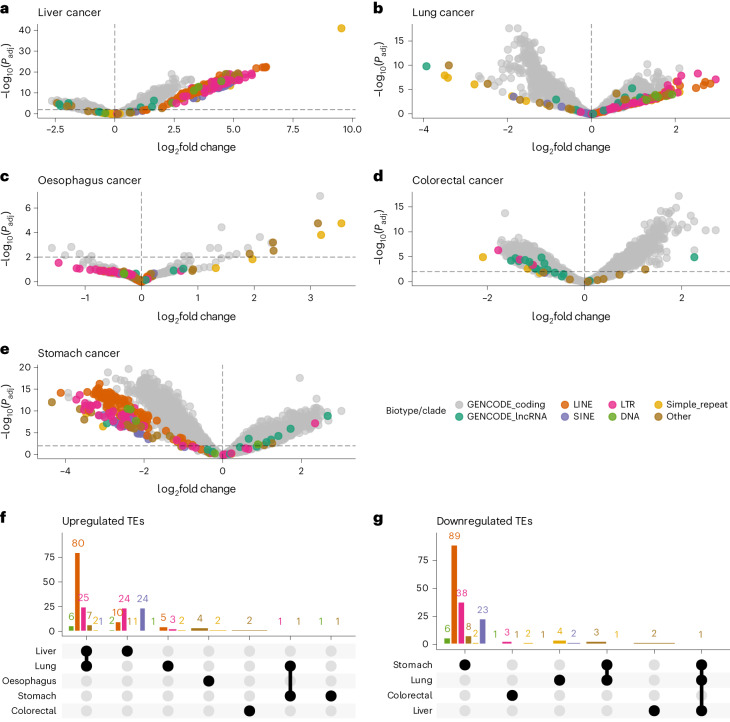
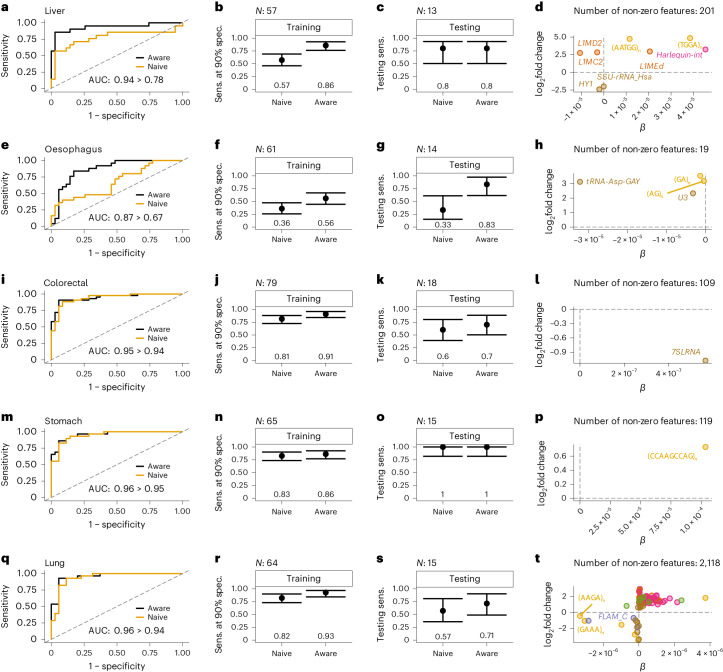
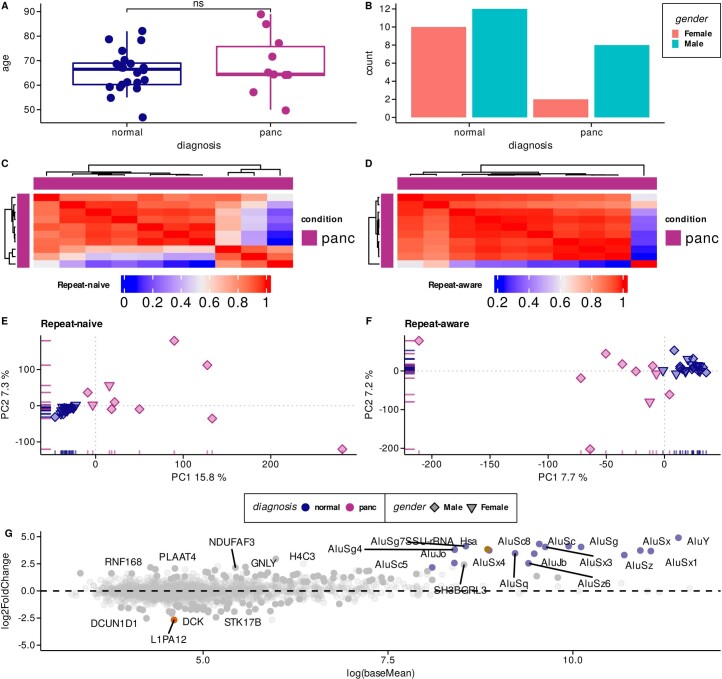
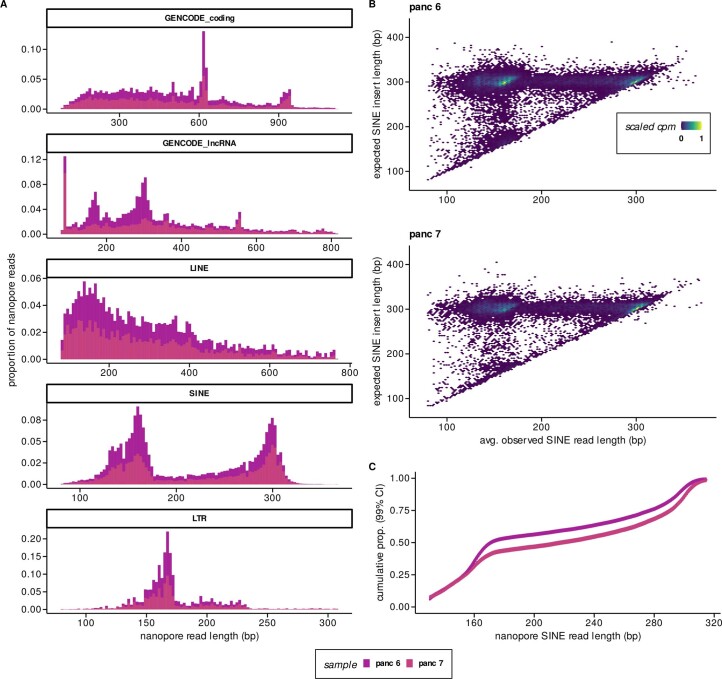
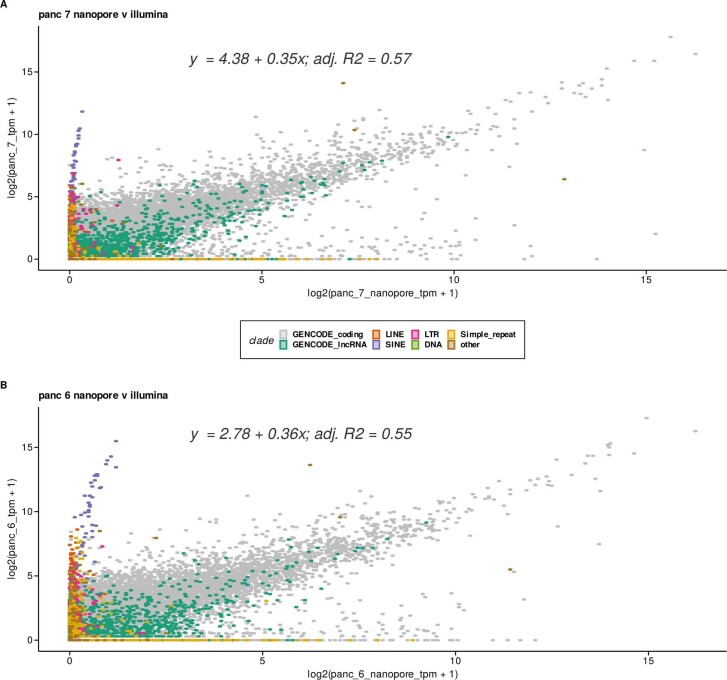
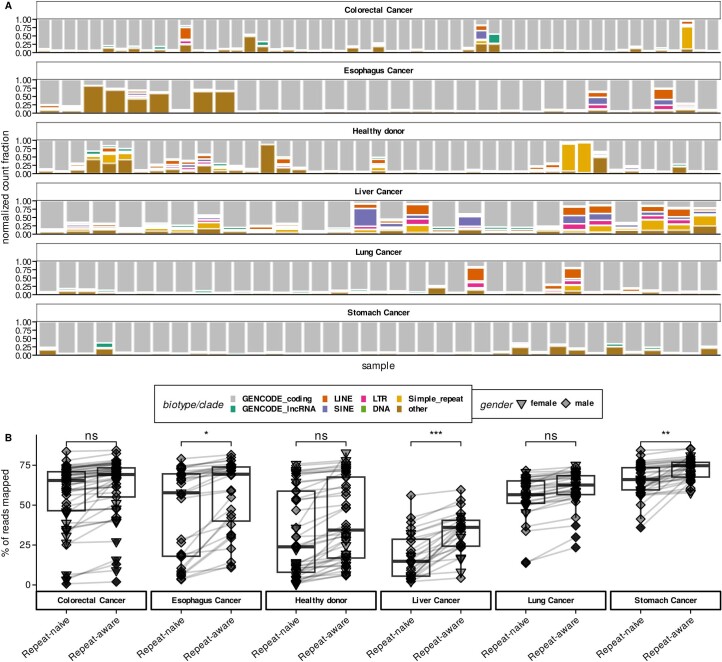
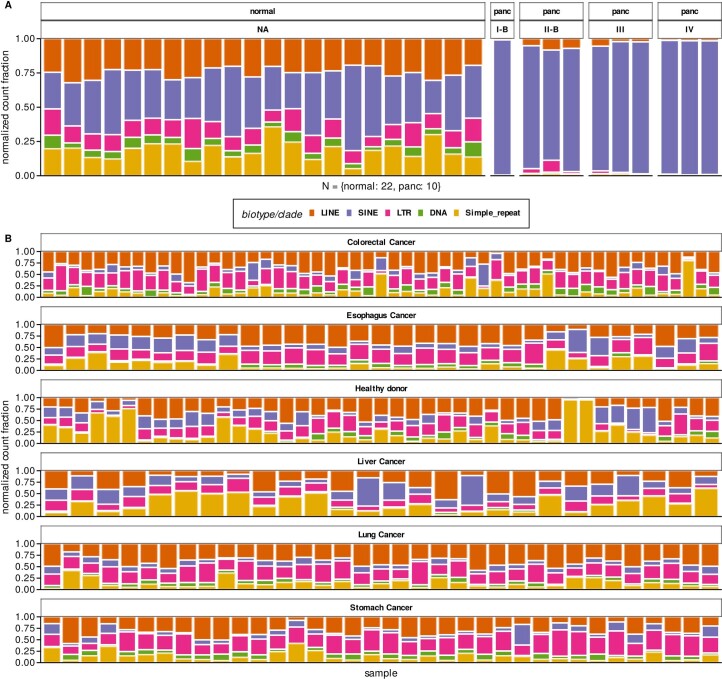
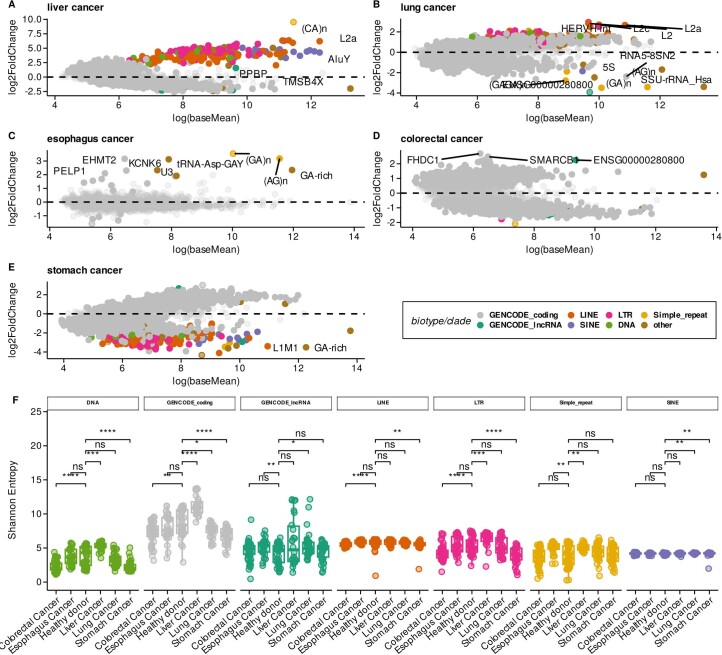
Liquid biopsies provide a means for the profiling of cell-free RNAs secreted by cells throughout the body. Although well-annotated coding and non-coding transcripts in blood are readily detectable and can serve as biomarkers of disease, the overall diagnostic utility of the cell-free transcriptome remains unclear. Here we show that RNAs derived from transposable elements and other repeat elements are enriched in the cell-free transcriptome of patients with cancer, and that they serve as signatures for the accurate classification of the disease. We used repeat-element-aware liquid-biopsy technology and single-molecule nanopore sequencing to profile the cell-free transcriptome in plasma from patients with cancer and to examine millions of genomic features comprising all annotated genes and repeat elements throughout the genome. By aggregating individual repeat elements to the subfamily level, we found that samples with pancreatic cancer are enriched with specific Alu subfamilies, whereas other cancers have their own characteristic cell-free RNA profile. Our findings show that repetitive RNA sequences are abundant in blood and can be used as disease-specific diagnostic biomarkers.


Conflict of interest statement

D.H.K. and R.E.R. are inventors on patent applications covering the methods and compositions to detect cancer using cell-free RNA submitted by the Regents of the University of California. D.H.K. and R.E.R. are founders and shareholders and D.H.K. is a board member of LincRNA Bio. S.Y.C. has served as a consultant to United Therapeutics and Acceleron Pharma. S.Y.C. has held research grants from Actelion, Bayer and Pfizer. S.Y.C. is a director, officer and shareholder of Synhale Therapeutics. S.Y.C. has submitted patent applications regarding metabolism in pulmonary hypertension.

Figures

Fig. 1
Fig. 1. Cell-free RNA transcriptome profiling using repeat-aware COMPLETE-seq.
a, Diagram of COMPLETE-seq RNA liquid-biopsy technology, highlighting the use of repeat-derived cell-free RNAs aggregated into a tractable feature set to enable diagnostic modelling. Created with BioRender.com. b, Comparison of mapping rates between use of a repeat-naive (GENCODE v.39) reference annotation (**P = 0.0039) and repeat-aware reference annotation (Wilcoxon, paired, two-sided). c, Comparison of gene detection distributions for each cohort across coding genes (GENCODE_coding; *P = 0.043), lncRNAs (GENCODE_lncRNA; *P = 0.035) and TE subfamilies (Wilcoxon, two-sided). For the box plots, the centre line represents the median, the box limits are upper and lower quartiles and whiskers represent 1.5× interquartile range. NS, not significant; panc., pancreatic cancer.
Fig. 2
Fig. 2. Disease-specific enrichment of repeat-derived cell-free RNA.
a, Distribution of biotype representation (by DESeq2-normalized count) in cell-free RNA-seq quantifications for samples from each cohort, coloured by GENCODE biotype or repeat subfamily, and facetted by stage (NA for healthy samples). b, Comparison of significantly different (Wilcoxon, two-sided) Shannon entropy distributions for GENCODE biotype (****P = 9.6 × 10−5, ***P = 0.00019) and repeat subfamilies (*P = 0.014, ****P = 3.1 × 10−8). c, Volcano plot of significantly (P < 0.01) differentially expressed genes or repeat subfamilies derived from repeat-aware quantification, with horizontal and vertical lines drawn at −log10(0.01) and 0, respectively. d, Heat map (K means) of Z scores calculated from DESeq2-normalized counts of SINEs and simple repeats, with an average of at least five counts per sample across the dataset. For the box plots, the centre line represents the median, the box limits are upper and lower quartiles and whiskers represent 1.5× interquartile range. NA, not applicable.
Fig. 3
Fig. 3. Disease-specific repeat-derived cell-free RNA signatures.
ae, Volcano plots of differentially expressed genes and repeat subfamilies derived from repeat-aware quantification of cell-free RNA-seq data for liver (a), lung (b), oesophagus (c), colorectal (d) and stomach (e) cancer. Horizontal and vertical lines drawn at −log10(0.01) and 0, respectively. f,g, UpSet plots showing the number of shared and unique upregulated (f) or downregulated (g) TE subfamilies across the different cancer types.
Fig. 4
Fig. 4. COMPLETE-seq features improve performance of diagnostic models.
a,e,i,m,q, Receiver operating characteristic curves for the best repeat-aware model and the equivalent repeat-naive model for liver (a), oesophagus (e), colorectal (i), stomach (m), and lung (q) cancer. Diagonal lines represent a random classifier. AUC estimates are shown with the improved, repeat-aware AUC compared with the repeat-naive equivalent. b,f,j,n,r, Training sensitivity (sens.) at 90% specificity (spec.) for repeat-naive and repeat-aware models (95% confidence interval, binomial), for liver (b), oesophagus (f), colorectal (j), stomach (n), and lung (r) cancer, with values shown on the plot. c,g,k,o,s, Testing sensitivity calculated with the 90% specificity probability threshold identified in training (95% confidence interval, binomial), for liver (c), oesophagus (g), colorectal (k), stomach (o), and lung (s) cancer, with values shown on the plot. d,h,l,p,t, Comparison of model coefficient (β) to DESeq2 log2fold change for non-zero repeat features used in the repeat-aware model characterized in the respective row for liver (d), oesophagus (h), colorectal (l), stomach (p), and lung (t) cancer, with the total number of features shown. Horizontal and vertical lines drawn at 0.
Extended Data Fig. 1
Extended Data Fig. 1. Performance overview of COMPLETE-seq on the internal cohort.
a, Comparison of age distributions between cohorts (Wilcoxon, two-sided, ns: p > 0.05) enter line, median; box limits, upper and lower quartiles; whiskers, 1.5x interquartile range. b, Number of samples, stratified by gender, in each cohort. c, Heatmap (K-means) of Pearson correlation between panc samples using Repeat-naïve quantification. d, Heatmap (K-means) of Pearson correlation between panc samples using Repeat-aware quantification. e, PCA dimensions 1 & 2 calculated using variance-stabilized, Repeat-naive quantifications for normal and panc samples. f, PCA dimensions 1 & 2 calculated using variance-stabilized, Repeat-aware quantifications for normal and panc samples. g, MA plot of log2FoldChange between panc and normal samples compared to log-scale baseMean derived from DESeq2. Significantly DE genes/subfamilies are full opacity and colour.
Extended Data Fig. 2
Extended Data Fig. 2. Nanopore sequencing of cell-free RNA reveals biotype-specific fragment-size patterns.
a, Distribution of cell-free RNA lengths in base pairs (bp) for GENCODE biotypes or - repeat superfamily elements in pancreatic (panc 6, panc 7) cancer patients. b, Density plots depicting the relationship between expected (genomic SINE locus length) and observed SINE cell-free RNA length in pancreatic (panc 6, panc 7) cancer patients. c, Cumulative distribution function plot of SINE cell-free RNA length empirically calculated in pancreatic (panc 6, panc 7) cancer patients.
Extended Data Fig. 3
Extended Data Fig. 3. Nanopore and Illumina show agreement in the quantification of most GENCODE-annotated genes.
a, Scatter plot depicting transcripts-per-million abundance for transcripts detected in matched nanopore and Illumina libraries from sample panc 7. Linear fit described. b, Scatter plot depicting transcripts-per-million abundance for transcripts detected in matched nanopore and Illumina libraries from sample panc 6. Linear fit described.
Extended Data Fig. 4
Extended Data Fig. 4. Repeat-aware analysis of cell-free RNA from 5 different cancers.
a, Distribution of biotype representation (by DESeq2 normalized count) in cell-free RNA-seq quantifications for each cancer type, coloured by GENCODE biotype or repeat subfamily, and facetted by stage. b, Comparison of mapping rates between use of a Repeat-naïve (GENCODE v39) reference annotation and Repeat-aware reference annotation (Wilcoxon, paired, two-sided). center line, median; box limits, upper and lower quartiles; whiskers, 1.5x interquartile range. ns: p > 0.05, *: p <= 0.05, **: p <= 0.01, ***: p <= 0.001.
Extended Data Fig. 5
Extended Data Fig. 5. Repeat-specific diversity across internal and external cohorts.
a, Distribution of repeat representation (by DESeq2 normalized count) in cell-free RNA-seq quantifications for pancreatic cancer, coloured by repeat subfamily, and facetted by stage. b, Distribution of repeat representation (by DESeq2 normalized count) in cell-free RNA-seq quantifications for each cancer type, colored by repeat subfamily.
Extended Data Fig. 6
Extended Data Fig. 6. Differential expression and variability of repeat-elements in 5 different cancers.
a-e, MA plots of log2FoldChange between labeled cancer type and healthy donor samples compared to log-scale baseMean derived from DESeq2. Significantly DE genes/repeat subfamilies are full opacity and color. f, Comparison of significantly different (Wilcoxon, two-sided) Shannon Entropy distributions for GENCODE biotypes and repeat subfamilies. center line, median; box limits, upper and lower quartiles; whiskers, 1.5x interquartile range. ns: p > 0.05, *: p <= 0.05, **: p <= 0.01, ***: p <= 0.001, ****: p <= 0.0001.

References

    1. Djebali S, et al. Landscape of transcription in human cells. Nature. 2012;489:101–108. doi: 10.1038/nature11233. - DOI - PMC - PubMed
    1. Bartel DP. MicroRNAs: target recognition and regulatory functions. Cell. 2009;136:215–233. doi: 10.1016/j.cell.2009.01.002. - DOI - PMC - PubMed
    1. Kim DH, Saetrom P, Snove O, Jr, Rossi JJ. MicroRNA-directed transcriptional gene silencing in mammalian cells. Proc. Natl Acad. Sci. USA. 2008;105:16230–16235. doi: 10.1073/pnas.0808830105. - DOI - PMC - PubMed
    1. Rinn JL, Chang HY. Genome regulation by long noncoding RNAs. Annu. Rev. Biochem. 2012;81:145–166. doi: 10.1146/annurev-biochem-051410-092902. - DOI - PMC - PubMed
    1. Kim DH, et al. Single-cell transcriptome analysis reveals dynamic changes in lncRNA expression during reprogramming. Cell Stem Cell. 2015;16:88–101. doi: 10.1016/j.stem.2014.11.005. - DOI - PMC - PubMed

Publication types