. 2023 Oct;8(10):1846-1862.
doi: 10.1038/s41564-023-01462-3. Epub 2023 Aug 31.

Single-cell massively-parallel multiplexed microbial sequencing (M3-seq) identifies rare bacterial populations and profiles phage infection

Affiliations

Single-cell massively-parallel multiplexed microbial sequencing (M3-seq) identifies rare bacterial populations and profiles phage infection

Bruce Wang et al. Nat Microbiol. 2023 Oct.

Abstract

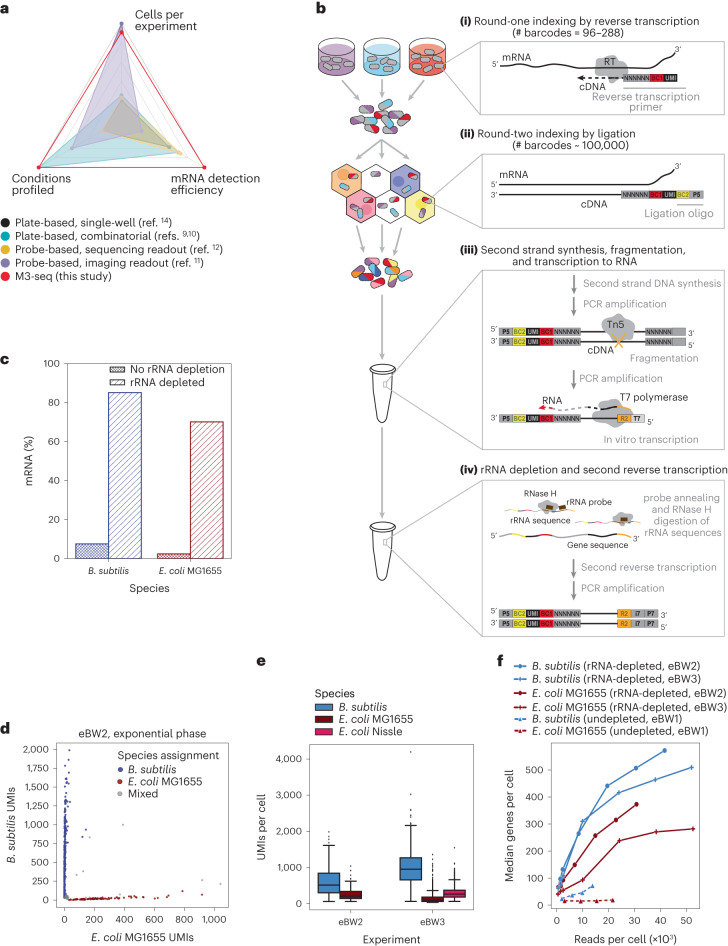
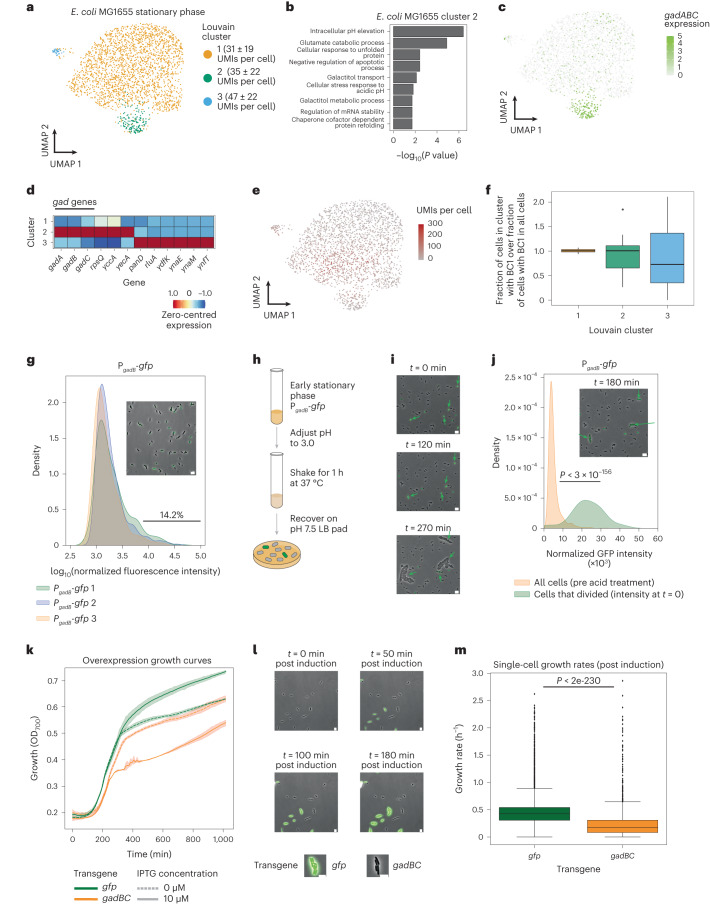
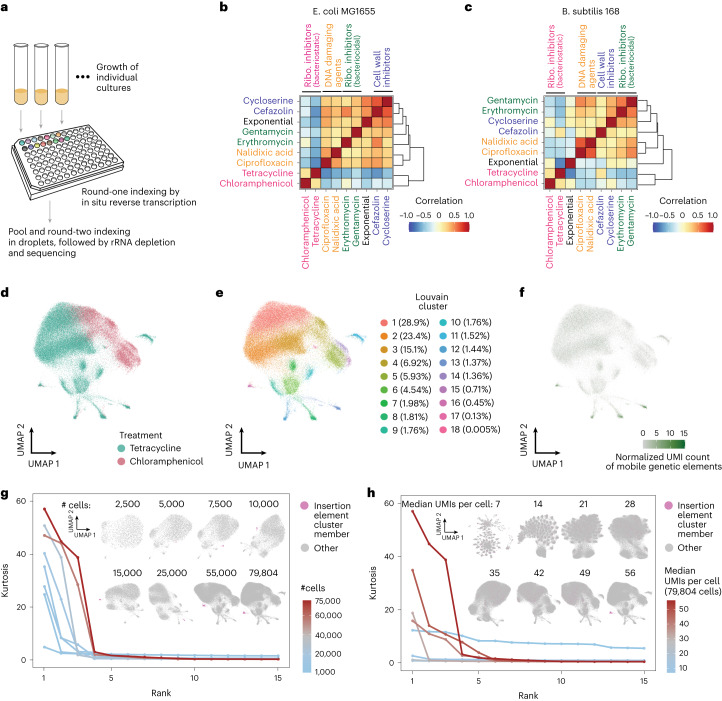
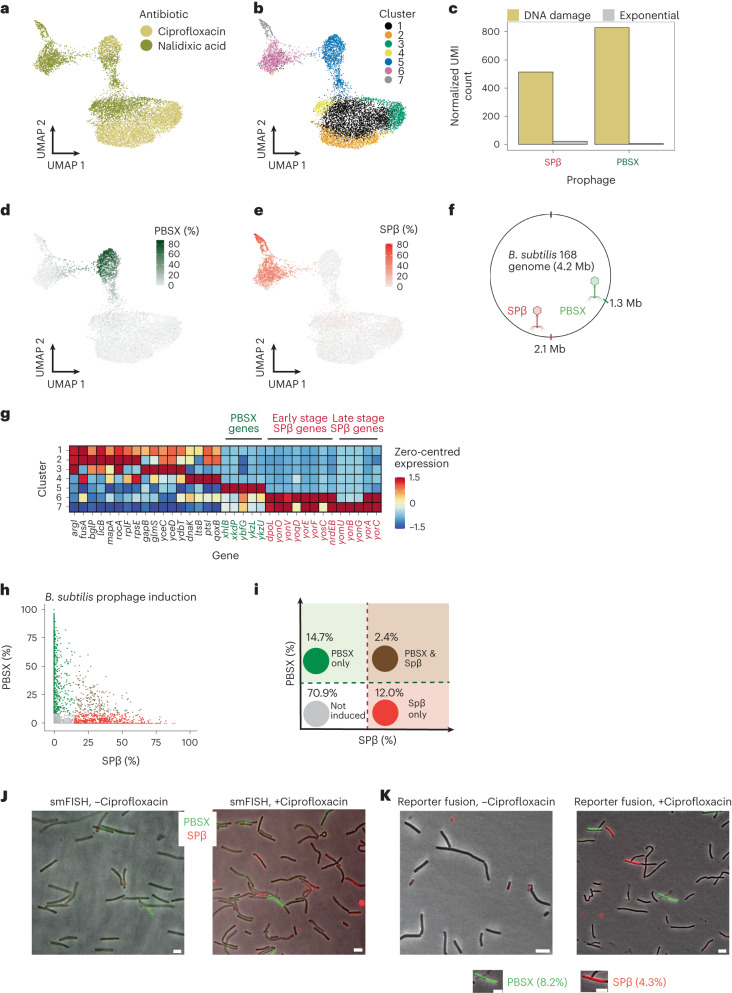
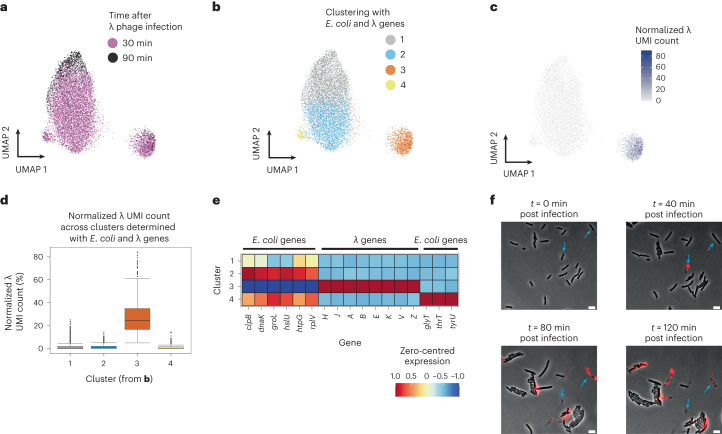
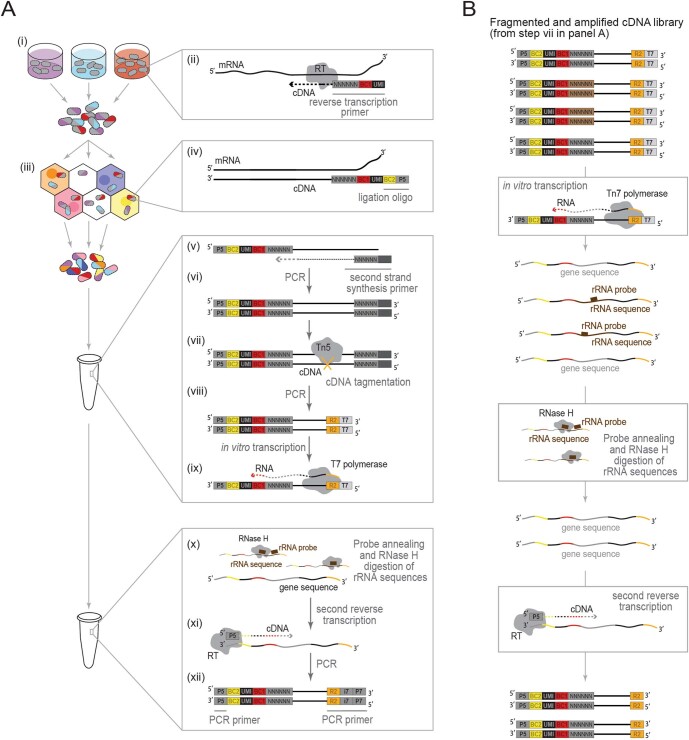
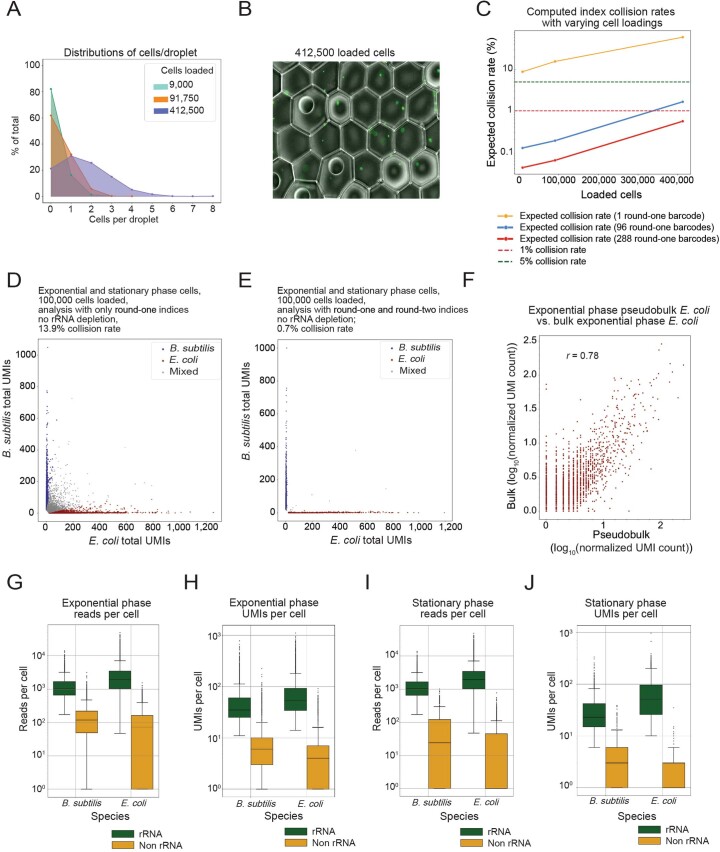
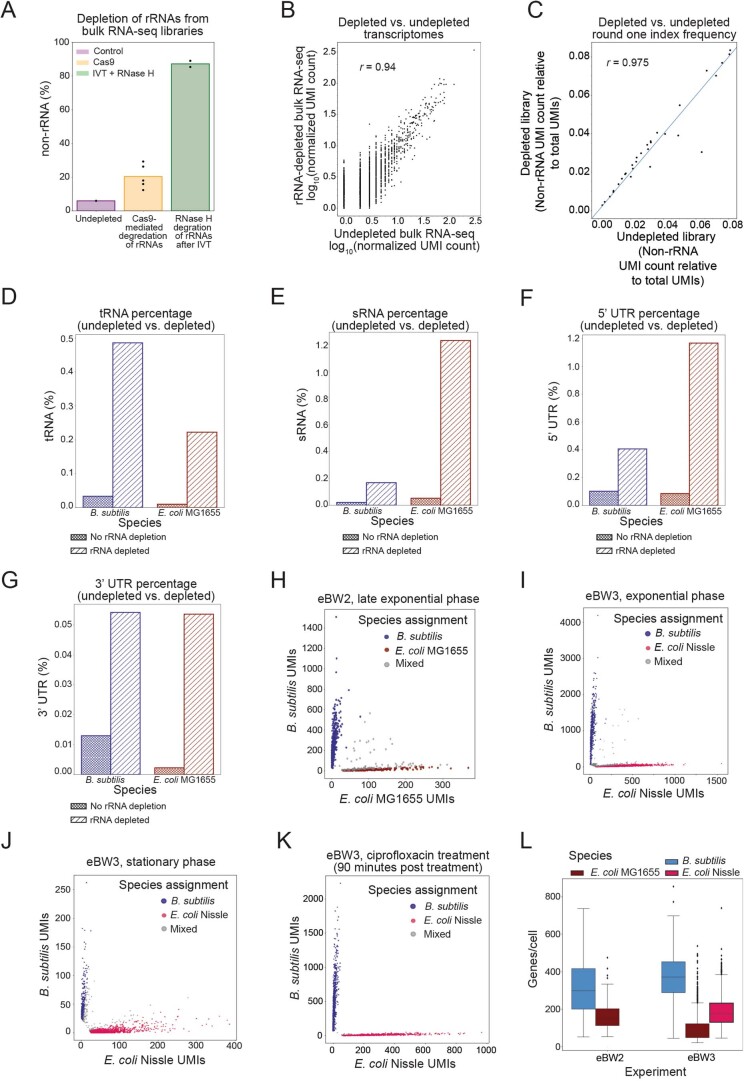
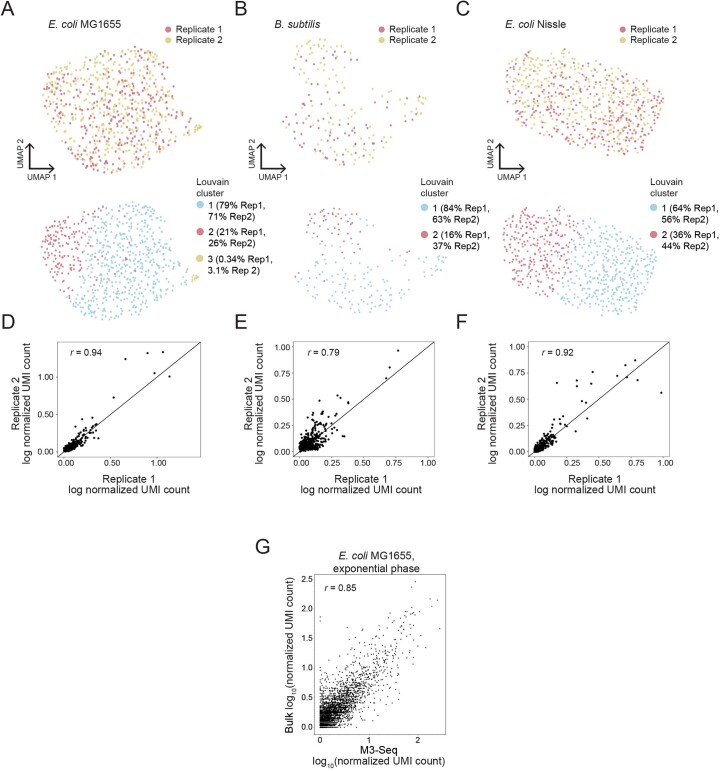
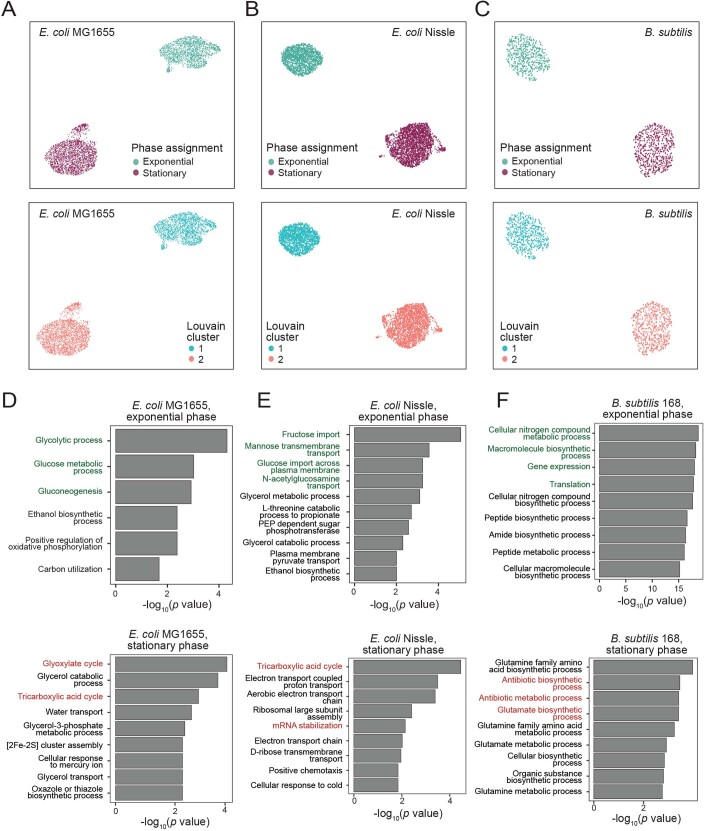
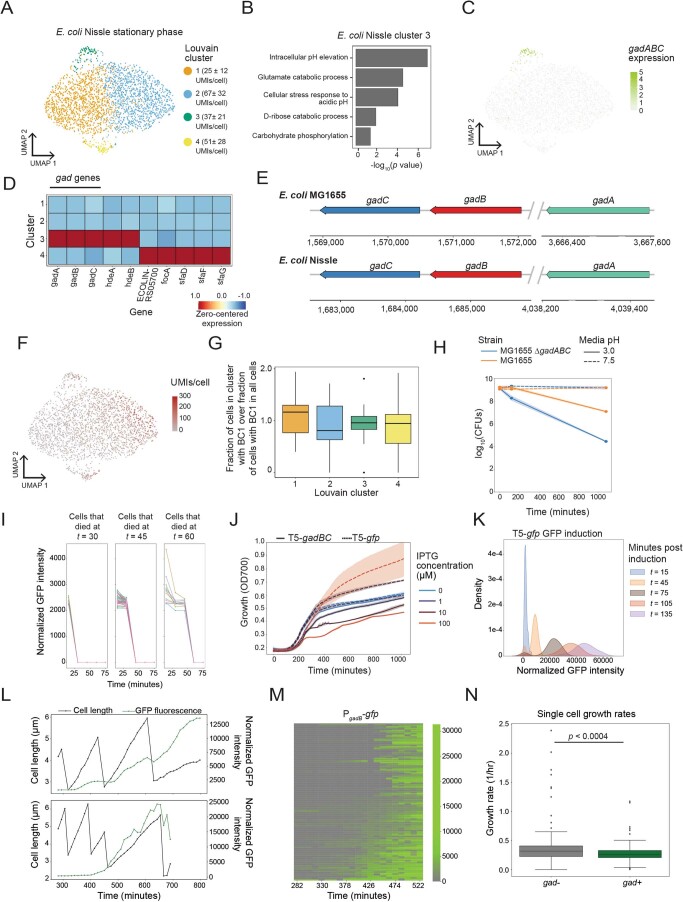
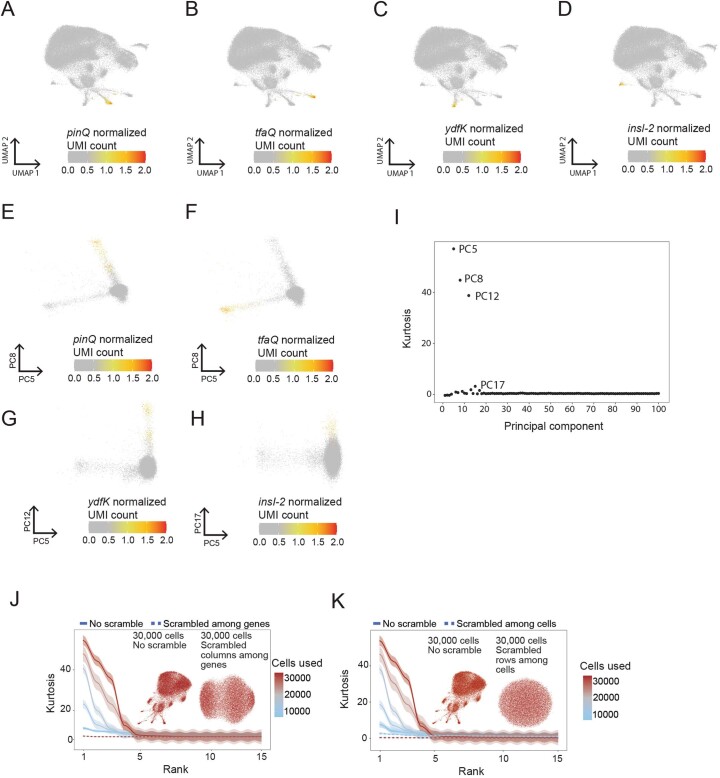
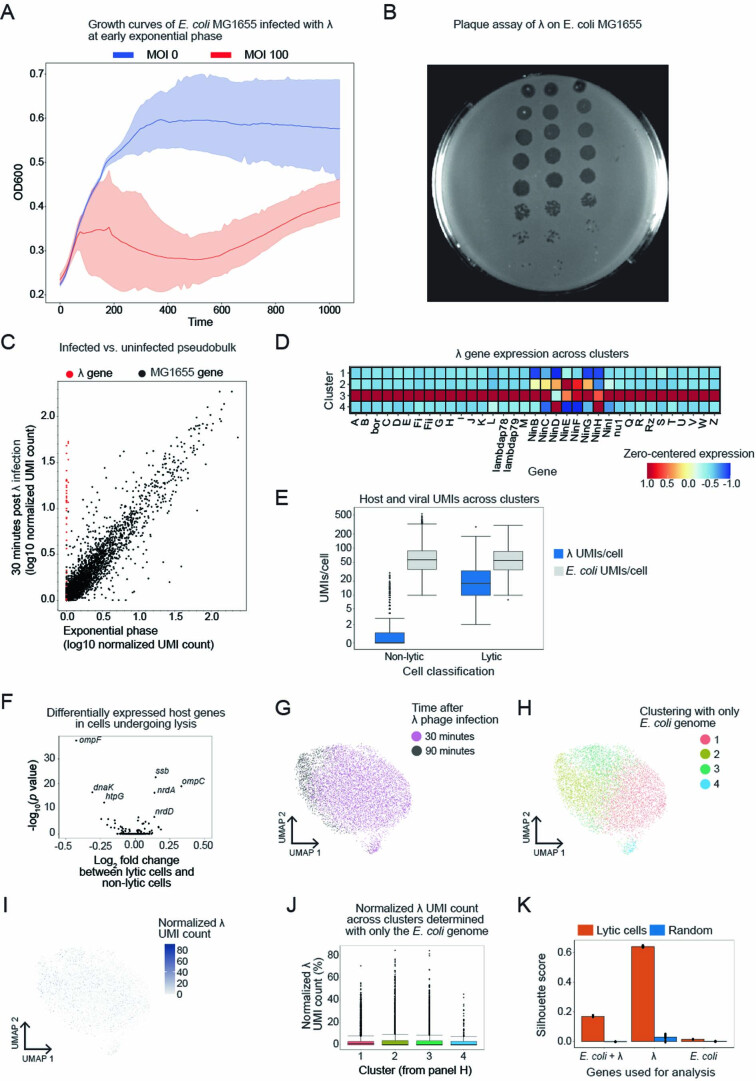
Bacterial populations are highly adaptive. They can respond to stress and survive in shifting environments. How the behaviours of individual bacteria vary during stress, however, is poorly understood. To identify and characterize rare bacterial subpopulations, technologies for single-cell transcriptional profiling have been developed. Existing approaches show some degree of limitation, for example, in terms of number of cells or transcripts that can be profiled. Due in part to these limitations, few conditions have been studied with these tools. Here we develop massively-parallel, multiplexed, microbial sequencing (M3-seq)-a single-cell RNA-sequencing platform for bacteria that pairs combinatorial cell indexing with post hoc rRNA depletion. We show that M3-seq can profile bacterial cells from different species under a range of conditions in single experiments. We then apply M3-seq to hundreds of thousands of cells, revealing rare populations and insights into bet-hedging associated with stress responses and characterizing phage infection.


Conflict of interest statement

B.A. is an advisory board member, with options, for Arbor Biotechnologies and Tessera Therapeutics and holds equity in Celsius Therapeutics. Z.G. is the founder of ArrePath. The remaining authors declare no competing interests.

Figures

Fig. 1
Fig. 1. Development of M3-seq platform for single-cell RNA-sequencing with post hoc rRNA depletion.
a, scRNA-seq methods previously established for bacteria with reported number of cells (ranging from 100 cells per experiment to 300,000 cells per experiment), conditions (ranging from 1 condition per experiment to 20 conditions per experiment) and mRNA genes per cell (ranging from 29 genes per cell to 371 genes per cell). Numbers in each category were selected by taking maximum reported values. Numbers also found in Extended Data Table 1. b, Schematic of M3-seq experimental workflow. Indexing: (i) RNA molecules are reverse transcribed in situ with indexed primers such that cells in each reaction (that is, separate plate wells) are marked with distinct sequences. Primers allow for random priming. (ii) Cells are then collected, mixed and distributed into droplets for a second round of indexing via ligation with barcoded oligos. Sequencing library preparation: Cells are collected again and lysed to release single-strand cDNAs. (iii) Second-strand synthesis is then performed in bulk reactions and resulting cDNA molecules are fragmented with Tn5 transposase, amplified via PCR to add a T7 promoter and converted to RNA using T7 RNA polymerase. (iv) To deplete ribosomal sequences, the amplified RNA library is hybridized to complementary DNA probes (Supplementary Table 3), and annealed sequences are cleaved by RNase H. Finally, remaining sequences are reverse transcribed back to DNA, sequencing adaptors are added and data are collected by sequencing. c, Percentages of mRNA sequences in B. subtilis and E. coli single-cell libraries prepared with and without rRNA depletion. Data from undepleted libraries come from eBW1 and data from depleted libraries come from eBW3. d, M3-seq analysis of a mixture of B. subtilis and E. coli wherein each point corresponds to a single ‘cell’ (that is, unique combination of plate and droplet barcodes). Species assignments were made as described in Methods. e, UMIs per cell (after species assignment) observed in exponential-phase cells across two experiments, eBW2 and eBW3 (515 ± 245 and 953 ± 310 median UMIs with absolute deviation for B. subtilis, respectively; 211 ± 85 and 100 ± 47 median UMIs with absolute deviation for E. coli MG1655, respectively; 266 ± 100 UMIs with for E. coli Nissle in eBW3). N = 1,336, 533, 84, 1,944, 1,659 cells, respectively. Boxplot limits are as defined in Methods. f, Median genes detected per B. subtilis or E. coli cell as a function of the number of total reads per cell across three experiments: eBW1, eBW2 and eBW3.
Fig. 2
Fig. 2. M3-seq reveals an acid-tolerant, bet-hedging subpopulation of E. coli in early stationary phase.
a, Uniform Manifold Approximation and Projection (UMAP) of E. coli MG1655 transcriptomes from cells at early stationary phase (OD = 2.8). Colours indicate clusters of transcriptionally similar cells. b, GO-term enrichment of select biological processes calculated with marker genes identified for cluster 2 in a. Marker gene identification and GO-term analyses were performed as described in Methods. c, Same as a but with colour gradient indicating expression of gadABC genes (in normalized UMI counts). d, Zero-centred and normalized expression of marker genes for each cluster identified in a. Marker genes were determined as described in Methods. e, Same as a but with colour gradient indicating number of UMIs captured in each cell. f, Boxplot of normalized cluster percentage for each BC1 barcode in each cluster. The normalized cluster percentage and boxplot limits were determined as described in Methods. g, Normalized fluorescence distribution of early stationary phase E. coli transformed with PgadB-gfp. Inset is a representative composite image with phase and GFP channels overlaid. The gad+ percentage was determined as described in Methods (N = 3 biological replicates, 5,034, 1,219 and 2,171 cells analysed, respectively). Scale bar, 5 μm. h, Schematic of acid-stress recovery assay. Tubes are adapted from BioRender.com. i, Representative composite images of E. coli expressing PgadB-gfp during recovery phase of acid-stress recovery assay depicted in h. Arrows indicate cells that divided during the recovery period. Scale bar, 5 μm. j, Distributions of fluorescence intensity of E. coli expressing PgadB-gfp before and after acid-stress recovery assay. Orange depicts measurements from cells before acid treatment (1,833 cells) and green depicts measurements from cells at t = 0 that ultimately divided over the course of recovery (that is, survived acid treatment, N = 38 cells). Inset is a representative composite overlay of the cells 180 min after the start of recovery from the same experiment as in i. Arrows indicate cells that divided during the recovery period. Scale bar, 5 μm. P = 2.99 × 10−156 from independent, two-sided t-test. k, Growth curves of E. coli MG1655 transformed with gfp or gadBC transgene (overexpression plasmids) and grown with or without 10 μM of IPTG (dashed curves) for 1,000 min. Curves indicate mean values and the shaded regions the 95% confidence interval of 3 technical replicates. l, Representative composite images of a mixed population of E. coli MG1655 transformed with gfp or gadBC transgene grown on an LB-agarose pad with 100 μM of IPTG. m, Single-cell growth rates of E. coli MG1655 transformed with gfp or gadBC transgene after transgene induction. Growth rates were computed as described in Methods from 539 and 112 observations, respectively, within a single set of videos (N = 1). P = 1.06 × 10−230 from independent, two-sided t-test. Boxplot limits are as defined in Methods.
Fig. 3
Fig. 3. M3-seq enables systematic investigation of bacterial response to antibiotic treatment.
a, Schematics of antibiotic experiment (eBW4). During preparation of M3-seq gene expression libraries, round-one plate indexing was used to uniquely mark antibiotic-treated and untreated cultures. Plate and tubes are adapted from BioRender.com. b, Heat map depicts Pearson correlations of pseudobulk transcriptomes from E. coli MG1655 prepared as in a, which were computed using genes with average expression greater than the median average expression of all genes. Coloured text indicates antibiotics of similar mechanisms of action. c, Same as b but for B. subtilis 168. d, UMAP of E. coli MG1655 transcriptomes from cells treated with the bacteriostatic antibiotics tetracycline and chloramphenicol. Colours indicate drug treatment. e, Same as d but with colours indicating clusters of transcriptionally similar cells. Percentage of cells in each cluster is denoted. f, Same as d but with colour gradient indicating the normalized UMI count of MGEs. Clusters 8, 12, 13 and 16 were enriched for MGE expression. g, Cell rarefaction analyses using M3-seq data. Curves indicate kurtosis of 15 principal components computed from tetracycline- and chloramphenicol-treated E. coli MG1655 cells, with individual curves corresponding to calculations from the total population of cells (79,804) or downsampled populations thereof (down to 1,000 cells). The 15 principal components included were those with the highest kurtosis for each downsampling. Inset UMAPs were computed from each downsampled data matrix. Within the embeddings, magenta indicates members of cluster 16 (indicated in f), which can only be distinguished for >7,500–10,000 cells. Notably, the top row of embeddings (2,500–10,000 cells) represents the scale of experiments from previous studies, while the bottom row represents the scale enabled by M3-seq. h, UMI rarefaction experiments using M3-seq data. Curves indicate kurtosis of 15 principal components computed from 79,804 tetracycline- and chloramphenicol-treated E. coli MG1655 cells, with individual curves corresponding to data subsampled for UMIs per cell (7 to 56 median UMIs). The 15 principal components included were those with the highest kurtosis for each subsampling of UMIs. Inset UMAPs were computed from each subsampled data matrix. Within the embeddings, magenta indicates members of cluster 16 (indicated in f), which can only be distinguished at the highest UMI detection efficiency.
Fig. 4
Fig. 4. M3-seq characterizes independent activation of prophages in B. subtilis.
a, UMAP of B. subtilis transcriptomes from ciprofloxacin- and nalidixic acid-treated cells in exponential phase (OD = 0.3). Colours indicate treatment conditions (90 min). b, Same as a but with colours indicating clusters of transcriptionally similar cells. c, Pseudobulk gene expression of the two prophages in the DNA-damaging antibiotic-treated conditions (yellow) compared to exponential phase (grey). d, Same as a but with colour gradient indicating percentage of PBSX prophage UMIs within each cell. Percentages were calculated by dividing the total number of PBSX UMIs by the total number of UMIs in each cell. e, Same as a but with colour gradient indicating percentage of SPβ prophage UMIs within each cell. f, Schematic of B. subtilis genome with location of PBSX and SPβ prophages indicated. g, Zero-centred and normalized expression of marker genes for each of 7 clusters identified in b. Marker genes were defined as detailed in Methods, where a maximum of 5 genes were included per cluster. h, Classification of cells with induced prophages. Green indicates cells with relative expression of PBSX genes >8.4% per cell, which is >10th percentile of PBSX prophage gene expression in cluster 5 from b. Red indicates cells with relative expression of SPβ genes >15.0% per cell, which is >10th percentile of SPβ prophage gene expression in cluster 6 from b. Brown indicates cells above both thresholds. i, Schematic of prophage classification results. The expected independent co-induction probability (calculated from observed PBSX and SPβ percentages) is 2.5%. j, Dual-colour smFISH of B. subtilis with no-drug treatment (left), or B. subtilis treated with ciprofloxacin for 90 min (right). Probes hybridizing to PBSX genes were labelled with a green fluorophore. Probes hybridizing to SPβ genes were labelled with a red fluorophore. Scale bar, 5 μm. k, Fluorescent reporter fusions of B. subtilis PL-gfp (PBSX promoter) and PyonO-mKate2 (SPβ promoter) treated with no drug (left), or treated with ciprofloxacin (right) for 150 min to allow for maturation of the fluorescent protein. Percentages of induction were calculated from a single set of acquired images (N = 1,394 cells). Scale bar, 5 μm.
Fig. 5
Fig. 5. M3-seq reveals limited host response to heterogeneous λ phage infection.
a, UMAP of λ phage-infected cells generated using alignments to both E. coli MG1655 and λ phage genomes (‘combined genome’). Colours indicate sampling timepoint after infection. b, Same as a but with colours indicating clusters of transcriptionally similar cells. c, Same as a but with colour gradient indicating normalized λ phage UMI count in each cell. Cluster 3 from b is strongly enriched for λ transcripts. We refer to this group of cells as the ‘lytic cluster’. d, Boxplots of normalized λ UMI count across each cluster in b (n = 4,326, 3,697, 1,189, 172). Boxplot limits are as defined in Methods. e, Zero-centred and normalized expression of marker genes for each of 4 clusters identified in b. Marker genes were identified as described in Methods. f, Representative composite time-lapse images of E. coli MG1655 infected with λ phage at MOI = 100. The red channel is a propidium iodide stain indicating cell death. Of cells in the initial frame, 34.1% were lysed. Data were collected from a single set of acquired images (N = 1,300 cells). Scale bar, 5 μm.
Extended Data Fig. 1
Extended Data Fig. 1. M3-seq experimental workflow and rRNA depletion scheme.
a. Detailed schematic of M3-seq experimental workflow: Populations of fixed and permeabilized bacteria are (i) aliquoted into wells of one or more 96 well plates. Each well contains a uniquely indexed random hexamer, which acts as a primer for (ii) in situ reverse transcription. These primers also carry unique molecular identifier (UMIs) sequences. During reverse transcription, cell-associated RNA molecules are converted to cDNAs with primer barcodes and UMIs on their 5’ ends. After reverse transcription, (iii) cells are pooled and loaded into a commercially available device for droplet-based indexing (herein, the Chromium Controller from 10x Genomics) without a need for limiting dilution. After partitioning into droplets, (iv) a second index is ligated onto the 5’ end of the reverse transcribed, cell-associated cDNAs (herein, using Next GEM Single Cell ATAC reagents from 10x Genomics). Following indexing, cells are lysed, and (v) cDNA molecules are converted to double-strand DNA using a Klenow enzyme and a random primer with a PCR handle at the 5’ end. This double-strand cDNA is then (vi) amplified by PCR, (vii) fragmented with Tn5 transposase loaded with Nextera read 2 primers, and (viii) attached to a T7 promoter via a second round of PCR. Next, (ix) cDNA molecules are transcribed back into RNA using T7 RNA polymerase. This step prepares the amplified library for rRNA depletion. After transcription, (x) the resulting RNA is annealed to a set of DNA probes that are complementary to rRNA sequences within the library (Supplementary Table 4). This annealing allows for selective degradation of those sequences with RNase H. Finally, in a second reverse transcription step, (xi) the indexed and rRNA-depleted library is converted back into cDNA, and (xii) the resulting cDNA is amplified one more time to add a required sequencing adaptor. The library is then ready for paired-end sequencing. b. Detailed schematic of rRNA depletion steps: To remove rRNA sequences from M3-seq libraries, we (i) convert indexed and amplified cDNA libraries into RNA via in vitro transcription, (ii) hybridized rRNA sequences within the library to DNA probes and digest those sequences using RNase H, and (iii) convert the remaining sequences back into DNA using a P5 primer.
Extended Data Fig. 2
Extended Data Fig. 2. Piloting single-cell RNA-sequencing in bacteria without rRNA depletion.
a. Distributions represent bacterial cells per droplet produced on the Chromium Controller (10x Genomics) at indicated cell loading numbers. Bacterial droplet loading was quantified as described in Materials and Methods. b. Representative image of droplets quantified in panel (A). E. coli cells, which were stained with Sytox green, are visible as green dots. c. Curves represent expected index collision rates (that is, percentage of cells with the same round-one index labelled with the same round-two index) as a function of loaded cells using different indexing schemes. d. Analysis of a mixture of exponential and stationary phase B. subtilis (blue) and E. coli (red) using only round-two (droplet-based) indexes. Species assignments for each ‘cell’ were made as determined in Materials and Methods. Data were generated without rRNA depletion (eBW1 in Supplementary Table 2). e. Same as (D) but analysis performed with combinatorial barcodes. f. Comparison of bulk RNA-seq data to pseudobulk, computationally rRNA-depleted single-cell gene expression in exponential phase E. coli from eBW1. Each point represents a single gene. r, Pearson correlation. g. Read counts per cell from single-cell gene expression data without rRNA depletion (1023 ± 436 reads for B. subtilis and 1926 ± 1054 reads for E. coli when considering rRNAs; 117 ± 81 reads for B. subtilis and 72 ± 72 reads for E. coli when considering only non-rRNAs). Data was collected from a single experiment; over B. subtilis 4601 cells and E. coli 5883 cells. Boxplot limits are as defined in Materials and Methods. h. Same as (G) but for UMI counts per cell (34 ± 13 UMIs for B. subtilis and 52 ± 23 UMIs for E. coli when considering rRNAs; 5 ± 5 UMIs for B. subtilis and 3 ± 3 UMIs for E. coli when considering only non-rRNAs). i. Same as (G) but for stationary phase B. subtilis (1838 cells) and E. coli (2094 cells) (720 ± 380 reads for B. subtilis and 1902 ± 1297 reads for E. coli when considering rRNAs; 23 ± 23 reads for B. subtilis and 0 ± 0 reads for E. coli when considering only non-rRNAs). j. Same as (H) but for stationary phase B. subtilis and E. coli (22 ± 10 UMIs for B. subtilis and 50 ± 30 UMIs for E. coli when considering rRNAs; 2 ± 2 UMIs for B. subtilis, and 0 ± 0 UMIs for E. coli when considering only non-rRNAs). Data above are reported as medians with maximum average deviation.
Extended Data Fig. 3
Extended Data Fig. 3. Additional analysis of M3-seq development.
a. Efficiency of rRNA depletion using two different post hoc approaches: degradation by rRNA-targeted Cas9, (yellow) and RNase H-mediated digestion after in vitro transcription (green). b. Comparison of gene expression data from rRNA-depleted and control libraries. Bulk libraries were prepared as in Materials and Methods. r, Pearson correlation. c. Comparison of 30 round-one barcode frequencies from an RNA-seq library before and after post hoc rRNA depletion. Bulk libraries were prepared and depleted of rRNA as in Materials and Methods. r, Pearson correlation. d. Percentages of tRNA sequences in B. subtilis and E. coli single-cell libraries prepared with and without rRNA depletion. Data from undepleted libraries come from eBW1, and data from depleted libraries come from eBW3. e. Same as (D) but for sRNAs. f. Same as (D) but for 5’ UTRs. g. Same as (D) but for 3’ UTRs. h. M3-seq analysis of a mixture of B. subtilis (blue) and E. coli (red) in late exponential phase (OD = 2.1, 2.0 respectively) wherein each point corresponds to a single ‘cell’. Species assignments as described in Materials and Methods. We observed a 13% collision rate, 30% corrected to include same-species collisions. Data were generated with rRNA depletion (eBW2 in Supplementary Table 2). i. Same as (H) but for B. subtilis and a different strain of E. coli (OD = 0.3, 0.3 respectively). Data were generated with rRNA depletion (eBW3 in Supplementary Table 2) and show a 12% collision rate, 32% corrected. j. Same as (I) but for cells in early stationary phase (OD = 2.4, 3.0 respectively). Data were generated with rRNA depletion (eBW3 in Supplementary Table 2) and show a 6.1% collision rate, 22% corrected. k. Same as (I) but for cells 90 minutes post ciprofloxacin treatment (eBW3 in Supplementary Table 2). Data show a 1.84% collision rate, 3.68% corrected, l. Genes per cell (after species assignment) observed in exponential phase cells across two experiments, eBW2 and eBW3 (298 ± 104 and 371 ± 82 median genes with absolute deviation for B. subtilis, respectively; 151 ± 47 and 75 ± 31 median genes with absolute deviation for E. coli MG1655, respectively; 175 ± 50 genes with for E. coli Nissle in eBW3). Boxplot limits are as defined in Materials and Methods.
Extended Data Fig. 4
Extended Data Fig. 4. M3-seq profiling during exponential growth and early stationary phase.
a. Top: UMAP of replicate M3-seq data generated from E. coli MG1655 treated with twice the minimum inhibitory concentration of ciprofloxacin, sampled after 6 hours of treatment. b. Same as (A) but for B. subtilis 168. c. Same as (A) but for E. coli Nissle. d. Comparison of replicate data from (A) using mean log normalized UMI counts per cell (that is, unique UMIs relative to total UMIs per cell averaged across all cells for each gene). Each point represents a single gene. r, Pearson correlation. e. Same as (D) but using data from (B). f. Same as (D) but using data from (C). g. Comparison of RNA-seq data to M3-seq pseudobulk profiles from exponential phase E. coli from eBW3. Pseudobulk measurements were obtained by normalizing UMI counts by the total number of UMIs in the dataset and log transforming the normalized counts. Each point represents a single gene. r, Pearson correlation.
Extended Data Fig. 5
Extended Data Fig. 5. M3-seq profiling during exponential growth and early stationary phase.
a. UMAPs of E. coli MG1655 transcriptomes in exponential and early stationary phase (top) and associated clustering (bottom, set to the lowest clustering resolution parameter). Clustering set at the lowest resolution parameter. Axes denote the first two UMAP components. b. Same as (A) but for E. coli Nissle. c. Same as (A) but for B. subtilis 168. d. GO term enrichment of select biological process calculated with marker genes identified for populations of exponential and stationary phase E. coli MG1655 identified in (A). Marker genes were determined as described in Materials and Methods. The p-values are -log10 transformed such that the most strongly enriched biological processes have the highest score. Selected processes were those with the lowest p-values after thresholding at 0.05. Enrichments for exponential and stationary phase cells include expected processes (green and red, respectively), including growth related and energy generation processes (exponential) and those involving secondary carbon metabolism and the TCA cycle (stationary). e. Same as (D) but for E. coli Nissle. Similar to E. coli MG1655, enrichments include expected processes (green for exponential; red for stationary). f. Same as (D) but for B. subtilis 168. Similar to E. coli, enrichments include expected processes (green for exponential; red for stationary).
Extended Data Fig. 6
Extended Data Fig. 6. Subpopulation of early stationary phase cells expressing acid-tolerance genes also identified in E. coli Nissle.
a. UMAP of E. coli Nissle transcriptomes from cells at early stationary phase (OD = 2.6). Colours indicate clusters of transcriptionally similar cells. b. GO-term enrichment of select biological processes calculated with marker genes identified for cluster 3 in (A). Marker gene identification and GO term analyses were performed as described in Materials and Methods. c. Same as (A) but with colour gradient indicating expression of gadABC genes (in normalized UMI counts). d. Zero-centred and normalized expression of marker genes for each cluster identified in (A). Marker genes were defined as described in Materials and Methods. e. Schematics of gadABC genes in the two strains of E. coli used in this study: MG1655 and Nissle. f. Same as (A) but with colour gradient indicating number of UMIs captured in each cell. g. Normalized cluster percentage for each BC1 in each cluster (N = 1, 1295, 1053, 83, 68 cells respectively). The normalized percentage for each BC1/cluster combination and boxplot limits are determined as described in Materials and Methods. h. Plot depicts survival of wildtype E. coli MG1655 and ∆gadABC mutant with and without exposure to acid stress during early stationary phase. Curves indicate mean values, and the shaded regions the 95% confidence interval between 2 biological replicates for control samples, and 4 biological replicates for acidified samples. i. Plot depicts fluorescence intensity of individual PgadB-GFP transformed E. coli MG1655 cells during acid exposure as described in Materials and Methods. Fluorescence intensity tracks are broken out by the time of death of each cell. j. Plot depicts growth of E. coli transformed with gadBC (solid) or gfp (dashed) transgene under different concentrations of IPTG inducer. Curves indicate mean values, and the shaded regions the 95% confidence interval between 3 technical replicates for each sample. k. Single-cell fluorescence distributions of E. coli transformed with GFP transgene after induction. l. Representative growth and GFP fluorescence intensity traces of E. coli transformed with PgadB-gfp during growth into stationary phase. m. Fluorescence kymograph of E. coli transformed with PgadB-gfp over time from (K). n. Single-cell growth rates of gad- and gad+ cells from (L,M) using time-lapse microscopy. gad- and gad+ cells were determined as described in Materials and Methods (N = 1, 93, 78 cells respectively). Growth rates were computed as described in Materials and Methods. p = 0.00032 obtained from independent, two-sided t-test.
Extended Data Fig. 7
Extended Data Fig. 7. Multiplexed single-cell analysis of bacterial response to eight different antibiotics.
a. Zero-centered and normalized expression of select genes in E. coli MG1655 cultures treated with the indicated antibiotics. Data from eBW4 (Supplementary Table 2). Genes were selected from among those related to the following GO terms: ‘Response to DNA damage’, ‘Cell wall stress’, and ‘Ribosome’. b. Same as (A) but for B. subtilis. Genes were selected from among those related to the ‘Response to DNA damage’ and ‘Ribosome’ GO terms and by searching for genes known to be upregulated in response to treatment with cell-wall targeting antibiotics (that is cefuroxime). c. UMAPs of E. coli MG1655 transcriptomes after treatment with indicated antibiotics (top) and corresponding cluster assignments (bottom). Clusters were uniquely defined for each population. d. Same as (C) but for B. subtilis 168.
Extended Data Fig. 8
Extended Data Fig. 8. Defining MGE-expressing populations of E. coli using M3-seq data.
a. UMAP of E. coli MG1655 transcriptomes from cells treated with the bacteriostatic antibiotics tetracycline and chloramphenicol. Colour gradient indicates normalized expression of pinQ, a marker gene for cluster 8 identified in Fig. 3e. b. Same as (A) but with colour gradient indicating normalized expression of tfaQ, a marker gene for cluster 13 identified in Fig. 3e. c. Same as (A) but with colour gradient indicating normalized expression of ydfK, a marker gene for cluster 12 identified in Fig. 3e. d. Same as (A) but with colour gradient indicating normalized expression of insI-2, a marker gene for cluster 16 identified in Fig. 3e. e. Plots of cells in principal component space for E. coli treated with bacteriostatic antibiotics, wherein the colour gradient indicates normalized pinQ expression. The principal component dimensions chosen for this analysis contained high loadings in genes that were upregulated in rare subpopulations (for example, pinQ, tfaQ). f. Same as (E) but with colour gradient indicating normalized tfaQ expression. g. Same as (E) but with colour gradient indicating normalized ydfK expression. h. Same as (E) but with colour gradient indicating normalized insI-2 expression. i. Kurtosis of all 100 computed principal components calculated from the single-cell transcriptomes of tetracycline- and chloramphenicol-treated E. coli MG1655. Notably, principal components with the highest kurtosis were not necessarily the same as those with the highest variance. j. Kurtosis of 15 principal components computed from tetracycline- and chloramphenicol-treated E. coli MG1655 cells, with individual curves corresponding to calculations from down-sampled subsets of cells with and without UMI counts scrambled among genes. Notably, scrambling abolishes the kurtosis signal and removes structure from clustering. Curves indicate mean values, and the shaded region the 95% confidence interval across N = 5 independent down-samplings. k. Same as (J) but for down-sampled subsets of cells with and without UMI counts scrambled among cells across N = 5 down-samplings.
Extended Data Fig. 9
Extended Data Fig. 9. Growth and gene expression in E. coli cells infected with λ phage.
a. Growth and gene expression in E. coli cells infected with λ phage. A. Plot depicts growth of E. coli grown to early exponential phase (OD ~ 0.2–0.3) and infected with λ phage (MOI ~ 100) or supplemented with phage vehicle (LB). Curves indicate mean values, and shaded error bars are 95% confidence intervals. b. Replicate plaque assays of λ phage grown on E. coli MG1655 without magnesium (the same conditions used in phage infection experiments eBW4). c. Pseudobulk comparison of the infected sample compared to an exponential phase control. Each point represents a single gene, and the red dots represent λ phage genes. d. Zero-centered and normalized expression of all observed λ genes for each cluster identified in Fig. 5b. Genes displayed were those genes which had more than 10 UMIs across the entire population. Expression of λ genes is strongly enriched in the lytic cluster (3) but lower in the rest of the population. e. Boxplot of E. coli and λ UMIs/cell of lytic (1189 cells) and non-lytic cells (8195 cells). Boxplot limits are as defined in Materials and Methods. We report a median of 57 ± 35 E. coli UMIs, 0 ± 0 λ UMIS for non-lytic cells, and 55 ± 34 E. coli UMIs, 18 ± 14 λ UMIs for lytic cells. Data was collected in a single sequencing experiment (N = 1). f. Volcano plot of all host genes when comparing the cells in the lytic cluster to cells outside the cluster. Fold changes and p-values were computed using the FindMarkers function in Seurat, where the ‘min.pct’ and ‘logfc.threshold’ were both set to 0. g. UMAP of phage infected cells generated using alignments to only the E. coli MG1655 genome. Colors indicate sampling timepoint after infection. h. Same as (G) but with colors indicating clusters of transcriptionally similar cells assigned after re-performing clustering with only E. coli transcripts. i. Same as (G) but with colour gradient indicating normalized λ phage UMI count in each cell. j. Boxplots of normalized λ UMI count across each cluster in (H) (N = 4215, 2885, 2075, 209 cells). Boxplot limits are as defined in Materials and Methods. k. Silhouette scores computed using the principal components of the lytic cluster (see Fig. 5b, c) and of ‘null subpopulation’ which is a random sample of cells across each alignment.

Similar articles

Cited by

References

    1. Ochi K, Kandalas JC, Freese E. Initiation of Bacillus subtilis sporulation by the stringent response to partial amino acid deprivation. J. Biol. Chem. 1981;256:6866–6875. doi: 10.1016/S0021-9258(19)69072-1. - DOI - PubMed
    1. Dörr T, Lewis K, Vulić M. SOS response induces persistence to fluoroquinolones in Escherichia coli. PLoS Genet. 2009;5:e1000760. doi: 10.1371/journal.pgen.1000760. - DOI - PMC - PubMed
    1. Balaban NQ, Merrin J, Chait R, Kowalik L, Leibler S. Bacterial persistence as a phenotypic switch. Science. 2004;305:1622–1625. doi: 10.1126/science.1099390. - DOI - PubMed
    1. Peyrusson F, et al. Intracellular Staphylococcus aureus persisters upon antibiotic exposure. Nat. Commun. 2020;11:2200. doi: 10.1038/s41467-020-15966-7. - DOI - PMC - PubMed
    1. Macosko EZ, et al. Highly parallel genome-wide expression profiling of individual cells using nanoliter droplets. Cell. 2015;161:1202–1214. doi: 10.1016/j.cell.2015.05.002. - DOI - PMC - PubMed

Publication types

MeSH terms