. 2023 Aug 31;14(1):4956.
doi: 10.1038/s41467-023-40617-y.

Autocrine TGF-β-positive feedback in profibrotic AT2-lineage cells plays a crucial role in non-inflammatory lung fibrogenesis

Affiliations

Autocrine TGF-β-positive feedback in profibrotic AT2-lineage cells plays a crucial role in non-inflammatory lung fibrogenesis

Yasunori Enomoto et al. Nat Commun. .

Abstract

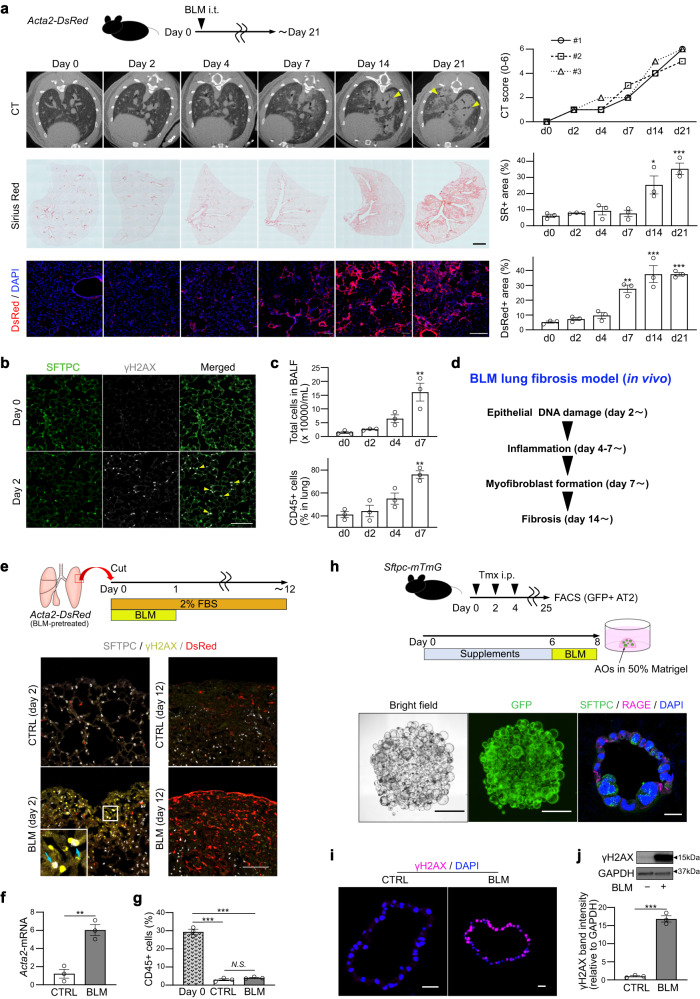
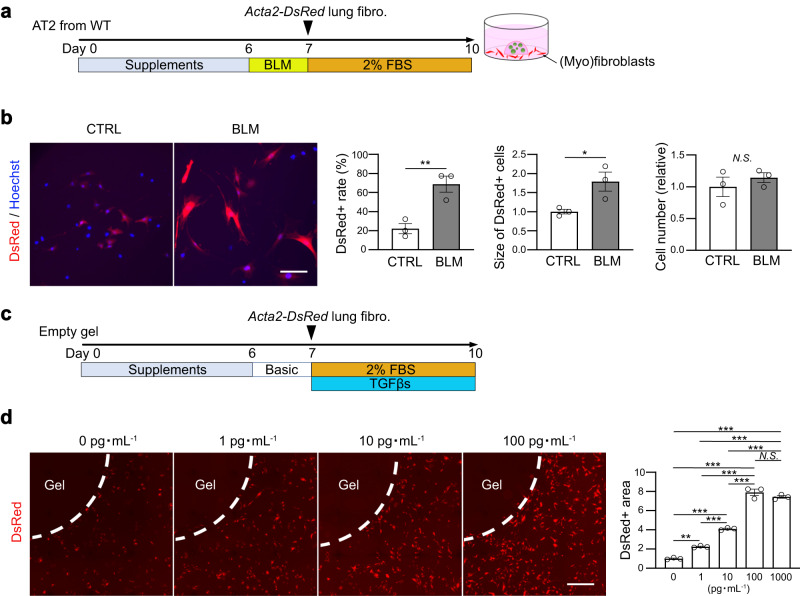
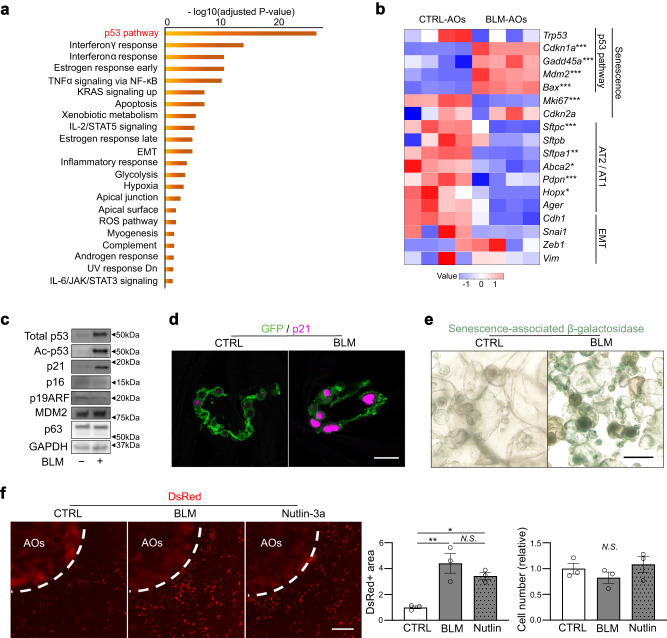
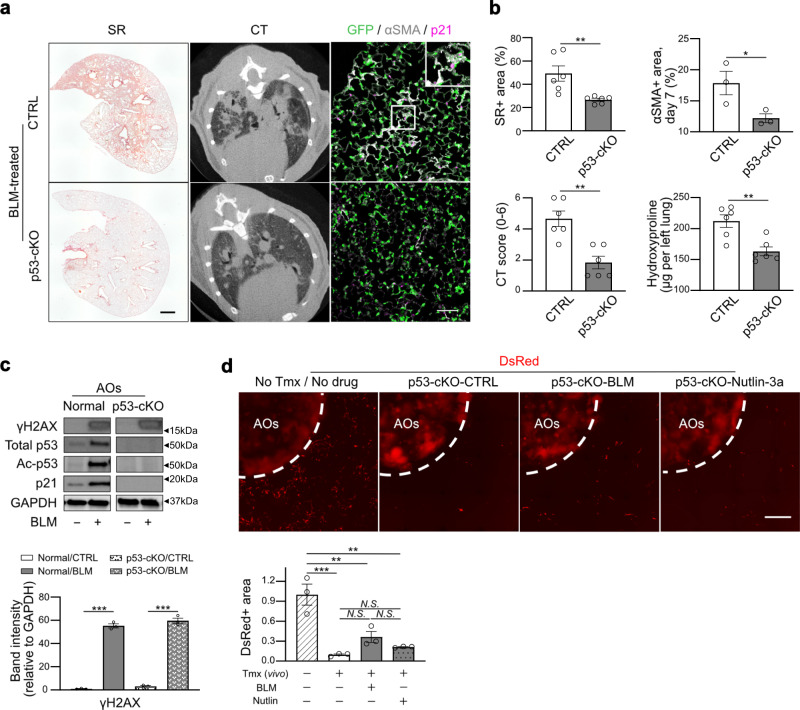
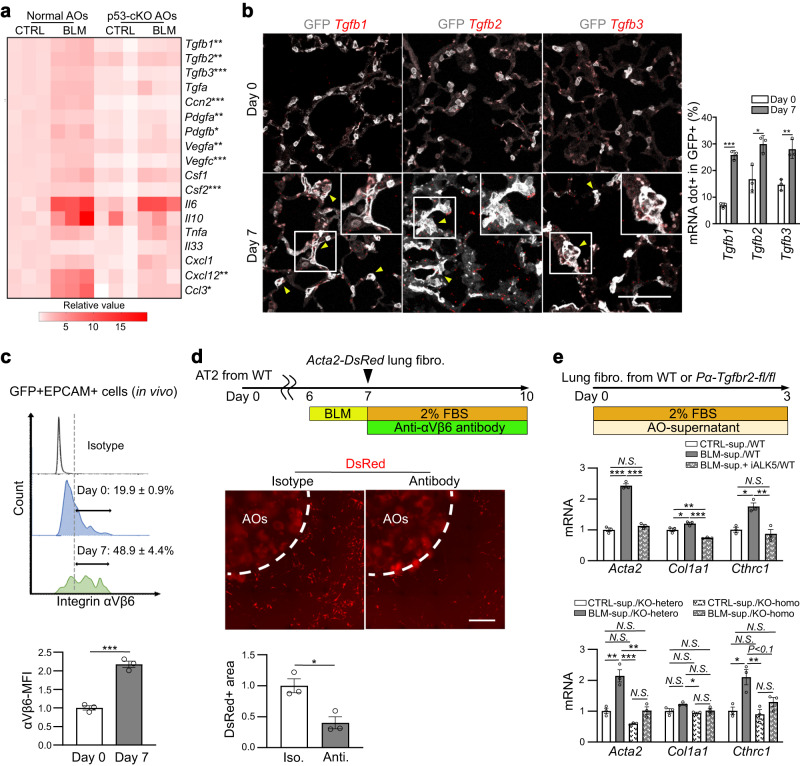
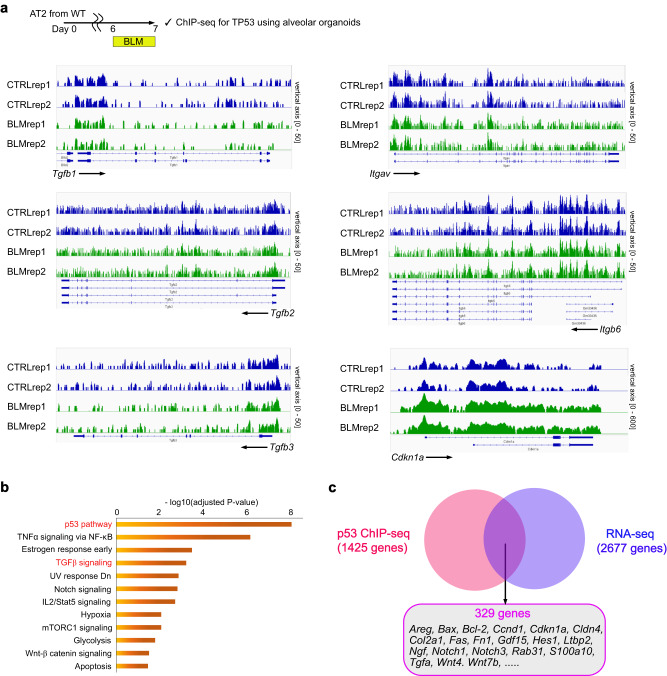
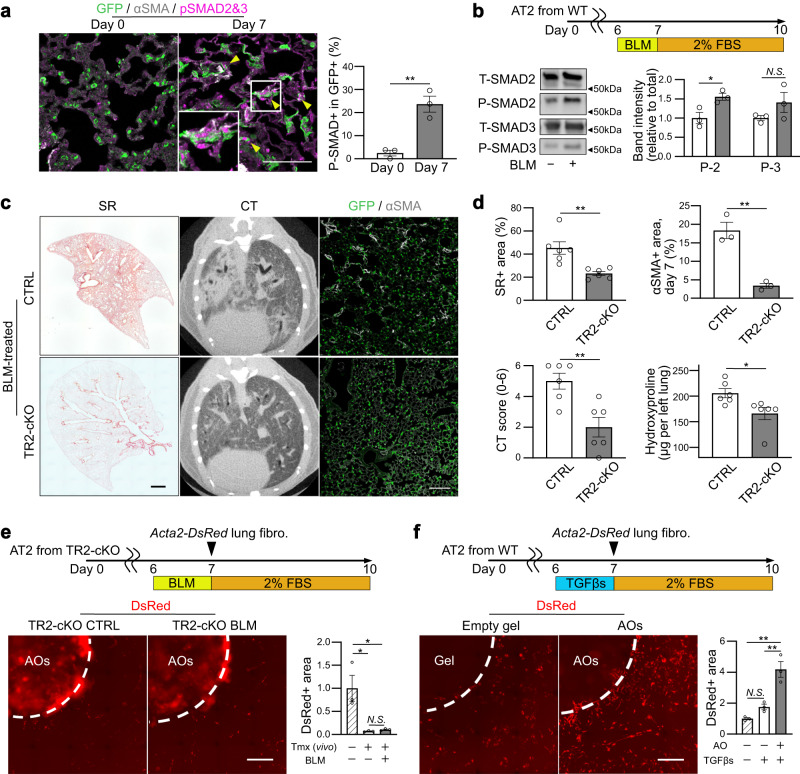
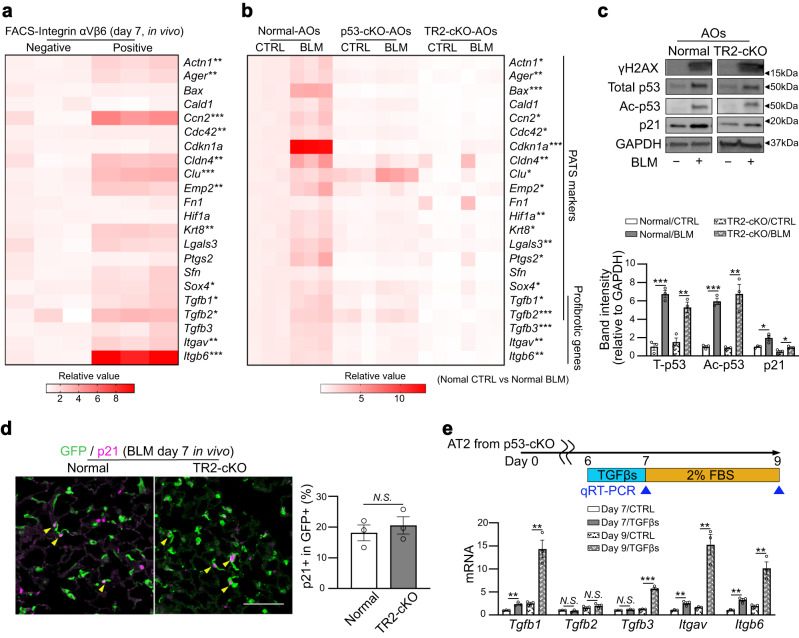
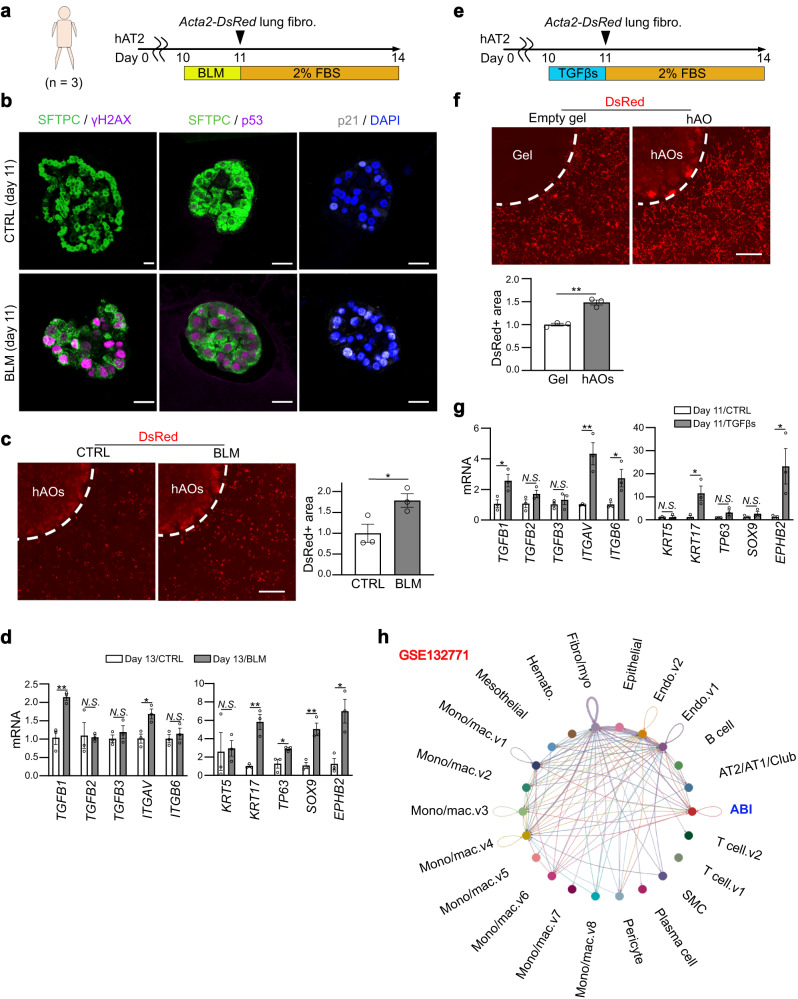
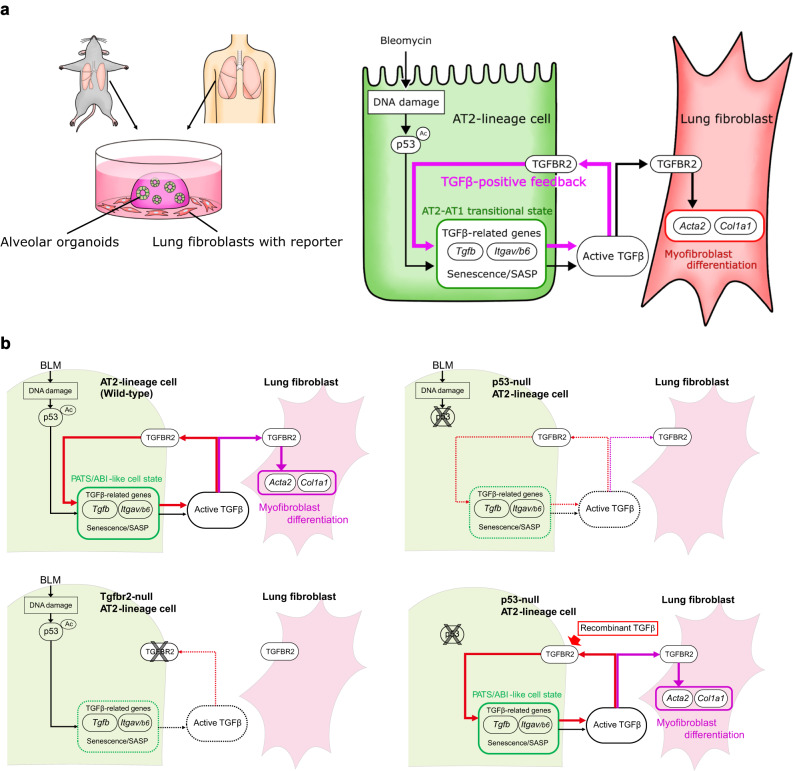
The molecular etiology of idiopathic pulmonary fibrosis (IPF) has been extensively investigated to identify new therapeutic targets. Although anti-inflammatory treatments are not effective for patients with IPF, damaged alveolar epithelial cells play a critical role in lung fibrogenesis. Here, we establish an organoid-based lung fibrosis model using mouse and human lung tissues to assess the direct communication between damaged alveolar type II (AT2)-lineage cells and lung fibroblasts by excluding immune cells. Using this in vitro model and mouse genetics, we demonstrate that bleomycin causes DNA damage and activates p53 signaling in AT2-lineage cells, leading to AT2-to-AT1 transition-like state with a senescence-associated secretory phenotype (SASP). Among SASP-related factors, TGF-β plays an exclusive role in promoting lung fibroblast-to-myofibroblast differentiation. Moreover, the autocrine TGF-β-positive feedback loop in AT2-lineage cells is a critical cellular system in non-inflammatory lung fibrogenesis. These findings provide insights into the mechanism of IPF and potential therapeutic targets.


Conflict of interest statement

T.F. is an employee of Otsuka Pharmaceutical Co., Ltd, but there is no financial competing interest in this study. The other authors declare no competing interests.

Figures

Fig. 1
Fig. 1. BLM-induced lung fibrosis model with mice, ex vivo culture, and in vitro organoid culture.
a Serial assessment of BLM-induced lung fibrosis model in vivo using micro-CT (upper), Sirius Red (SR) staining (middle; scale bar: 1 mm), and DsRed reporter (lower; scale bar: 200 μm). Triangles on micro-CT images indicate fibrosis areas. Right graphs are the quantifications. CT score in each timing is derived from three independent mice. Other data represent the mean ± SEM of results obtained from three independent mice in each timing. *P < 0.05, **P < 0.01, ***P < 0.001 compared to day 0. b Lung sections on days 0 and 2 stained for SFTPC, γH2AX (scale bar: 100 μm). Triangles indicate γH2AX, SFTPC-double positive cells. c The number of total cells in BALF (upper) and percentages of CD45+ cells in whole lung lysates (lower). Data represent the mean ± SEM of results obtained from three independent mice. **P < 0.01 compared to day 0. d Summary scheme of BLM-induced lung fibrosis model in vivo. e Diagram of ex vivo lung-lobe culture and sections of the cultured lung tissue stained for SFTPC, γH2AX, and DsRed fluorescence (scale bar: 100 μm). Arrows indicate γH2AX-positive AT2 cells. f qRT-PCR of ex vivo cultured lungs. Data represent the mean ± SEM of the results obtained from three independent mice. **P < 0.01. g Evaluation of CD45+ cells by FACS for ex vivo cultured lung on day 12. Data represent the mean ± SEM of the results obtained from three independent mice. ***P < 0.001 compared to day 0. h Diagram of alveolar organoid (AO) culture and in vitro BLM treatment, images of untreated AOs in bright-field and GFP fluorescence on day 8 (scale bar: 1 mm), and sections stained for SFTPC and RAGE (scale bar: 20 μm). i Sections of BLM-treated AOs stained for γH2AX (scale bar: 20 μm). j Western blotting of CTRL- and BLM-AOs for γH2AX and GAPDH and the quantification. The lanes were run on the same gel. Data represent the mean ± SEM of results obtained from three independent mice. All statistical analyses are evaluated by unpaired two-tailed Student’s t-test or one-way analysis of variance with Bonferroni correction, as appropriate.
Fig. 2
Fig. 2. Fluorescence reporter system for differentiating myofibroblasts activated by profibrotic alveolar organoids.
a Diagram of co-culture using AOs from wild-type (WT) mice with primary lung fibroblasts from Acta2-DsRed mice. b Representative images of co-cultured (myo)fibroblasts (scale bar: 100 μm) and quantification of the number and the relative size of DsRed+ myofibroblasts and the relative number of total fibroblasts around the AO-containing gel. Data represent the mean ± SEM of results obtained from three independent mice. *P < 0.05, **P < 0.01 (unpaired, two-tailed Student’s t test). c Diagram of sensitivity analysis using Acta2-DsRed lung fibroblasts using mixed TGF-β1/β2/β3. d Representative images of (myo)fibroblasts (scale bar: 1 mm) and quantification of the relative DsRed+ area around the gel. Data represent the mean ± SEM of results obtained from three independent mice. **P < 0.01, ***P < 0.001 (one-way analysis of variance with Bonferroni correction).
Fig. 3
Fig. 3. BLM treatment activates the p53 pathway and profibrotic cellular senescence phenotype in alveolar organoids.
a Enriched pathways of bulk RNA-seq data of BLM-treated AOs using “MSigDB Hallmark 2020”. A total of 2677 genes that were significantly upregulated in BLM-AOs (compared to CTRL-AOs) were evaluated. Data were obtained from four independent Tamoxifen-treated SftpcCreERT2: Rosa26mTmG mice. The names of upregulated genes and normalized CPM values are included in Supplementary Data 2. P values are evaluated using the Fisher’s exact test that assumes a binomial distribution and independence for probability of any gene belonging to any set. b Heatmap visualization of selected genes (senescence-, cell lineage-, and epithelial-mesenchymal transition [EMT]-related genes) via bulk RNA-seq of CTRL- and BLM-AOs. *FDR < 0.05, **FDR < 0.01, ***FDR < 0.001 (Benjamini-Hochberg method). c Representative images of protein expression of CTRL- and BLM-AOs via western blotting for total p53, acetylated p53 (Lys379), p21Waf1/Cip1, p16, p19ARF, MDM2, p63, and GAPDH. The samples were derived from the same experiment and gels/blots were processed in parallel. d Representative images of AO sections stained with anti-GFP and anti-p21 antibodies (scale bar: 20 μm). e Representative images of AOs stained with senescence-associated β-galactosidase (scale bar: 200 μm). f Representative images of co-cultured (myo)fibroblasts using AOs (from wild-type mice) treated with BLM (100 μM, 24 h) or Nutlin-3a (2 μM, 24 h) (scale bar: 1mm), quantification of the relative DsRed+ area around the AO-containing gel, and the relative number of total fibroblasts. Data represent the mean ± SEM of results obtained from three independent mice. *P < 0.05, **P < 0.01 (one-way analysis of variance with Bonferroni correction).
Fig. 4
Fig. 4. Profibrotic significance of p53 signaling in AT2(-lineage) cells.
a Representative images of the lung sections for Sirius Red (SR) staining (scale bar: 1 mm), lung mCT, and lung sections stained with anti-GFP, anti-p21, and anti-αSMA antibodies (scale bar: 100 μm). SftpcCreERT2; Rosa26mTmG mice (CTRL) and SftpcCreERT2; Trp53flox/flox; Rosa26mTmG mice (p53-cKO) were treated with BLM. b Quantification of SR staining (day 21, n = 6), mCT (day 21, n = 6), αSMA+ area (day 7, n = 3), and hydroxyproline in the left lungs (day 21, n = 6). Data represent the mean ± SEM of results obtained from three or six independent mice. *P < 0.05, **P < 0.01 (unpaired, two-tailed Student’s t test). c Representative images of the protein expression of AOs from SftpcCreERT2; Trp53flox/flox; Rosa26mTmG mice (p53-cKO) via western blotting for total p53, acetylated p53, p21, γH2AX, and GAPDH. The lanes were run on the same gel but were noncontiguous. The samples were derived from the same experiment and gels/blots were processed in parallel. The lower graph is the quantification of γH2AX expression. For p53 and p21, no bands were detected in p53-cKO-derived AO. Data represent the mean ± SEM of results obtained from three independent mice. ***P < 0.001 (unpaired, two-tailed Student’s t test). d Representative images of co-cultured (myo)fibroblasts using p53-cKO AO treated with BLM (100 μM, 24 h) or Nutlin-3a (2 μM, 24 h) (scale bar:1 mm) and quantification of the relative DsRed+ area around the AO-containing gel. Data represent the mean ± SEM of results obtained from three independent mice. **P < 0.01, ***P < 0.001 (one-way analysis of variance with Bonferroni correction).
Fig. 5
Fig. 5. TGF-β-related genes in BLM-treated AT2-lineage cells exclusively contribute to myofibroblast differentiation within SASP factors.
a Heatmap visualization of mRNA expression of SASP factors evaluated by qRT-PCR using normal AOs from SftpcCreERT2; Rosa26mTmG mice and p53-cKO AOs from SftpcCreERT2; Trp53flox/flox; Rosa26mTmG mice. AOs were treated with 100 μM BLM for 24 h, and harvested on culture day 9. Data were obtained from three independent mice. *P < 0.05, **P < 0.01, ***P < 0.001 compared between BLM-treated normal AOs and BLM-treated p53-cKO AOs (unpaired, two-tailed Student’s t test). b Representative images of lung sections for in situ hybridization and quantification using SftpcCreERT2; Rosa26mTmG mice on days 0 and 7 after BLM injection in vivo. Yellow triangles indicate mRNA-dot-positive GFP+ AT2-lineage cells. Data represent the mean ± SEM of results obtained from three independent mice. *P < 0.05, **P < 0.01, ***P < 0.001 (unpaired, two-tailed Student’s t test). (scale bar: 100 μm). c FACS panels with quantification of mean fluorescence intensity (MFI) for integrin αVβ6 using GFP+ AT2-lineage cells (days 0 and 7, in vivo). Data represent the mean ± SEM of results obtained from three independent mice. ***P < 0.001 compared to day 0 (unpaired, two-tailed Student’s t test). d Experimental set-up, representative images of co-cultured AOs and myofibroblasts (scale bar: 1 mm), and quantification of the relative DsRed+ area around the AO-containing gel using normal AOs treated with BLM (100 μM, 24 h) and subsequently with a neutralizing antibody against integrin αVβ6 (100 μg mL−1, 72 h). Data represent the mean ± SEM of results obtained from three independent mice. *P < 0.05 (unpaired, two-tailed Student’s t test). e Diagram of the experiments and comparison of mRNA expression levels by qRT-PCR for primary lung fibroblasts. Lung fibroblasts were isolated from wild-type mice (upper panel) or tamoxifen-treated transgenic mice (lower panel): PdgfraCreERT2; Tgfbr2flox/flox or PdgfraCreERT2; Tgfbr2flox/+. These fibroblasts were treated with culture supernatants from normal AOs that were pre-treated with BLM (100 μM, 24 h) and then cultured for the next 72 h. Data represent the mean ± SEM of results obtained from three independent mice. *P < 0.05, **P < 0.01, ***P < 0.001 (one-way analysis of variance with Bonferroni correction).
Fig. 6
Fig. 6. ChIP-seq of BLM-treated alveolar organoids suggests that p53 indirectly induces TGF-β signaling.
a p53 bindings at TGF-β related genes and Cdkn1a (a positive control). b Enriched pathways of genes targeted by p53 in BLM-treated alveolar organoids (AOs) analyzed by “MSigDB Hallmark 2020”. A total of 1425 genes that showed significantly higher peaks in BLM-AOs (compared to CTRL-AOs) were evaluated. Data were obtained from two independent wild-type mice. c Venn diagram of the genes with higher peaks in ChIP-seq and those with higher mRNA expressions in RNA-seq in BLM-AOs (compared to CTRL-AOs).
Fig. 7
Fig. 7. Identification of cell-autonomous TGF-β-positive feedback loop in AT2-lineage cells.
a Representative images of immunostaining (scale bar: 100 μm) and quantification. Lung sections from BLM-treated SftpcCreERT2; Rosa26mTmG mice were stained with anti-GFP, anti-phosphorylated SMAD (p-SMAD) 2&3, and anti-αSMA antibodies. Triangles indicate p-SMAD2&3+GFP+ AT2-lineage cells. Data represent the mean ± SEM of results obtained from three independent mice. **P < 0.01 compared to day 0 (unpaired, two-tailed Student’s t test). b Experimental set-up, representative images of protein expression of AOs via western blotting for total/phosphorylated SMAD2/3, and quantification. The samples were derived from the same experiment and gels/blots were processed in parallel. Data represent the mean ± SEM of results obtained from three independent mice. *P < 0.05 (unpaired, two-tailed Student’s t test). The lanes were run on the same gel. c Representative images of the lung sections for SR staining (scale bar: 1 mm), lung mCT, and lung sections stained with anti-GFP and anti-αSMA antibodies (scale bar: 100 μm). The SftpcCreERT2; Rosa26mTmG mice (CTRL) and SftpcCreERT2; Tgfbr2flox/flox; Rosa26mTmG mice (TR2-cKO) were treated with BLM in vivo. d Quantification of SR staining (day 21, n = 6), mCT (day 21, n = 6), αSMA+ area (day 7, n = 3), and hydroxyproline in the left lungs (day 21, n = 6). Data represent the mean ± SEM of results obtained from three or six independent mice. *P < 0.05, **P < 0.01 (unpaired, two-tailed Student’s t-test). e Representative images of co-cultured (myo)fibroblasts using TR2-cKO AO treated with BLM (100 μM, 24 h) (scale bar: 1 mm) and quantification of the relative DsRed+ area around the AO-containing gel. Data represent the mean ± SEM of results obtained from three independent mice. *P < 0.05 (one-way analysis of variance with Bonferroni correction). f Representative images of co-cultured (myo)fibroblasts using normal AO treated with mixed TGF-β1/β2/β3 (5 pg mL−1 each, 24 h) (scale bar: 1 mm) and quantification of the relative DsRed+ area around the empty or AO-containing gel. Data represent the mean ± SEM of results obtained from three independent mice. **P < 0.01 (one-way analysis of variance with Bonferroni correction).
Fig. 8
Fig. 8. TGF-β signaling activation drives AT2-lineage cells to transit PATS-like transitional state and to acquire profibrotic characters.
a Heatmap visualization of mRNA expression levels (for PATS-related and profibrotic genes) was performed by qRT-PCR using integrin αVβ6-positive or -negative GFP+ AT2-lineage cells isolated from BLM-treated SftpcCreERT2; Rosa26mTmG mouse lungs (day 7, in vivo). Data were obtained from three independent mice. *P < 0.05, **P < 0.01, ***P < 0.001 (unpaired, two-tailed Student’s t test). b Heatmap visualization of mRNA expression levels (for PATS-related and profibrotic genes) was performed by qRT-PCR using normal AOs (from SftpcCreERT2; Rosa26mTmG mice), p53-cKO AOs (from SftpcCreERT2; Trp53flox/flox; Rosa26mTmG mice), and TR2-cKO AOs (from SftpcCreERT2; Tgfbr2flox/flox; Rosa26mTmG mice). AOs were treated with BLM (100 μM, 24 h), and sampling was performed on culture day 9. Data were obtained from three independent mice. *P < 0.05, **P < 0.01, ***P < 0.001 compared between untreated CTRL normal AOs and BLM-treated normal AOs (unpaired, two-tailed Student’s t test). c Representative images of protein expression of TR2-cKO AOs treated with BLM (100 μM, 24 h) via western blotting for γH2AX, total p53, acetylated p53 (Lys379), p21, and GAPDH. The lanes were run in the same gel but were noncontiguous. The samples were derived from the same experiment and gels/blots were processed in parallel. The lower graph is the quantification. Data represent the mean ± SEM of results obtained from three independent mice analyzed using unpaired two-tailed Student’s t test (compared to each control). d Representative images of immunostaining (scale bar: 100 μm) and quantification. Lung sections from BLM-treated SftpcCreERT2; Rosa26mTmG mice (CTRL) and SftpcCreERT2; Tgfbr2flox/flox; Rosa26mTmG mice (TR2-cKO) were stained with anti-GFP and anti-p21 antibodies, respectively. Yellow triangles indicate p21+GFP+ AT2-lineage cells. Data represent the mean ± SEM of results obtained from three independent mice analyzed using unpaired two-tailed Student’s t test. e Comparison of mRNA expression levels of TGF-β-related genes evaluated by qRT-PCR using p53-cKO AOs (from SftpcCreERT2; Trp53flox/flox; Rosa26mTmG mice). AOs were treated with mixed TGF-β1/β2/β3 (5 ng·mL−1 each, 24 h), and sampling was performed on culture days 7 and 9. Data represent the mean ± SEM of results obtained from three independent mice. **P < 0.01, ***P < 0.001 compared between untreated CTRL-AOs and TGF-β-treated AOs in each time point (unpaired, two-tailed Student’s t test).
Fig. 9
Fig. 9. Profibrotic TGF-β-positive feedback loop is evolutionally conserved in human AT2 cells.
a Diagram of AO culture for the lung fibrosis model using human AT2 cells and primary lung fibroblasts from Acta2-DsRed mice. Human lung samples were collected from three subjects. b Representative images of sections of hAOs treated with BLM (100 μM, 24 h) on day 11 of culture stained with anti-SFTPC, anti-H2AX, anti-p53, and anti-p21 antibodies, and DAPI (scale bar: 20 μm). For p53 and p21 expressions, an identical sphere is stained. c Representative images of co-cultured (myo)fibroblasts treated with BLM (100 μM, 24 h) (scale bar: 1 mm) and quantification of the relative DsRed+ area around the hAO-containing gel. Data represent the mean ± SEM of results obtained from three subjects. *P < 0.05 (unpaired, two-tailed Student’s t-test). d Comparison of mRNA expression levels evaluated by qRT-PCR in BLM-treated hAOs. Data represent the mean ± SEM of results obtained from three subjects. *P < 0.05, **P < 0.01 (unpaired, two-tailed Student’s t test). e Diagram of AO culture for the lung fibrosis model using human AT2 cells and primary lung fibroblasts from Acta2-DsRed mice. The AOs were treated with a mixture of TGF-β1/β2/β3 (5 ng mL−1 each, 24 h). f Representative images of co-cultured (myo)fibroblasts using hAOs treated with mixed TGF-β1/β2/β3 (scale bar: 1 mm) and quantification of the relative DsRed+ area around the hAO-containing gel. Data represent the mean ± SEM of results obtained from three subjects. **P < 0.01 (unpaired, two-tailed Student’s t test). g Comparison of mRNA expression levels evaluated by qRT-PCR in TGF-β-treated hAOs. Data represent the mean ± SEM of the results obtained from three subjects. *P < 0.05, **P < 0.01 (unpaired, two-tailed Student’s t test). h Reanalysis of single-cell RNA-seq data from lung samples isolated from patients with idiopathic pulmonary fibrosis. The interaction of TGF-β signaling between each cell type, including autocrine, was estimated using the CellChat algorithm.
Fig. 10
Fig. 10. Summary of our findings.
a DNA damage by BLM activates p53 signaling in AT2 cells to upregulate TGF-β-related profibrotic gene expression, which initiates a positive-feedback loop for TGF-β signaling within AT2 cells. This process directly induces fibroblast-to-myofibroblast differentiation even without immune cells. b Cascade schema in each setting (genotype/stimulation): wild-type/BLM; p53-null/BLM; Tgfbr2-null/BLM; p53-null/recombinant TGF-β.

References

    1. Raghu G, et al. Diagnosis of idiopathic pulmonary fibrosis. an official ATS/ERS/JRS/ALAT clinical practice guideline. Am. J. Respir. Crit. Care Med. 2018;198:e44–e68. - PubMed
    1. Travis WD, et al. An official American Thoracic Society/European Respiratory Society statement: update of the international multidisciplinary classification of the idiopathic interstitial pneumonias. Am. J. Respir. Crit. Care Med. 2013;188:733–748. - PMC - PubMed
    1. Fujisawa, T. et al. Nationwide cloud-based integrated database of idiopathic interstitial pneumonias for multidisciplinary discussion. Eur. Respir. J. 53, 10.1183/13993003.02243-2018 (2019). - PMC - PubMed
    1. Sgalla G, et al. Idiopathic pulmonary fibrosis: pathogenesis and management. Respir. Res. 2018;19:32. - PMC - PubMed
    1. Mei Q, Liu Z, Zuo H, Yang Z, Qu J. Idiopathic pulmonary fibrosis: an update on pathogenesis. Front. Pharm. 2021;12:797292. - PMC - PubMed

Publication types

Substances