. 2023 Sep;55(9):2051-2066.
doi: 10.1038/s12276-023-01085-y. Epub 2023 Sep 1.

CircFam190a: a critical positive regulator of osteoclast differentiation via enhancement of the AKT1/HSP90β complex

Affiliations

CircFam190a: a critical positive regulator of osteoclast differentiation via enhancement of the AKT1/HSP90β complex

Kun Chen et al. Exp Mol Med. 2023 Sep.

Abstract

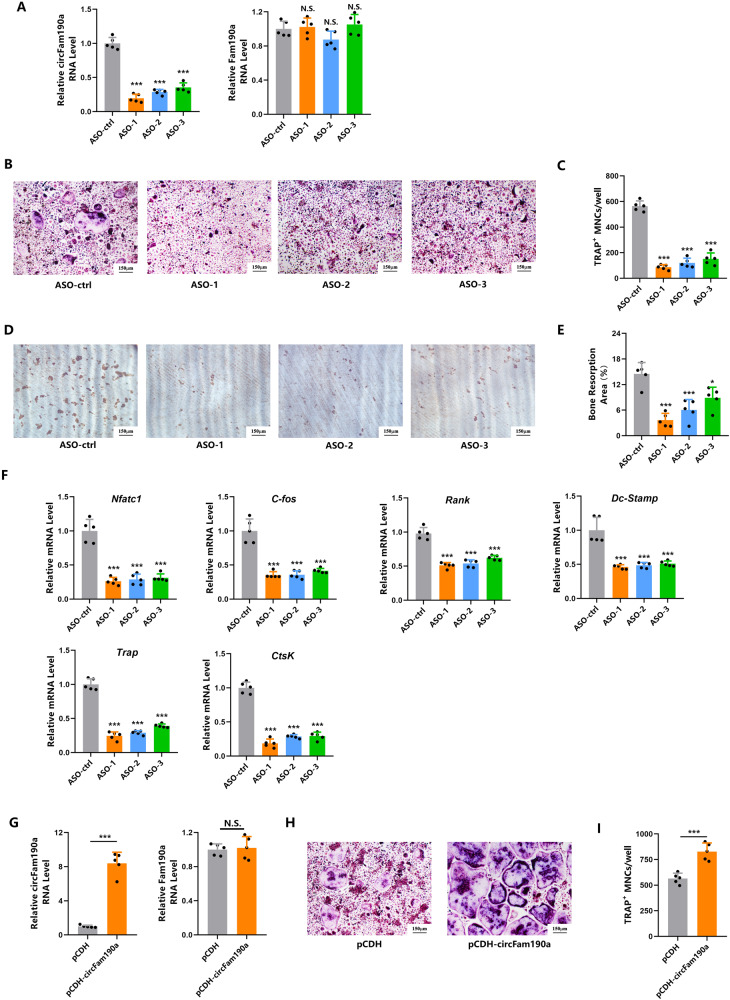
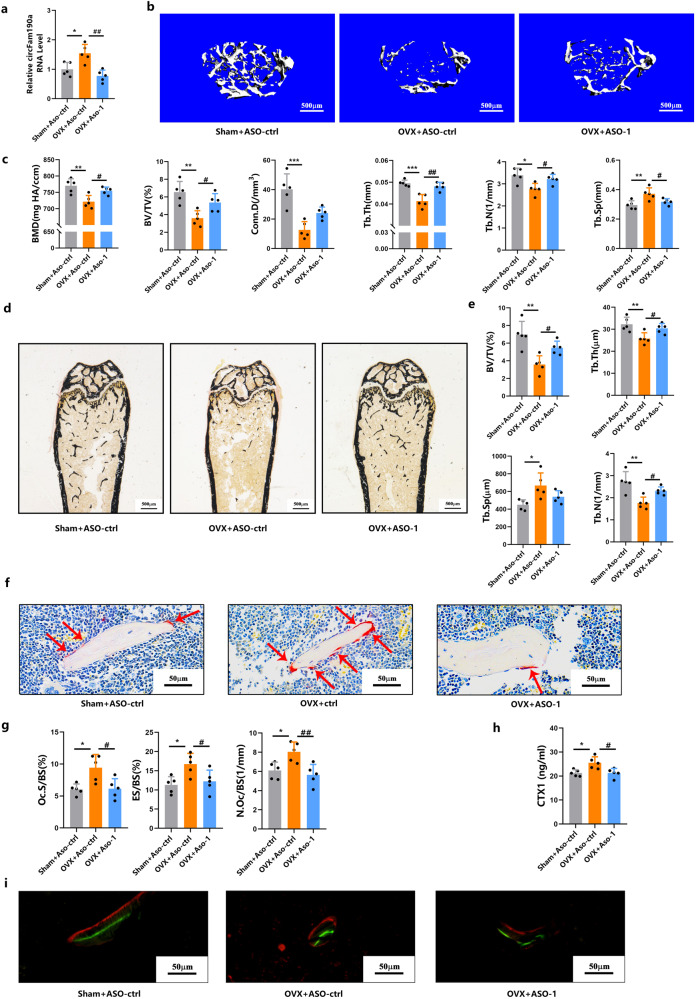
The identification of key regulatory factors that control osteoclastogenesis is important. Accumulating evidence indicates that circular RNAs (circRNAs) are discrete functional entities. However, the complexities of circRNA expression as well as the extent of their regulatory functions during osteoclastogenesis have yet to be revealed. Here, based on circular RNA sequencing data, we identified a circular RNA, circFam190a, as a critical regulator of osteoclast differentiation and function. During osteoclastogenesis, circFam190a is significantly upregulated. In vitro, circFam190a enhanced osteoclast formation and function. In vivo, overexpression of circFam190a induced significant bone loss, while knockdown of circFam190a prevented pathological bone loss in an ovariectomized (OVX) mouse osteoporosis model. Mechanistically, our data suggest that circFam90a enhances the binding of AKT1 and HSP90β, promoting AKT1 stability. Altogether, our findings highlight the critical role of circFam190a as a positive regulator of osteoclastogenesis, and targeting circFam190a might be a promising therapeutic strategy for treating pathological bone loss.


Conflict of interest statement

The authors declare no competing interests.

Figures

Fig. 1
Fig. 1. Identification of circFam190a, a circular RNA implicated in osteoclastogenesis.
a Scheme of the strategies employed for circRNA-seq and circRNA screening. b Heatmap illustrating the continuously upregulated circRNAs. c qRT‒PCR analysis of selected circRNAs in undifferentiated (D0) and late-stage (D5) osteoclasts. Statistical significance: ***P < 0.001, **P < 0.01 (n = 5). d Sequencing analysis of the head-to-tail splicing junction in circFam190a. e Validation of the existence of circFam190a in osteoclasts using qRT‒PCR. Divergent primers amplified circFam190a in cDNA but not genomic DNA (gDNA). CircMap3k5 served as a positive control, and Gapdh was used as a negative control. Yellow arrows indicate divergent primers, while green arrows indicate convergent primers. Representative of three independent experiments. f qRT‒PCR analysis of relative RNA levels in osteoclasts treated with or without RNase R. Statistical significance: ***P < 0.001, N.S., not significant, n = 5. g qRT‒PCR analysis of relative RNA levels in osteoclasts treated with or without ActD. Statistical significance: ***P < 0.001, N.S., not significant, n = 5. h qRT‒PCR analysis of the relative circFam190a RNA levels in BMMs isolated from the sham and OVX mice. Statistical significance: *P < 0.05, (n = 5). i qRT‒PCR analysis of relative circFam190a RNA levels during osteoclast differentiation. Statistical significance: ***P < 0.001 compared to D0 (n = 5).
Fig. 2
Fig. 2. CircFam190a promotes osteoclast formation and function in vitro.
A Expression levels of circRNA circFam190a and linear RNA Fam190a in BMMs transfected with ASOs. Statistical significance: ***P < 0.001 compared to the ASO-ctrl group, N.S., not significant, n = 5. B, C TRAP staining (B) and quantification (C) of osteoclasts in the control and circFam190a knockdown groups. Statistical significance: ***P < 0.001 compared to the ASO-ctrl group, n = 5. D, E Bone resorption pit assay: representative images of dentin slices seeded with control or circFam190a knockdown osteoclasts (D) and quantification (E) of the bone resorption area. The brown area indicates the bone resorption area. Statistical significance: ***P < 0.001 compared to the ASO-ctrl group, P < 0.05 compared to the ASO-ctrl group, n = 5. F Relative RNA levels of osteoclast-specific genes in the control and circFam190a knockdown osteoclasts. Statistical significance: ***P < 0.001 compared to the ASO-ctrl group, n = 5. G Expression levels of circRNA circFam190a and linear RNA Fam190a in BMMs transfected with pCDH (control) and pCDH-circFam190a. Statistical significance: ***P < 0.001 compared to the control group, N.S., not significant, n = 5. H, I TRAP staining (H) and quantification (I) of osteoclasts in the control and circFam190a overexpression groups. Statistical significance: ***P < 0.001 compared to the control group, N.S., not significant, n = 5.
Fig. 3
Fig. 3. Knockdown of circFam190a protects mice from pathological bone loss in an osteoporosis mouse model.
a Relative circFam190a RNA levels in BMMs collected from the indicated mice. Statistical significance: *P < 0.05 compared to the sham+ASO-ctrl group, ##P < 0.01 compared to the OVX + ASO-ctrl group, n = 5. b Representative micro-CT images of mouse left femurs. c Quantification of bone parameters using micro-CT. BMD bone mineral density, BV/TV bone volume/total volume, Tb.N trabecular bone number, Tb.Th trabecular bone thickness, Tb.Sp trabecular bone separation, Conn.D connectivity density. Statistical significance: ***P < 0.001 compared to the sham+ASO-ctrl group, **P < 0.01 compared to the sham+ASO-ctrl group, *P < 0.05 compared to the sham+ASO-ctrl group, ##P < 0.01 compared to the OVX + ASO-ctrl group, #P < 0.05 compared to the OVX + ASO-ctrl group, n = 5. d Representative von Kossa staining images of undecalcified sections from the right femurs of mice. e Histomorphometric analysis of undecalcified sections from the right femurs of mice. BV/TV bone volume/total volume, Tb.Th trabecular bone thickness, Tb.Sp trabecular bone space, Tb.N trabecular bone number. Statistical significance: **P < 0.01 compared to the sham+ASO-ctrl group, *P < 0.05 compared to the sham+ASO-ctrl group, #P < 0.05 compared to the OVX + ASO-ctrl group, n = 5. f Representative TRAP staining images of undecalcified sections from the right femurs of mice. Red arrows indicate osteoclasts. g Histomorphometric analysis of osteoclast-related parameters: Oc. S/BS osteoclast surface/bone surface, ES/BS eroded surface/bone surface, Oc.N/BS osteoclast number/bone surface, Statistical significance: *P < 0.05 compared to the sham+ASO-ctrl group, ##P < 0.01 compared to the OVX + ASO-ctrl group, #P < 0.05 compared to the OVX + ASO-ctrl group, n = 5. h Serum bone resorption marker CTX-1 levels in the indicated mice. Statistical significance: *P < 0.05 compared to the sham+ASO-ctrl group, #P < 0.05 compared to the OVX + ASO-ctrl group, n = 5. i Representative double labeling images of trabecular bone from the right femurs of mice. The green line indicates the first injection of calcein, and the red line indicates the second injection of Alizarin red.
Fig. 4
Fig. 4. CircFam190a is regulated by FUS and binds directly to HSP90β/AKT1.
a Volcano plot showing differential gene expression in BMMs treated with RANKL for 24 h vs. untreated BMMs (controls). Each scattered point represents a gene: the x-axis represents the log2-fold change in the ratio of RANKL-treated cells vs. untreated cells, and the y-axis represents the −log10 of the P value. Red dots indicate significantly upregulated genes, while yellow dots indicate significantly downregulated genes. b RIP assays of BMMs using FUS and IgG antibodies. The precipitate was subjected to WB analysis with FUS antibodies, and the relative RNA level was calculated by qRT‒PCR. Statistical significance: ***P < 0.001, N.S., not significant, n = 5. c Relative circFam190a RNA levels in osteoclasts with or without FUS knockdown. Statistical significance: ***P < 0.001, n = 5. d RNA-FISH staining assay of osteoclasts indicating the localization of circFam190a (red) with nuclei stained with DAPI (blue). The data shown are representative of three independent experiments. e Identification of circFam190a cytoplasmic and nuclear distribution by qRT‒PCR analysis in osteoclasts. GAPDH and U6 were applied as positive controls in the cytoplasm and nucleus, respectively. Statistical significance: ***P < 0.001, n = 5. f Biotin-labeled sense or antisense circFam190a probes were used for RNA‒protein pulldown against osteoclast lysates. Proteins that interact with circFam190a were identified by Coomassie brilliant blue staining. The red arrow indicates the major differential band precipitated. g Analysis pipeline used to identify proteins that interact with circFam190a. h Immunoblot analysis of the biotin-labeled sense and antisense circFam190a probe pulldown eluate from osteoclast lysates. GAPDH was used as a loading control. The data shown are representative of three independent experiments. i RIP assays of osteoclasts using AKT1 and IgG antibodies. The precipitate was subjected to WB with AKT1 antibodies. The relative RNA level was calculated by qRT‒PCR. Statistical significance: ***P < 0.001, n = 5. j RIP assays of osteoclasts using HSP90β and IgG antibodies. The precipitate was subjected to WB with HSP90β antibodies. The relative RNA level was calculated by qRT‒PCR. Statistical significance: ***P < 0.001, n = 5. k Two-step RNA-binding protein immunoprecipitation: osteoclasts cotransfected with Flag-AKT1 and HA-HSP90β were used to perform sequential immunoprecipitation with anti-Flag and anti-HA antibodies. The precipitate was subjected to WB with antibodies against Flag-AKT1 and HA-HSP90β. The data shown are representative of three independent experiments. l RIP assays of osteoclasts transfected with full-length AKT1 or its deletion mutants using Flag antibody. The circFam190a level was detected by semiquantitative RT‒PCR agarose gels. The data shown are representative of three independent experiments. m RIP assays of osteoclasts transfected with full-length HSP90β or its deletion mutants using HA antibody. The circFam190a level was shown by semiquantitative RT‒PCR agarose gel. The data shown are representative of three independent experiments.
Fig. 5
Fig. 5. CircFam190a Protects AKT1 from Proteasome-Mediated Degradation.
a BMMs transfected with control (ASO-ctrl) or circFam190a knockdown (ASO-1, ASO-2, ASO-3) LNA-ASOs were cultured with M-CSF and RANKL for 3 days. Whole cell lysates were collected for WB analysis. The data shown are representative of three independent experiments. b BMMs transfected with control ASO-ctrl or circFam190a knockdown (ASO-1) LNA-ASOs were treated with DMSO or 10 μM MG132 for 12 h. Whole cell lysates were collected for WB. The data shown are representative of three independent experiments. c Cycloheximide chase assay comparing the stability of AKT1 and HSP90β in BMMs transfected with ASO-ctrl or ASO-1 LNA-ASOs. The indicated cells were treated with cycloheximide (50 μg/ml) for the indicated times, and cell lysates were subjected to WB analysis with AKT1 and HSP90β antibodies, along with a GAPDH control. The data shown are representative of three independent experiments. d Ubiquitination assays of AKT1. BMMs transfected with control (ASO-ctrl) or circFam190a knockdown (ASO-1) LNA-ASOs were transfected with HA-Ub and treated with 10 μM MG132 for 8 h. The whole cell lysate was immunoprecipitated by AKT1 antibody. The precipitate was subjected to WB with antibodies against HA and AKT1. The data shown are representative of three independent experiments. e, f Immunoprecipitation analysis of the association between HSP90β and AKT1 in MG132-treated BMMs with the control (ASO-ctrl) or circFam190a knockdown (ASO-1) LNA-ASOs. The whole cell lysate was immunoprecipitated with IgG and HSP90β (e) or AKT1 (f) antibodies. The precipitate was subjected to WB with antibodies against HSP90β and AKT1. The data shown are representative of three independent experiments. g, h Immunoprecipitation analysis of the association between HSP90β and AKT1 in MG132-treated BMMs transfected with control (pCDH) or circFam190a overexpression (pCDH-circFam190a) plasmids. The whole cell lysate was immunoprecipitated with IgG and HSP90β (g) or AKT1 (h) antibodies. The precipitate was subjected to WB with antibodies against HSP90β and AKT1. The data shown are representative of three independent experiments. i Mammalian two-hybrid assays measuring interactions between AKT1 and HSP90β with or without circFam190a knockdown. The indicated combinations of pBIND/pACT plasmids were transfected into BMMs with either the control ASO (ASO-ctrl) or circFam190a knockdown ASO (ASO-1) before measuring relative luciferase activity (a proxy for the interaction between proteins). The presence of transfected fusion proteins was verified by Western blot analysis of cell lysates. Statistical significance: ***P < 0.001, N.S., not significant, n = 5. j Mammalian two-hybrid assays measuring interactions between AKT1 and HSP90β with or without overexpression of circFam190a. The indicated combinations of pBIND/pACT plasmids were transfected into BMMs bearing either a control plasmid (pCDH) or the circFam190a overexpression plasmid pCDH-circFam190a before measuring relative luciferase activity (a proxy for the interaction between proteins). The presence of the transfected fusion proteins was verified by Western blot analysis of cell lysates. Statistical significance: ***P < 0.001, N.S., not significant, n = 5.
Fig. 6
Fig. 6. CircFam190a promotes osteoclast formation in an AKT1-dependent manner in vitro.
a, b KEGG pathway enrichment analysis (a) and heatmap of osteoclast-related genes (b) in transcriptome analysis comparing osteoclasts with or without circFam190a knockdown. BMMs with the control (ASO-ctrl) or circFam190a knockdown (ASO-1) LNA-ASOs were cultured with M-CSF and RANKL for 72 h to induce osteoclast differentiation. Whole RNA samples were collected and subjected to transcriptome analysis. c, d Relative TRAP RNA levels (c) and WB analysis (d) of osteoclasts with or without circFam190a knockdown and AKT1 overexpression. BMMs were transfected with the indicated ASOs (ASO-ctrl or ASO-1) and plasmids (pCDH or pCDH-AKT1) and cultured with M-CSF and RANKL for 72 hours to induce osteoclast differentiation. For mRNA analysis, ***P < 0.001 compared to the ASO-ctrl + pCDH group, ###P < 0.001 compared to the ASO-1 + pCDH group, n = 5. For WB, the data shown are representative of three independent experiments. e, f TRAP staining (e) and quantification (f) of osteoclasts with or without circFam190a knockdown and AKT1 overexpression. BMMs were transfected with the indicated ASOs (ASO-ctrl or ASO-1) and plasmids (pCDH or pCDH-AKT1) and cultured with M-CSF and RANKL for 5 days to induce mature osteoclast formation. Statistical significance: ***P < 0.001 compared to the ASO-ctrl + pCDH group, ###P < 0.001 compared to the ASO-1 + pCDH group, n = 5. g, h Relative TRAP RNA levels (g) and WB analysis (h) of osteoclasts with or without circFam190a overexpression and the indicated treatment. BMMs received the indicated treatment (pCDH, pCDH-circFam190a or/and siHSP90β) and were cultured with or without MK-2206 in the presence of M-CSF and RANKL for 72 h. For mRNA analysis, ***P < 0.001 compared to the pCDH group, ###P < 0.001 compared to the pCDH-circFam190a group, n = 5. For WB, the data shown are representative of three independent experiments. i, j TRAP staining (i) and quantification (j) of osteoclasts with or without circFam190a overexpression and the indicated treatment. BMMs received the indicated treatment (pCDH, pCDH-circFam190a or/and siHSP90β) and were cultured with or without MK-2206 in the presence of M-CSF and RANKL for 5 days. Statistical significance: ***P < 0.001 compared to the pCDH group, ###P < 0.001 compared to the pCDH-circFam190a group, n = 5.
Fig. 7
Fig. 7. Inhibition of AKT signaling rescues the osteoclast phenotype induced by circFam190a in vivo.
a Relative circFam190a RNA levels in BMMs collected from the indicated mice. Statistical significance: ***P < 0.001 compared to the AAV + PBS group, N.S., not significant, n = 5. b Representative TRAP staining images of undecalcified sections from the right femurs of mice. Red arrows indicate osteoclasts. c Histomorphometric analysis of osteoclast-related parameters: Oc.S/BS: osteoclast surface/bone surface, Oc.N/BS: osteoclast number/bone surface. Statistical significance: *P < 0.05 compared to the AAV + PBS group, #P < 0.05 compared to the AAV-CircFam190a+PBS group, N.S., not significant, n = 5. d Representative micro-CT images of mouse left femurs. e Quantification of bone parameters by micro-CT. BMD bone mineral density, BV/TV bone volume/total volume, Tb.N trabecular bone number, Tb.Th trabecular bone thickness, Tb.Sp trabecular bone separation, Conn.D connectivity density. Statistical significance: *P < 0.05 compared to the AAV + PBS group, **P < 0.01 compared to the AAV + PBS group, ***P < 0.001 compared to the AAV + PBS group, #P < 0.05 compared to the AAV-circFam190a+PBS group, N.S., not significant, n = 5. f Representative von Kossa staining images of undecalcified sections from the right femurs of mice. g Histomorphometric analysis of undecalcified sections from the right femurs of mice. BV/TV bone volume/total volume, Tb.Th trabecular bone thickness, Tb.Sp trabecular bone space, Tb.N trabecular bone number, statistical significance: *P < 0.05 compared to the AAV + PBS group, **P < 0.01 compared to the AAV + PBS group, #P < 0.05 compared to the AAV-circFam190a+PBS group, n = 5. h Serum bone resorption marker CTX-1 levels from the indicated mice. Statistical significance: *P < 0.05 compared to the AAV + PBS group, #P < 0.05 compared to the AAV-circFam190a+PBS group, n = 5. i Working model of circFam190a as a critical positive regulator during osteoclastogenesis.

References

    1. Boyle WJ, Simonet WS, Lacey DL. Osteoclast differentiation and activation. Nature. 2003;423:337–342. doi: 10.1038/nature01658. - DOI - PubMed
    1. Teitelbaum SL, Ross FP. Genetic regulation of osteoclast development and function. Nat. Rev. Genet. 2003;4:638–649. doi: 10.1038/nrg1122. - DOI - PubMed
    1. Väänänen HK, Zhao H, Mulari M, Halleen JM. The cell biology of osteoclast function. J. Cell Sci. 2000;113:377–381. doi: 10.1242/jcs.113.3.377. - DOI - PubMed
    1. Roodman GD. Regulation of osteoclast differentiation. Ann. NY Acad. Sci. 2006;1068:100–109. doi: 10.1196/annals.1346.013. - DOI - PubMed
    1. Kikuta J, Ishii M. Osteoclast migration, differentiation and function: novel therapeutic targets for rheumatic diseases. Rheumatology. 2013;52:226–234. doi: 10.1093/rheumatology/kes259. - DOI - PubMed

Publication types