. 2023 Sep;55(9):2005-2024.
doi: 10.1038/s12276-023-01074-1. Epub 2023 Sep 1.

Scalable production of tissue-like vascularized liver organoids from human PSCs

Affiliations

Scalable production of tissue-like vascularized liver organoids from human PSCs

Sean P Harrison et al. Exp Mol Med. 2023 Sep.

Abstract

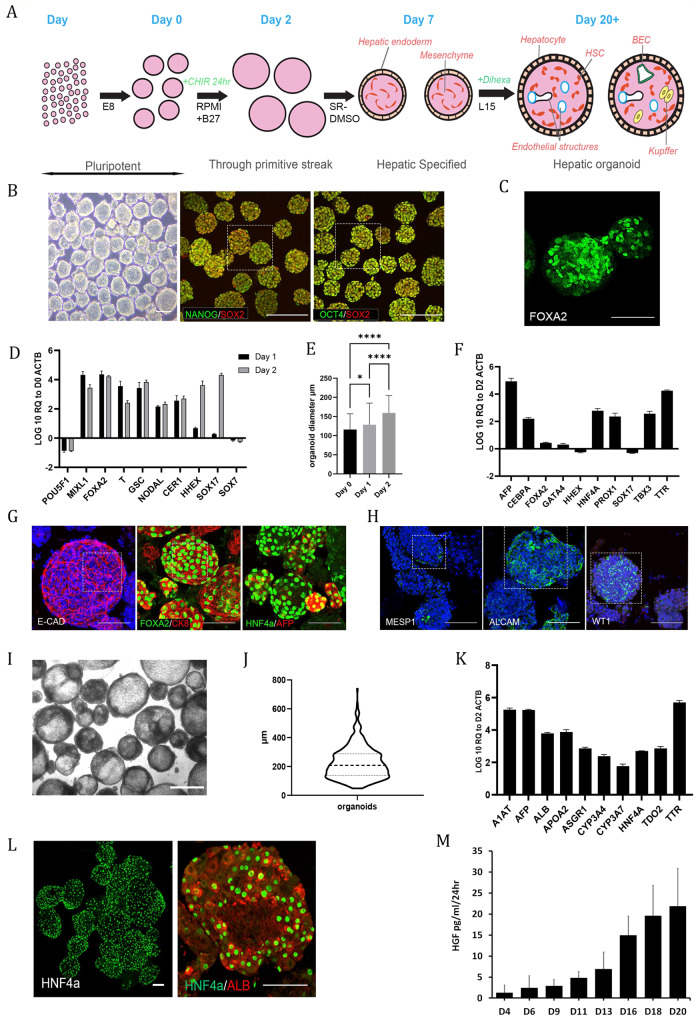
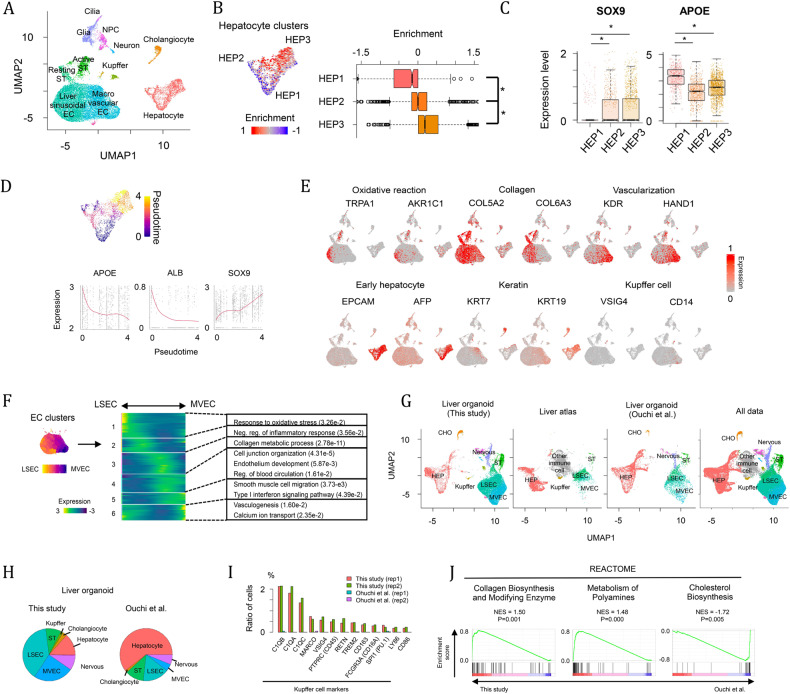
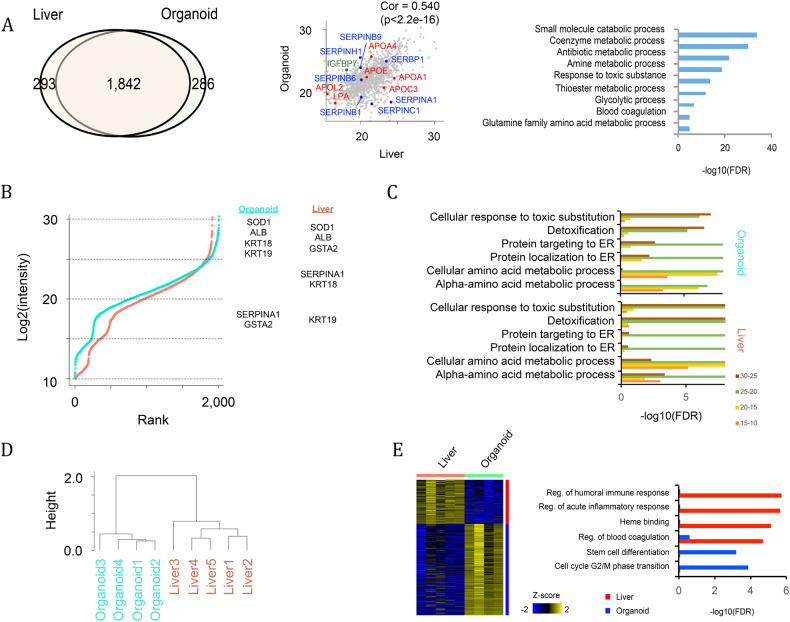
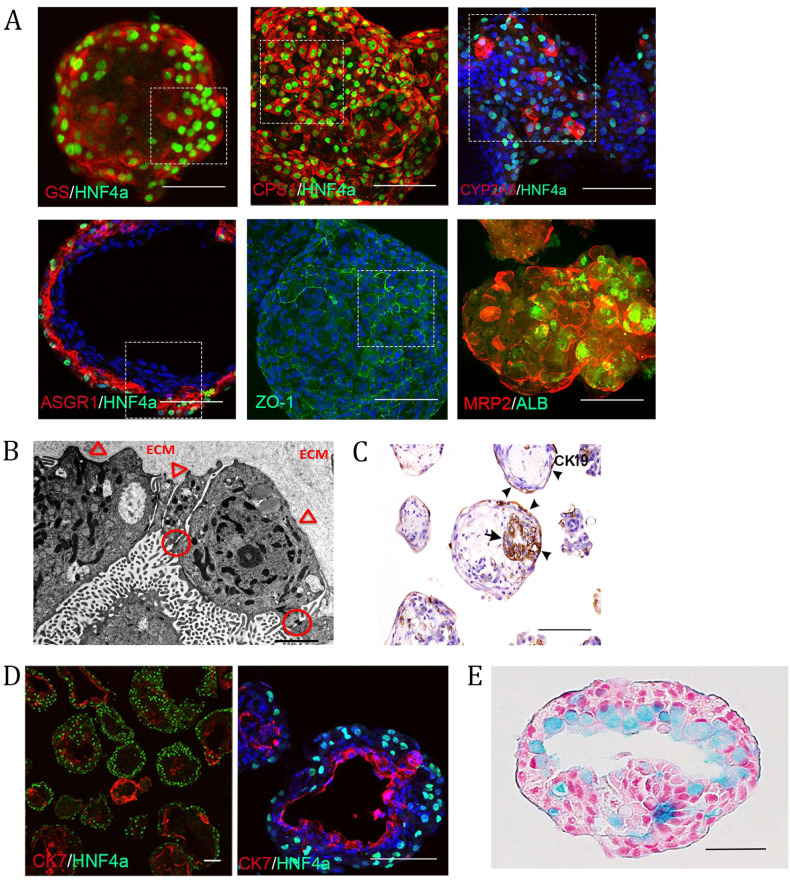
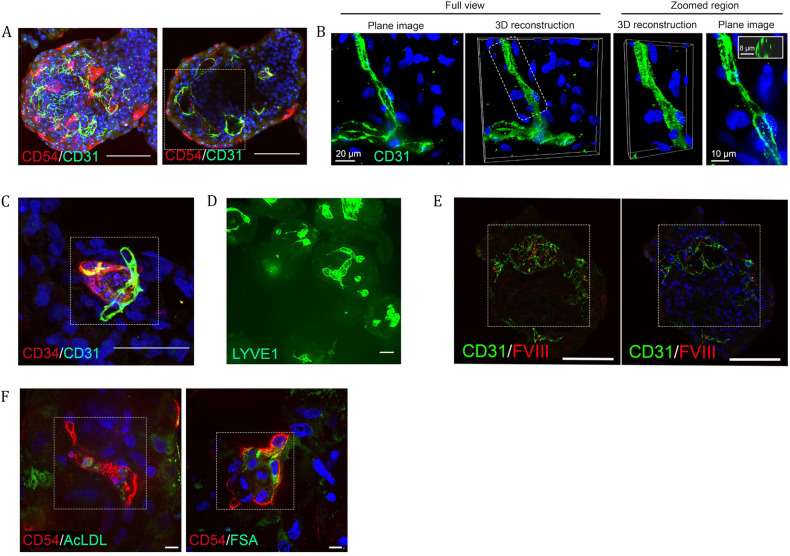
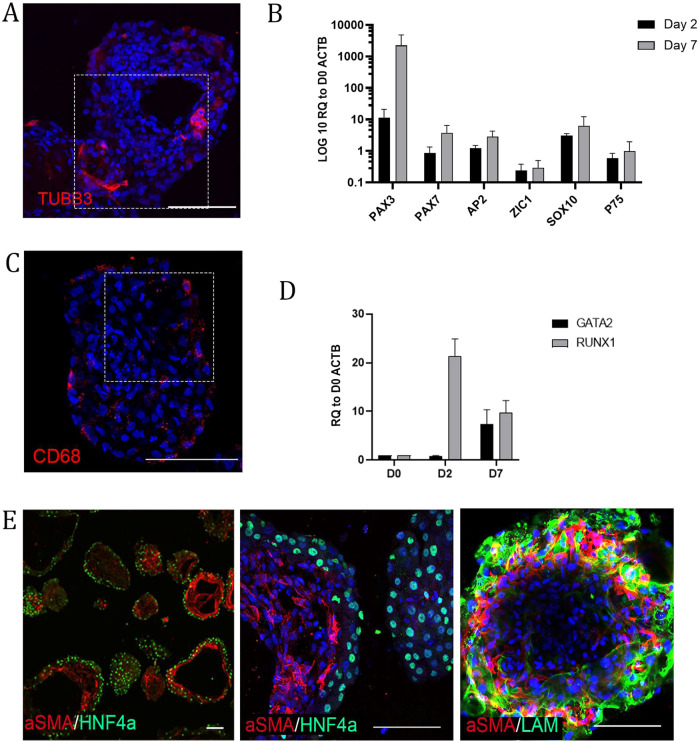
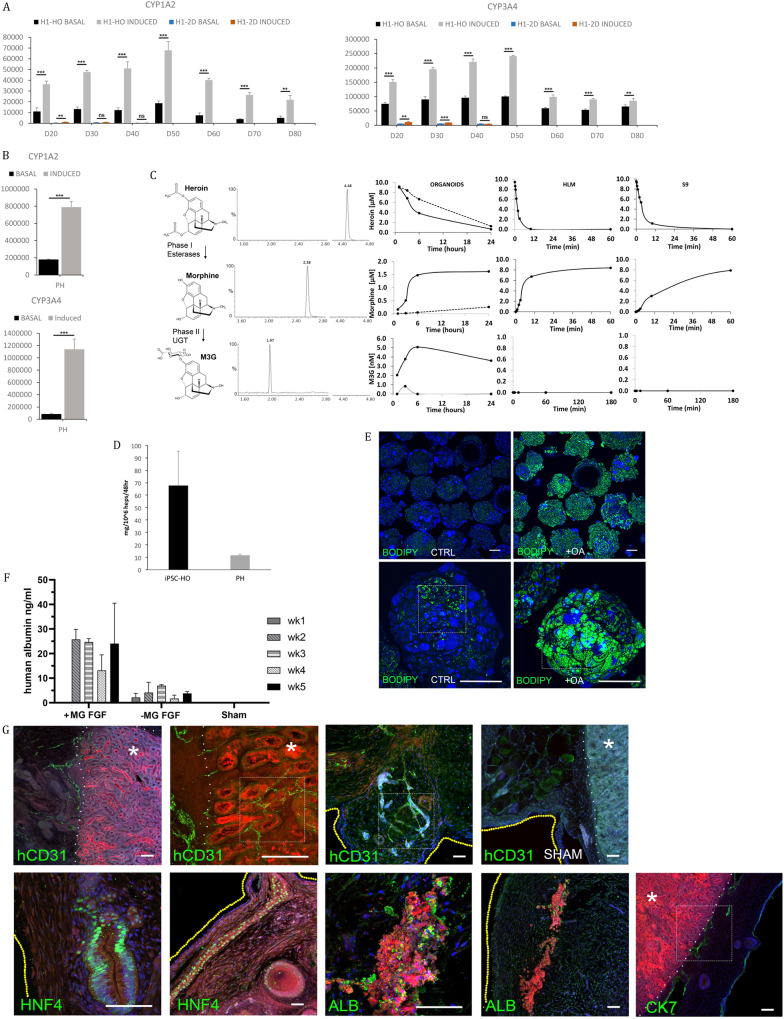
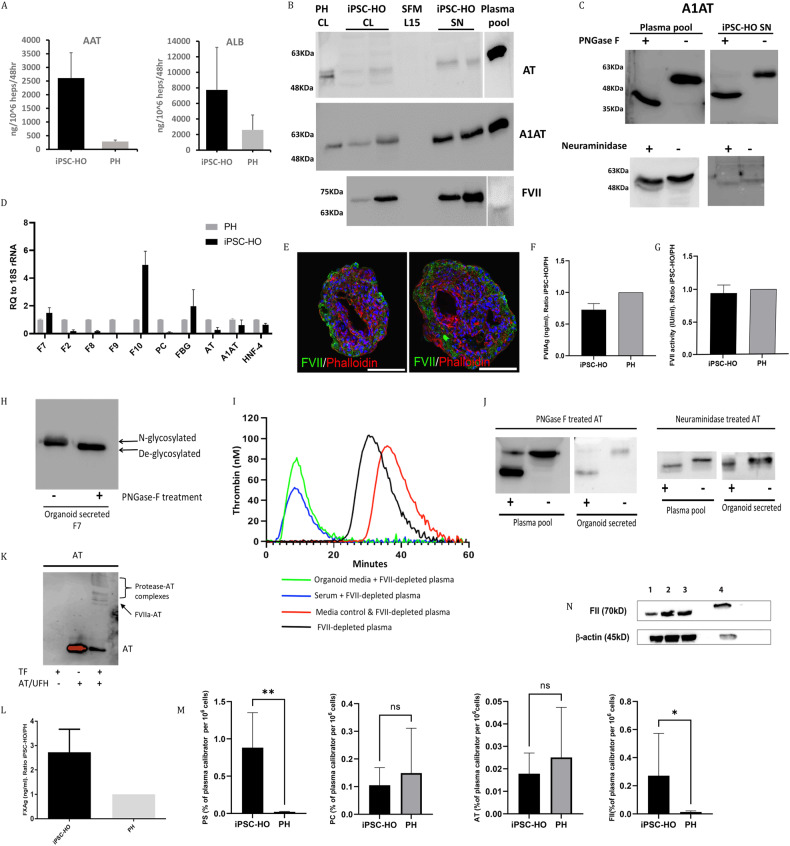
The lack of physiological parity between 2D cell culture and in vivo culture has led to the development of more organotypic models, such as organoids. Organoid models have been developed for a number of tissues, including the liver. Current organoid protocols are characterized by a reliance on extracellular matrices (ECMs), patterning in 2D culture, costly growth factors and a lack of cellular diversity, structure, and organization. Current hepatic organoid models are generally simplistic and composed of hepatocytes or cholangiocytes, rendering them less physiologically relevant compared to native tissue. We have developed an approach that does not require 2D patterning, is ECM independent, and employs small molecules to mimic embryonic liver development that produces large quantities of liver-like organoids. Using single-cell RNA sequencing and immunofluorescence, we demonstrate a liver-like cellular repertoire, a higher order cellular complexity, presenting with vascular luminal structures, and a population of resident macrophages: Kupffer cells. The organoids exhibit key liver functions, including drug metabolism, serum protein production, urea synthesis and coagulation factor production, with preserved post-translational modifications such as N-glycosylation and functionality. The organoids can be transplanted and maintained long term in mice producing human albumin. The organoids exhibit a complex cellular repertoire reflective of the organ and have de novo vascularization and liver-like function. These characteristics are a prerequisite for many applications from cellular therapy, tissue engineering, drug toxicity assessment, and disease modeling to basic developmental biology.


Conflict of interest statement

FB is partially funded by the Horizon 2020 research and innovation program under the Marie Skłodowska-Curie grant agreement No 812616.

Figures

Fig. 1
Fig. 1. Differentiation of multicellular liver organoids from human PSCs mimics stages of in vivo development.
A Schematic overview of organoid differentiation from PSCs. B Representative images of Day 0 (D0) pluripotent spheroids, left panel brightfield. The remaining panels show whole-mount immunostaining of the pluripotency markers OCT4, SOX2 and NANOG; the scale bar is 200 µm. The highlighted area is magnified in Supplementary Fig. 9. C Whole-mount immunostaining of the definitive endoderm (DE) marker FOXA2 at D2 of differentiation. D RT‒qPCR analysis of pluripotency- and DE-associated genes at D1 and D2 of differentiation relative to D0 spheroids on a log10 scale. The results from three independent experiments are presented as the mean ± SD. E Graph showing the shift in size of organoids from D0 to D2. The size is expressed as the mean diameter (µm) with error bars showing the standard deviation, representing a total of 570 organoids. Day 0 vs. Day 1 p = 0.001, Day 0 vs. Day 2 p < 0.0001, Day 1 vs. Day 2 p < 0.0001 from Kruskal‒Wallis test with Dunn`s multiple comparisons test. F RT‒qPCR analysis of DE and early liver development genes at D7 of differentiation relative to D2 on a log10 scale. The results from three independent experiments are presented as the mean ± SD. G Whole-mount immunostaining of D7 organoids showing epithelial (ECAD) and early hepatocyte markers (FOXA2, CK8, HNF4α, AFP) on the outer surface of the organoids. The highlighted area is magnified in Supplementary Fig. 9. H Whole-mount immunostaining of D7 organoids showing heterogeneous expression of mesoderm (MESP1)- and mesenchymal (ALCAM, WT1)-associated markers. The highlighted area is magnified in Supplementary Fig. 9. I Brightfield image of D20 organoids. Scale bar is 500 µm. J Violin plot of D20-D27 organoid diameter from three representative experiments. The solid line represents the mean, while the dotted lines represent the quartiles. K RT‒qPCR analysis of both early and later (developmentally) hepatocyte genes at D20 of differentiation relative to D2 on a log10 scale. The results from three independent experiments are presented as the mean ± SD. L Whole-mount immunostaining of D20 organoids showing expression of the hepatocyte markers HNF4α and albumin on the outer surface of the organoids. M Demonstration of increasing secretion of HGF into the culture medium by the organoids throughout differentiation as measured by ELISAs. The results from three independent experiments are presented as the mean ± SD. All of the above experiments were performed with the hiPSC line AG27. All scale bars are 100 µm unless stated otherwise.
Fig. 2
Fig. 2. Single-cell RNA sequence analysis of liver organoids.
A UMAP plot of single cells distinguished by cell type. B GSEA of gene signatures of periportal hepatocytes in hepatocyte clusters. The enrichment was compared across three hepatocyte clusters. * p < 0.05 by two-sided Student’s t test. C Differential expression of SOX9 and APOE across hepatocyte clusters, * p < 0.05 with two-sided Student’s t test. D Pseudotemporal ordering of hepatocyte clusters. SOX9 and APOE expression levels are positively and negatively correlated with pseudotime. E Heatmap showing the expression of genes related to oxidative stress, collagen, vascularization, early hepatocyte development, keratin and Kupffer cell development. F Endothelial cell ordering from LSECs to MVECs. The heatmap represents the expression pattern of genes, which are dependent on the EC ordering and categorized into six groups. Significant GO terms in each gene group are also shown. G UMAP plot of single cells derived from our and the Ouchi et al. liver organoids and human liver. H Pie charts representing cell composition in our and the Ouchi et al. liver organoids. I Ratio of cells expressing Kupffer cell markers. J GSEA of pathway-related genes between our and Ouchi et al. liver organoids. All of the above experiments were performed with the hiPSC line AG27.
Fig. 3
Fig. 3. Proteomic analysis of liver organoids.
A Venn diagram representing proteins shared between in vivo liver and in vitro organoids. The correlation is also shown with the scatterplot, and the overrepresented GO terms of the shared proteins are shown by a bar graph. B Ranked plot of log2(intensity) of proteomics data in organoid (blue) and liver (red). Proteins are categorized by four intensity ranges (25~, 20–25, 15–20 and 10–15). Representative liver markers in each intensity range are shown in the right panel. C Bar plot showing overrepresented Gene Ontology terms in each intensity range. D Unbiased clustering of proteomic data. Clustering was performed to log2(intensity) value of all expressed genes (log2(intensity)>10). E Differentially expressed proteins and their overrepresented GO terms. All of the above experiments were performed with the hiPSC line AG27.
Fig. 4
Fig. 4. Liver organoids contain the parenchymal cell types of the liver.
A Immunostaining showing the expression of various maturity- and polarity-associated hepatocyte markers in the outer most layer of the organoids (whole mount except for ASGR1/HNF4α which are from 50 μm thick cryosections). Scale bars are 100 μm, and the highlighted area is magnified in Supplementary Fig. 9. B Electron micrograph revealing ultrastructural features associated with hepatocytes, including epithelial cells lining a luminal structure arranged in one layer connected with tight junctions (circles) indicative of polarization. The surface facing the lumen contains numerous microvilli, whereas the abluminal surface facing the extracellular matrix remains smooth and attached to the underlying basal lamina (arrowheads). Scale bar 2 µm. C Immunohistochemical staining showing CK19-positive cells; the arrow denotes cholangiocytes surrounding the lumen. Scale bar is 200 µm. D Immunostaining of an organoid cryosection showing a later developmental cholangiocyte marker (CK7)-positive population of cells separate from the hepatocyte population. These form smaller ring-like structures as well as lining large luminal or cyst-like spaces within the organoids; scale bars are 100 µm. E Paraffin-embedded sections of organoids stained with alcian blue and counterstained with nuclear red. The lumen of this organoid shows cells containing pale blue cytoplasm, indicating the presence of mucopolysaccharides. Scale bar 50 µm. All of the above experiments were performed with the hiPSC line AG27.
Fig. 5
Fig. 5. Liver organoids are de novo vascularized.
A Max projection and cross section of whole mount immunostained organoids showing overlapping populations expressing one or both of the endothelial markers CD54 and CD31. Cross-section reveals stronger CD54 expression toward the outer surface contrasted with stronger CD31 expression toward the center of the organoid. Additionally, visible are multiple conjoined luminal spaces bounded by the positive cells. Scale bar, 100 μm; the highlighted area is magnified in Supplementary Fig. 9. B Immunofluorescence of CD31-expressing endothelial cells (green) under high magnification. Plane image and 3D volume rendering are shown. Hoechst 33342 (blue) dye was used to counterstain nuclei. Right panels show 3D volume rendering and a plane image of the selected region. Insert, visualization of vessel cross-section. C Immunostaining of a 50 μm cryosection showing adjacent and overlapping expression of CD34 and CD31 in a small structure indicative of neo-vascularization. Scale bar 50 μm, the highlighted area is magnified in Supplementary Fig. 9. D Whole mount staining of LYVE1, a sinusoidal endothelial marker, showing positive cells demarking a diversity of lumen shapes and sizes. Scale bar, 100 μm. E Immunostaining of two 50 μm thick cryosections showing co-localization of liver endothelial-associated FVIII and endothelial cell marker CD31 and luminal spaces in the organoids. Scale bar, 100 μm; the highlighted area is magnified in Supplementary Fig. 9. F Immunofluorescence analysis of AcLDL-488 and FSA-FITC binding and uptake in CD54+ endothelial cells within the organoids. Scale bar 10 μm, highlighted area is magnified in Supplementary Fig. 9. All of the above experiments were performed with the hiPSC line AG27 on organoids from Day 20 to Day 27.
Fig. 6
Fig. 6. Liver organoids contain neuronal, resident macrophage and hepatic stellate populations.
A Immunostaining for neuronal population in an organoid (TUBB3). The highlighted area is magnified in Supplementary Fig. 9. B RT‒qPCR analysis of neural crest stem cell markers at D2 and D7 of differentiation relative to D0 spheroids. The results from three independent experiments are presented as the mean ± SD. C Immunostaining of 50 μm thick cryosection showing CD68 in a granular pattern in the cytoplasm of the Kupffer-like cells. The highlighted area is magnified in Supplementary Fig. 9. D RT‒qPCR analysis of hemangioblast (RUNX1)- and hematopoietic (GATA2)-associated genes involved in the development of macrophages at D2 and D7 of differentiation relative to D0 spheroids. The results from three independent experiments are presented as the mean ± SD. E Immunostaining of cryosections showing expression of endodermal and stellate cell-associated proteins HNF4α and αSMA (left and middle panel) and (right panel) whole mount showing expression of mesenchymal and stellate cell-associated proteins (αSMA, Laminin) beneath the hepatocyte layer of organoids. All of the above experiments were performed with the hiPSC line AG27. All scale bars are 100 µm.
Fig. 7
Fig. 7. Assessment of liver organoid function, maintenance and transplantability.
A Assay demonstrating inducibility and increasing activity of CYP1A2 (left side) and CYP3A4 (right side) drug metabolizing enzymes from D20 to D80 in the hESC line H1 organoids. For induction of CYP1A2, the cells were pretreated with omeprazole, and for CYP3A4, they were pretreated with rifampicin. Graphs show comparisons of suspension cultures and 2D differentiation. The results from three independent experiments are presented as the mean ± SD, ** p < 0.01, *** p < 0.001 with two-sided Student’s t test. B Assay demonstrating the activity and inducibility of CYP1A2 (top row) and CYP3A4 (bottom row) proteins in cryopreserved primary human hepatocytes. The results from three independent experiments are presented as the mean ± SD, ** p < 0.01, *** p < 0.001 with two-sided Student’s t test. C D20 AG27-derived organoids show phase I and phase II metabolism of heroin dosed at 10 μM. The left panel represents the metabolic pathway of heroin. Heroin is metabolized by sequential deacetylation (phase I reaction) to 6-monoacetylmorphine and morphine by esterase enzymes. Morphine is further glucuronidated (phase II reaction) by UDP-glucuronosyltransferases (UGTs) to morphine-3-glucuronide (M3G) and morphine-6-glucuronide (M6G). Center panel: Ion chromatograms of an extracted organoid sample analyzed by LC‒MSMS/MS. Right panel: Metabolism of heroin (10 µM) in organoids, primary human liver microsomes (HLMs) and the human S9 fraction (S9). D Demonstrating the production and secretion of urea into the culture medium from AG27-derived organoids (iPSC-HO) and primary human hepatocytes after 48 hours and normalized to mass per million hepatocytes (n = 3, mean ± SD, no urea was detectable in cell-free medium). E Whole-mount live imaging of oleic acid-treated (right column) and untreated (left column) AG27-derived organoids showing accumulation of nonpolar fats after treatment (BODIPY in green). Oleic acid was used at 300 μM for 5 days. The highlighted area is magnified in Supplementary Fig. 9. F Transplanted AG27-derived organoids can be maintained in mice. Human albumin was consistently detected over a 5-week period in mouse blood samples. D8 organoids were transplanted with either Matrigel/FGF2 supplementation ( + MG FGF) or Matrigel/FGF2 free (-MG FGF) (mean ± SD; +MG FGF n = 3, -MG FGF n = 2, sham n = 4). G Immunostaining of mouse kidney/organoid transplant cryosections demonstrates the retention of human hepatic populations (CK7, hCD31, HNF4α and ALB) and structures seen in vitro. They also demonstrated clear endothelial engraftment via hCD31 staining, whereas no hCD31-positive structures were visible in the sham group. Texas red dextran is strongly localized in the kidney parenchyma and albumin (ALB)-positive clusters of the transplanted organoids, while it is detectable at lower levels in other areas of the transplanted material. The boundary between the kidney parenchyma (marked with *) and organoid is delineated by a white dotted line, while a yellow dotted line marks the external surface. Nuclei are in blue, and all scale bars are 100 µm. Images that contain a white box have this area magnified and can be viewed in the Supplementary Fig. 9.
Fig. 8
Fig. 8. Assessment of liver organoid coagulation machinery.
A Demonstration of the production and secretion of A1AT and albumin into the culture medium by D21-24 AG27-derived organoids and primary human hepatocytes over 48 hours as measured by ELISAs (n = 3, mean ± SD). B Antithrombin (AT), alpha-1-antitrypsin (A1AT) and factor VII (FVII) are present in cell lysates (Lanes 2 and 3) and supernatants (Lanes 5 and 6) derived from liver organoids assessed by SDS‒PAGE under reducing conditions. Plasma pool (Lane 7) and primary hepatocytes (Lane 1) were used as a reference; serum-free medium (SFM) L15 medium was used as a negative control (Lane 4). C Assessment of the N-glycosylation content of A1AT from the supernatant of organoids by PNGase F compared to the plasma pool. D Levels of coagulation factors and inhibitors in iPSC-derived organoids (black bars) and primary human hepatocytes (gray bars). mRNA levels of coagulation factors II, VII, VIII, IX, and X, fibrinogen (F2, F7, F8, F9, F10, FBG), the coagulation inhibitors protein C and antithrombin (PC, AT) and the hepatic markers alpha-1 antitrypsin and hepatocyte nuclear factor 4 alpha (A1AT, HNF4α) were determined using quantitative RT‒qPCR with 18 S as an endogenous control. The results are presented as the mean of the fold change expression of the respective gene. The results from three independent experiments are presented as the mean ± SD. E Immunostaining of two 50 μm cryosections showing localization of FVII (green) to the outer hepatocyte layer of the AG27-derived organoids, co-stained with phalloidin (red). Nuclei in blue, scale bars are 100 µm. F Demonstrating the production and secretion of FVII protein in the culture medium of AG27-derived liver organoids (iPSC-HO) and primary human hepatocytes (PH) as determined using ELISAs. The total concentration of FVII was adjusted to 1×10⁶ cells, and the results are expressed as the iPSC-HO/PH ratio. The results from three independent experiments are presented as the mean ± SEM. G Demonstrating FVII activity (IU/ml), culture medium from AG27-derived iPSC-HO and PH was determined using an FVII chromogenic assay. The results were adjusted to 1×10⁶ cells and are expressed as the iPSC-HO/PH ratio. The results from three independent experiments are presented as the mean ± SEM. H Assessment of the N-glycosylation content of secreted FVII of organoids by PNGase F treatment. I Assessment of thrombin generation in FVII-depleted plasma (black) with either serum-free medium (SFM) (red), organoid supernatant (green) or fetal bovine serum (FBS)-supplemented serum-free medium (SFM) L15 (blue). J Assessment of the N-glycosylation content of secreted AT from the supernatant of organoids by PNGase F and neuraminidase treatment compared to the human plasma pool. K Western blot analysis of AT after activation of organoid-derived supernatants by tissue factor (TF) and CaCl2 and incubation with AT and unfractionated heparin. Activated FVII-AT (FVIIa-AT) complexes are indicated by an arrow and bracket. l Left panel: FX protein (Ag) levels (ng/ml) in culture medium from iPSC-HO and PH as measured by ELISAs. The total concentration of FX was adjusted to 1×10⁶ cells, and the results are expressed as the iPSC-HO/PH ratio. The results from three independent experiments are presented as the mean ± SEM. M Demonstrating the production and secretion of PS, PC, AT and FII proteins in the culture medium of AG27-derived liver organoids (iPSC-HO) and primary human hepatocytes (PH) as determined using the Procarta-plex assay. The total concentration of AT was adjusted to 1×10⁶ cells, and the results are expressed as the percentage of the plasma calibrator control. The results from three independent experiments are presented as the mean ± SD. Statistical significance was assessed with the Mann‒Whitney test (*p < 0.05, **p < 0.01). N Intracellular levels of prothrombin (FII) shown by western blots, lysates from iPSC-HO (Lanes 1-3) and PH (Lane 4). Equal amounts of proteins were separated by SDS‒PAGE under reducing conditions. β-Actin was used as a loading control. The results of three independent experiments are presented.

References

    1. Trefts E, Gannon M, Wasserman DH. The liver. Curr. Biol. 2017;27:R1147–R1151. doi: 10.1016/j.cub.2017.09.019. - DOI - PMC - PubMed
    1. Yin X, et al. Engineering Stem Cell Organoids. Cell Stem Cell. 2016;18:25–38. doi: 10.1016/j.stem.2015.12.005. - DOI - PMC - PubMed
    1. Ouchi R, et al. Modeling Steatohepatitis in Humans with Pluripotent Stem Cell-Derived Organoids. Cell Metab. 2019;30:374–384.e376. doi: 10.1016/j.cmet.2019.05.007. - DOI - PMC - PubMed
    1. Ström S, Holm F, Bergström R, Strömberg AM, Hovatta O. Derivation of 30 human embryonic stem cell lines-improving the quality. Vitr. Cell. Dev. Biol. Anim. 2010;46:337–344. doi: 10.1007/s11626-010-9308-0. - DOI - PMC - PubMed
    1. Mathapati S, et al. Small-Molecule-Directed Hepatocyte-Like Cell Differentiation of Human Pluripotent Stem Cells. Curr. Protoc. Stem Cell Biol. 2016;38:1G.6.1–1G.6.18. doi: 10.1002/cpsc.13. - DOI - PubMed

Publication types