. 2023 Sep;5(9):1563-1577.
doi: 10.1038/s42255-023-00879-8. Epub 2023 Aug 31.

Adipocytes reprogram cancer cell metabolism by diverting glucose towards glycerol-3-phosphate thereby promoting metastasis

Affiliations

Adipocytes reprogram cancer cell metabolism by diverting glucose towards glycerol-3-phosphate thereby promoting metastasis

Abir Mukherjee et al. Nat Metab. 2023 Sep.

Abstract

In the tumor microenvironment, adipocytes function as an alternate fuel source for cancer cells. However, whether adipocytes influence macromolecular biosynthesis in cancer cells is unknown. Here we systematically characterized the bidirectional interaction between primary human adipocytes and ovarian cancer (OvCa) cells using multi-platform metabolomics, imaging mass spectrometry, isotope tracing and gene expression analysis. We report that, in OvCa cells co-cultured with adipocytes and in metastatic tumors, a part of the glucose from glycolysis is utilized for the biosynthesis of glycerol-3-phosphate (G3P). Normoxic HIF1α protein regulates the altered flow of glucose-derived carbons in cancer cells, resulting in increased glycerophospholipids and triacylglycerol synthesis. The knockdown of HIF1α or G3P acyltransferase 3 (a regulatory enzyme of glycerophospholipid synthesis) reduced metastasis in xenograft models of OvCa. In summary, we show that, in an adipose-rich tumor microenvironment, cancer cells generate G3P as a precursor for critical membrane and signaling components, thereby promoting metastasis. Targeting biosynthetic processes specific to adipose-rich tumor microenvironments might be an effective strategy against metastasis.


Conflict of interest statement

Competing interests

There are no potential conflicts of interest. E.L. received funding from Abbvie and Arsenal Bioscience for preclinical research studies unrelated to the submitted paper.

Figures
Extended Data Fig. 1 |
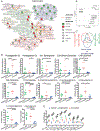
Extended Data Fig. 1 |. Untargeted metabolomic analysis of adipocytes after co-culture with ovarian cancer cells.
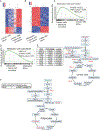
(a) Network map showing altered levels (red = increased; green = decreased) of biochemically and structurally similar metabolites in adipocytes after co-culture with SKOV3ip1 OvCa cells for 18 h. Biochemically and structurally similar metabolites are clustered. Metabolites in the same biochemical pathway are connected by orange lines. Structurally similar metabolites are connected by blue lines. (b) Principle component analysis (PCA) showing lipidomic changes in SKOV3ip1 cells induced by conditioned media derived from patient matched adipocytes (Adi CM), fibroblasts (NOF CM) and preadipocytes (Pre-adi CM). (c) Venn diagram showing number of metabolites altered in adipocytes, cancer cells, and co-culture derived media (p < 0.05, two-way ANOVA, mixed model post hoc Tukey HSD). (d) Changes in metabolites in adipocytes, cancer cells, and co-culture derived media. C24-ceramide, C16-ceramide and 18:1 sphingosine were primarily secreted by adipocytes; endocannabinoids such as 2-Arachidonylglycerol and 2-Linoleoylglycerol were increased in co-culture conditions (p < 0.05, one-way ANOVA). (e) Changes in phosphatidylcholine levels in the secretome of cancer cells (blue), adipocytes (green), and cancer cells co-cultured with adipocytes (red). Data extracted from metabolomics described in Fig. 1c. Statistical significance was calculated using two-way ANOVA, * p < 0.05, ** p < 0.01, *** p < 0.001.
Extended Data Fig. 2 |
Extended Data Fig. 2 |. Joint gene-metabolite analysis of adipocytes co-cultured with cancer cells.
Gene expression analysis. Heat map showing clustering of (a) cancer cells +/− adipocyte co-culture, (b) adipocytes +/− co-culture with SKOV3ip1 cells for 12 h. Gene Set Enrichment Analysis (cell cycle) based on the gene expression (microarray) of (c) cancer cells +/− adipocyte co-culture and (d) adipocytes +/− SKOV3ip1 co-culture. (One-way ANOVA, FDR, q value < 0.05). Integration of gene expression and metabolites using IMPala, depicting changes in the (e) cancer cells +/− adipocyte co-culture and (f) adipocytes +/− co-culture with SKOV3ip1 cells. Genes and metabolites increased with co-culture are in red, those reduced are in green. Fold changes of significantly altered genes from microarray analysis are shown in a table on left (One-way ANOVA, FDR, q value < 0.05). (E, F Created with BioRender.com (2023)).
Extended Data Fig. 3 |
Extended Data Fig. 3 |. Seahorse and metabolomics of ovarian cancer cells co-cultured with adipocytes.
(a) Glycolytic (ECAR) profiles of SKOV3ip1 cells treated with adipocyte conditioned media (Adi CM) for 18 h measured using a Seahorse XFe96 analyzer (n = 3 independent experiments, mean +/− SEM are plotted as bar graphs, two-way ANOVA, ** p < 0.05). (b) ECAR profile of OVCAR5 cells treated with Adi CM for 18 h (n = 3 independent experiments). (cd), Ex-vivo culture of omental tumor explants. Stable isotope tracing using [13C]-glucose (data from Fig. 2c) for 24 h. Isotopologue prolife of (C) TCA cycle intermediates and (D) Lysophosphocholine (LPC) 18:1 for three patient tumors is plotted (n = 3 independent biological samples). Mean +/− SEM are plotted as bar graphs. (e) Stable isotope tracing. SKOV3ip1 cells were treated with either control or Adi CM for 6 h and glucose utilization traced using uniformly labeled [13C]-glucose. Bar graph depict contribution of 13C vs 12C carbon to the total pool of glycerol-3-phosphate under specific treatment conditions (n = 3 independent experiments). Mean +/− SEM are plotted as bar graphs. (p = 0.11, two-way ANOVA; and p = 0.001 unpaired T-test).
Extended Data Fig. 4 |
Extended Data Fig. 4 |. Knockdown of GPAT3 reduces metastatic tumor burden in mice.
Scrambled (Control shRNA) or GPAT3 targeting shRNA (GPAT3 shRNA) transduced, luciferase expressing, HeyA8 cancer cells were injected intraperitoneally into athymic nude mice and tumor burden visualized after 2 weeks using the IVIS spectrum in vivo imaging system. Images show end-point difference in tumor burden.
Extended Data Fig. 5 |
Extended Data Fig. 5 |. Adipocyte-induced HIF1α regulates glycolysis.
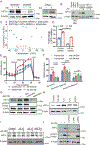
(a) Immunoblot of HIF1α in ovarian cancer cell lines co-cultured with Adi for 16 h (n = 3 independent experiments). (b) Immunoblot for HIF1α, showing stable knockdown of HIF1α in SKOV3ip1 cells (n = 3 independent experiments). (c) Principal component analysis using adipocyte co-cultured samples (16 h) stably expressing either control shRNA or HIF1α shRNA cells. (d) qPCR analysis to determine glycerol-3-phosphate dehydrogenase (GPD1) mRNA expression in stable HIF1α knockdown SKOV3ip1 cells after 12 h adipocyte co-culture. Mean +/− SEM are plotted as bar graphs. (n = 3 independent experiments, two-tailed t-test, ** p < 0.005). (e-f) SKOV3ip1 HIF1α knockdown cells were treated with Adi CM for 18 h, followed by Seahorse analysis to determine changes in ECAR (n = 3 independent experiments). (Mean +/− SEM, two-way ANOVA, *** p = 0.0005, **** p < 0.0001). g) Adi CM was fractioned into metabolite and non-metabolite fractions based on size (3 kd). SKOV3ip1 cells were treated with both fractions for 6 h and immunoblot carried out (n = 3 independent experiments). (h) Immunoblot for HIF1α after treatment of SKOV3i1p cells with 10 ng/ml of recombinant human cytokines (IL-6, IL-8, and MCP1) for 6 hr (n = 3 independent experiments. (i) Immunoblot of HIF1α expression in SKOV3ip1 cells treated with Adi CM (6 h) +/− neutralizing antibodies against human IL-6, IL-8, or MCP-1(n = 3 independent experiments. (j) SKOV3ip1 cells were pretreated with the STAT-3 inhibitor STATTIC (10 μM), the JAK2 inhibitor AZD-1480 (10 μM), or a MEK inhibitor, Trametinib (1 μM) for 30 min, followed by incubation with Adi CM for 6 h. Immunoblot of HIF1α expression (n = 3 independent experiments).
Extended Data Fig. 6 |
Extended Data Fig. 6 |. Adipocyte-induced HIF1α alters the lipidome of ovarian cancer cells.
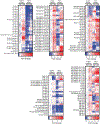
Lipidomics. HIF1α shRNA or control shRNA transduced SKOV3ip1 cells were co-cultured with primary omental adipocytes for 18 h, and mass spectrometry performed. The heat map depicts fold changes of significantly altered lipids (two-tailed t-test, p value of
Extended Data Fig. 7 |
Extended Data Fig. 7 |. Effect of HIF1α knockdown on ovarian cancer cells.
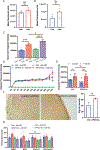
(a, b) Explant assay. SKOV3ip1 cells transduced with either control shRNA or HIF1α shRNA were cultured with non-cancerous human omentum for (A) 18 h and (B) 72 h to measure cellular adherence capacity and proliferation, respectively (n = 3 biologically independent samples). Mean +/− SEM are plotted as bar graphs. (c) C11 Bodipy stained cells (control and HIF1α) were treated with adipocyte-derived conditioned media and mean fluorescent intensity measured after 24 h using Incucyte (data extracted from Fig. 5f). (n = 3 independent experiments, Mean +/− SEM are plotted as bar graphs, one-way ANOVA * p < 0.05, *** p = 0.0002, p < 0.0001.) (D-E) Lipid ROS measurements. HeyA8 cells transduced with either scrambled shRNA (Control shRNA) or GPAT3 shRNA was labelled with C11-Bodipy dye was treated adipocyte-derived conditioned media (Adi CM). (d) Images were taken every 2 h using Incucyte and total green fluorescence intensity plotted. (n = 3 independent experiments, Mean +/− SEM are plotted). (e) Bar graph depicts green fluorescence intensity measured at the 24 h time point. (n = 3 independent experiments, two-way ANOVA, ** p = 0.003, mean +/− SEM are plotted). (f) Immunohistochemistry for 4-HNE adducts in serial sections of xenograft omental tumors (from Fig. 3d). Staining intensities of the images (left) were quantified using ImageJ (right). (n = 3 independent experiments, two-tailed t-test, mean +/− SEM are plotted as bar graphs). (g) MTT assay to determine the viability of HeyA8 cells after treatment with the indicated compounds. (n = 3 independent experiments, two-way ANOVA, p < 0.05, mean +/− SEM are plotted as bar graphs).
Fig. 1 |
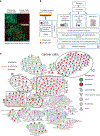
Fig. 1 |. Adipocytes increase glucose metabolism and GPLs in OvCa cells.
a, Co-culture of fluorescently (CMTPX) labeled OvCa cells (red) with calcein AM-labeled primary human omental adipocytes (green). The adipocytes float on the surface because of their lipid content (n = 3 independent experiments). CSH-QTOF, charged surface hybrid column-quadrupole time of flight mass spectrometer. b, Schematic for multi-omics analyses of co-cultured adipocytes and OvCa cells. c, Network map showing altered levels of metabolites (red, increase; green, decrease) in SKOV3ip1 cells with adipocyte co-culture. Biochemically and structurally similar metabolites are clustered. Orange lines connect metabolites in the same biochemical pathway, and blue lines connect structurally similar metabolites. Overall, GPLs (SM, sphingomyelin) are increased. Scale bar, 100 μm.
Fig. 2 |
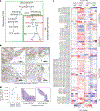
Fig. 2 |. Adipocytes increase glycolysis but not oxidative phosphorylation in OvCa cells.
a, SKOV3ip1 cells were treated with Adi CM for 18 h, followed by measurement of ECAR, using Seahorse XFe96 analyzer (n = 3 independent experiments). Data represent mean ± s.e.m. b, [13C]-glucose stable isotope tracing. Fresh omental tumor sections were incubated with [13C]-glucose for 24 h, followed by MS to detect [13C]-carbon enrichment of the glycolytic pathway and TCA cycle. Bar graphs depict mean ± s.e.m. (n = 3 independent biological samples) (adapted from BioRender.com (2023)).
Fig. 3 |
Fig. 3 |. GPAT3 regulates GPL synthesis.
a, Schematic. GPAT3 catalyzes the initial step in de novo GPL and TG synthesis. b, GPAT3 expression in serial sections of patients with high-grade serous OvCa metastatic omental tumor. GPAT3 expression is more abundant in the epithelial tumor compartment. A, adipocytes; C, cancer; S, stroma. Dotted lines depict invasive front. n = 4 independent biological samples. c, Lipidomics on control and GPAT3 shRNA OvCa cells co-cultured with omental adipocytes for 18 h. The heat map shows fold change of significantly altered lipid species (two-tailed t-test, P < 0.05). Lipid species: DG, diacylglycerol; SM, sphingomyelin; BMP, bis(monoacylglycerol) phosphate. d, Left: HeyA8-luciferase OvCa cells with stable control or GPAT3 knockdown were injected intraperitoneally into nude mice (n = 5) and subsequently imaged using IVIS spectrum in vivo imaging system. Luciferase signal was quantitated to determine tumor burden (two-tailed t-test, **P = 0.0081, mean ± s.e.m.). Right: H&E-stained sections of entire omental tumors.
Fig. 4 |
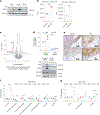
Fig. 4 |. Adipocyte-mediated HIF1α expression regulates glucose utilization in cancer cells.
a, Immunoblot of HIF1α in SKOV3ip1 cells co-cultured with primary human adipocytes (Adi) for the indicated times. b, SKOV3ip1 and OVCAR5 stably expressing the ODD of HIF1α were treated with Adi CM for 6 h, and luciferase activity was determined using a luminometer (***P < 0.001, two-tailed t-test, n = 3 independent experiments). Bar graphs depicts mean ± s.e.m. RLU, relative luminescence units. c, MS of proteins extracted from OvCa cells stably transfected with shHIF1α and cultured ± adipocytes. Volcano plot showing proteins regulated by adipocyte-induced HIF1α expression analyzed using a two-sided t-test with an FDR of 0.05 and an S0 value of 0.1. d, qPCR (top) and immunoblot (bottom) of HIF1α and HK2 in SKOV3ip1 HIF1α knockdown cells after adipocyte co-culture for 16 h (n = 3 independent experiments). Bar graphs depicts mean ± s.e.m., two-way ANOVA **P = 0.0019, ***P < 0.0001). e, Immunohistochemistry for HIF1α and HK2 using serial sections of human omental tumors from patients with high-grade serous OvCa. A, adipocytes; C, cancer; S, stroma. Dotted lines depict invasive front. n = 4 independent biological samples, 2 shown. f,g, Metabolomics. Control and HIF1α knockdown SKOV3ip1 cells co-cultured with adipocytes for 18 h (two-tailed t-test, *P < 0.05, **P = 0.0012, ***P < 0.0005). Bar graphs show fold changes (compared with control shRNA Adi) in metabolites of the glycolytic pathway (f) and the TCA cycle (g). Csh, control shRNA; Hsh, HIF1α shRNA. n = 3 independent experiments. Bar graphs depicts mean ± s.e.m. (two-tailed t-test, *P = 0.02, ***P = 0.0002).
Fig. 5 |
Fig. 5 |. Reduction of HIF1a expression inhibits omental metastasis.
Xenograft intraperitoneal metastasis model. a, Left: SKOV3ip1 HIF1α shRNA cells were injected intraperitoneally (n = 10 mice per group), and tumor burden is shown with shcontrol on the left and shHIF1α on the right with omental tumor outlined in yellow. Right: tumor burden was measured as omental metastatic weight. Bar graphs depicts mean ± s.e.m. (two-tailed t-test, ***P < 0.0008). b, Cleaved caspase 3, Ki-67 and 4-HNE staining in serial sections of omental tumors generated from a (n = 5 tumors per group were stained). Csh, control shRNA; Hsh, HIF1α shRNA (two-tailed t-test, **P < 0.01, mean ± s.e.m.). c, Lipid peroxidation: control and HIF1α knockdown cells were co-cultured with adipocytes for 18 h, and intracellular MDA levels were determined (n = 3 independent experiments). Bar graphs depicts mean ± s.e.m. (two-way ANOVA, ****P < 0.0001; NS, not significant). d,e, Control and HIF1α shRNA transduced SKOV3ip1 cells were treated with Adi CM: cells were stained using Bodipy 581/591 C11 dye and fluorescent emissions (at 520 nm) were measured every couple of hours using Incucyte to quantify lipid ROS production (n = 3 independent experiments; data depict mean ± s.e.m.) (d); MTT assay carried out to determine the viability of cancer cells after treatment with the indicated small molecule compounds (n = 3 independent experiments; two-way ANOVA, ****P < 0.0001, mean ± s.e.m.) (e). f, Stable isotope tracing in tumor-bearing mice with HIF1α knockdown cancer cells. (adapted from BioRender.com (2023)). g, [13C]-glucose derived labeling of G3P and glycolytic intermediates in omental tumors as in Fig. 2c (n = 5 mice). Bar graphs depict mean ± s.e.m., two-way ANOVA, **P = 0.0045, ***P < 0.0008, ****P < 0.0001.
Fig. 6 |
Fig. 6 |. Cancer cells adjacent to adipocytes have increased PC.
Spatial analysis of GPLs using IMS. a, Schematic for IMS analysis of ovarian high-grade serous tumor samples (adapted from BioRender.com (2023)). be, Histology and MALDI IMS analysis of frozen omental tumor sections (n = 3 independent biological samples): H&E-stained tissue with annotated tumor regions (black boxes) that were analyzed using MALDI (b, left) and spectral distribution of ions (496.34 m/z and 739.47 m/z) corresponding to the selected area (black boxes) on the H&E slide (b, right); Enlarged section of the tumor area (used for IMS analysis), showing two groups of cancer cells, adjacent (red) or distant (blue) from adipocytes (c); optical images using MALDI IMS of PC (16:0) (higher adjacent to adipocytes as measured by the AUC-orange) (d) and phosphatidylinositol (PI) p-28:0 (lower adjacent to adipocytes as measured by the AUC-orange) (e) corresponding to the H&E section shown in c, with MALDI images of ions shown on the left and the pixel intensities of the ions in the selected area on the right. f, Illustration of the adipocyte–OvCa cell interactions leading to altered glucose utilization in OvCa cells. Adipocytes stabilize HIF1α protein in OvCa cells. Subsequently, HIF1α transactivates HK2 and glycerol-3-phosphate dehydrogenase (GPD1). The combined activity of these two enzymes increases G3P levels in OvCa cells, forming the backbone for the synthesis of TGs and GPLs (created with BioRender. com (2023)).

References

    1. Lengyel E, Makowski L, DiGiovanni J & Kolonin MG Cancer as a matter of fat: the crosstalk between adipose tissue and tumors. Trends Cancer 4, 374–384 (2018). - PMC - PubMed
    1. Mukherjee A, Bilecz AJ & Lengyel E The adipocyte microenvironment and cancer. Cancer Metastasis Rev doi: 10.1007/s10555-022-10059-x (2022). - DOI - PubMed
    1. Eckert MA et al. Genomics of ovarian cancer progression reveals diverse metastatic trajectories including intraepithelial metastasis to the fallopian tube. Cancer Discov 6, 1342–1351 (2016). - PMC - PubMed
    1. Nieman KM et al. Adipocytes promote ovarian cancer metastasis and provide energy for rapid tumor growth. Nat. Med 17, 1498–1503 (2011). - PMC - PubMed
    1. Mukherjee A et al. Adipocyte-induced FABP4 expression in ovarian cancer cells promotes metastasis and mediates carboplatin resistance. Cancer Res 80, 1748–1761 (2020). - PMC - PubMed

Publication types