. 2023 Sep;5(9):1595-1614.
doi: 10.1038/s42255-023-00873-0. Epub 2023 Aug 31.

A defect in mitochondrial fatty acid synthesis impairs iron metabolism and causes elevated ceramide levels

Affiliations

A defect in mitochondrial fatty acid synthesis impairs iron metabolism and causes elevated ceramide levels

Debdeep Dutta et al. Nat Metab. 2023 Sep.

Abstract

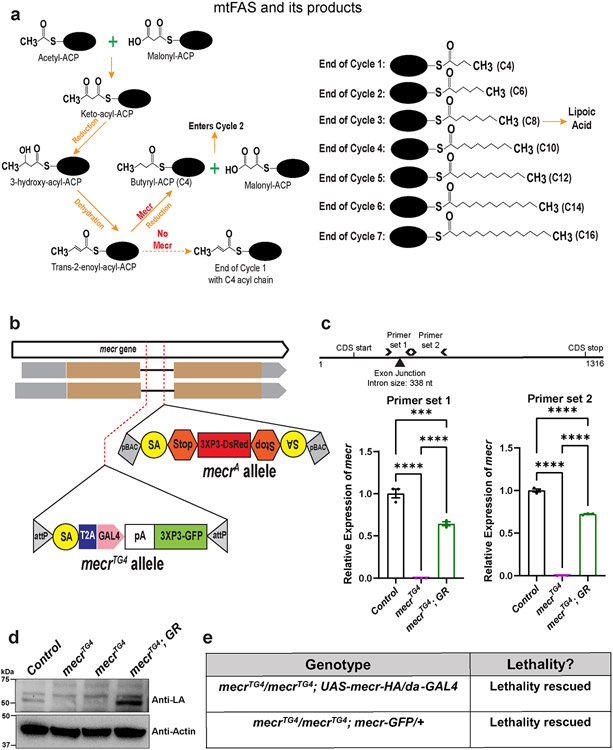
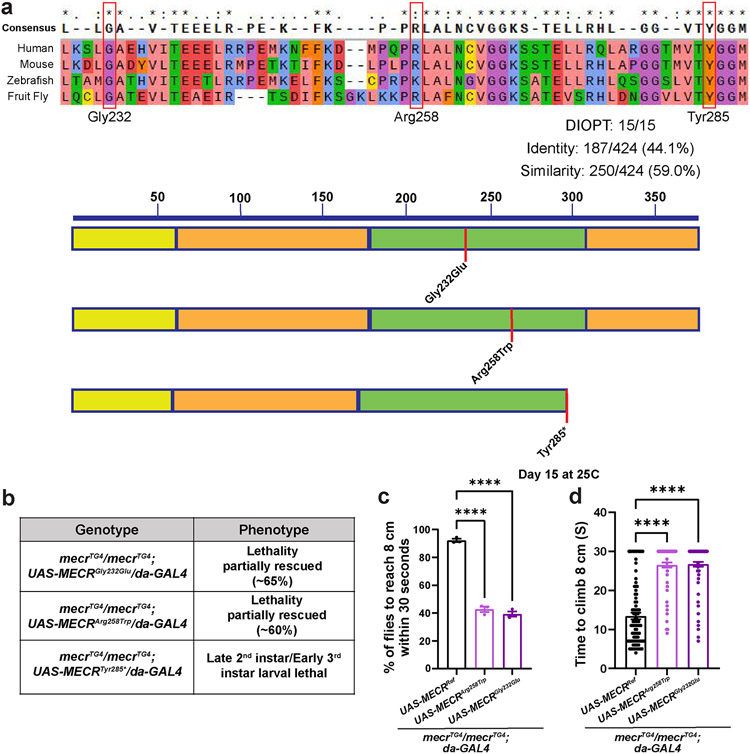
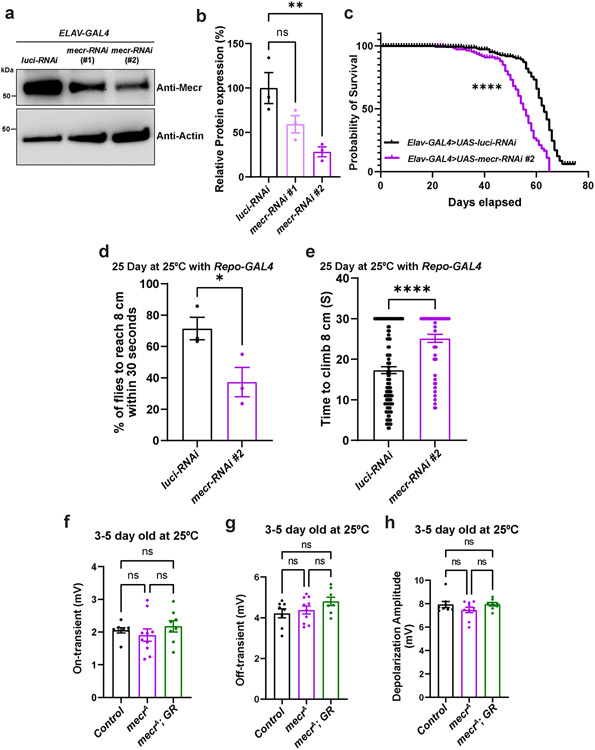
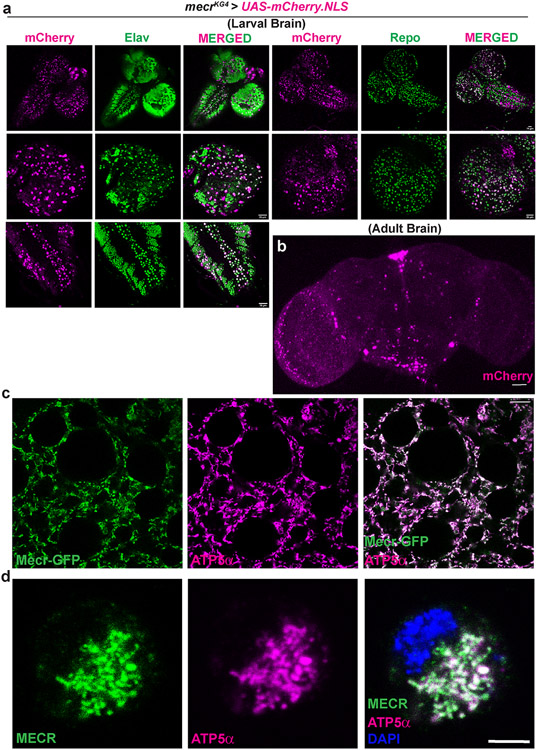
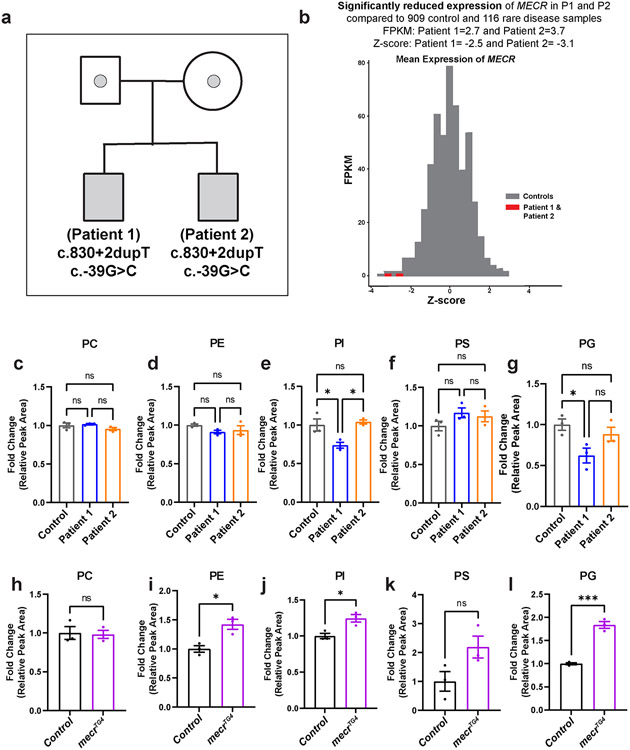
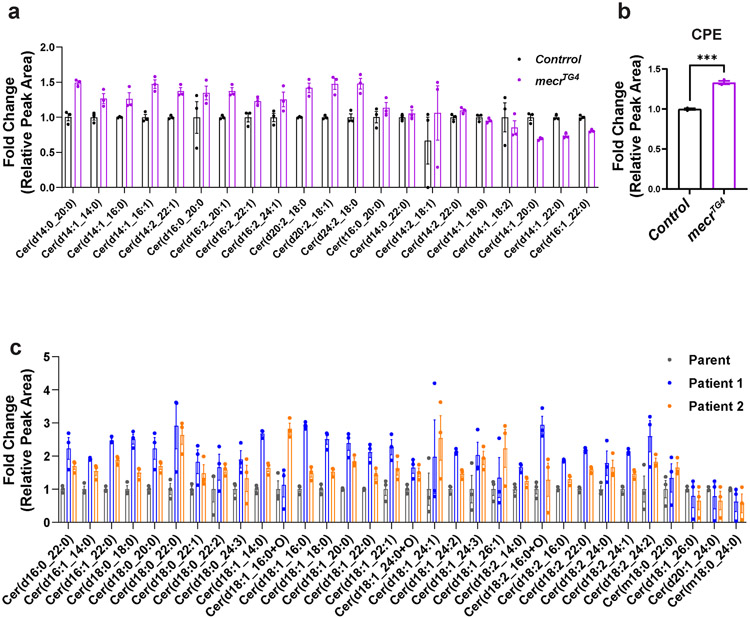
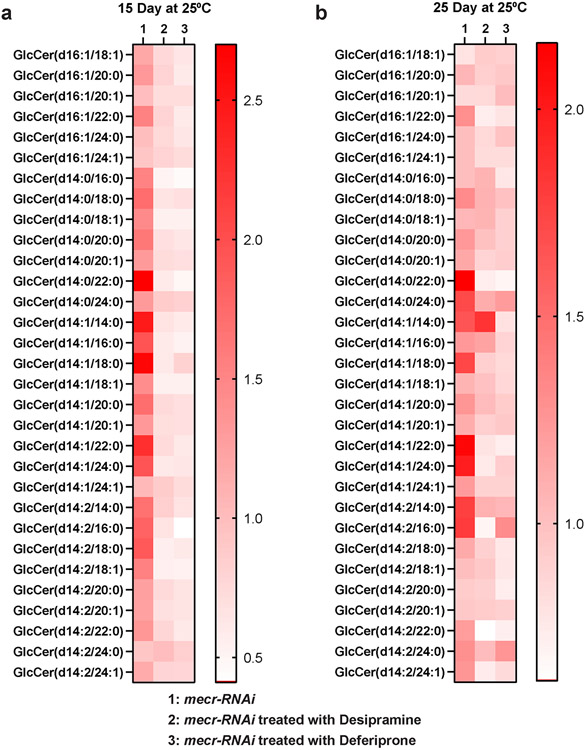
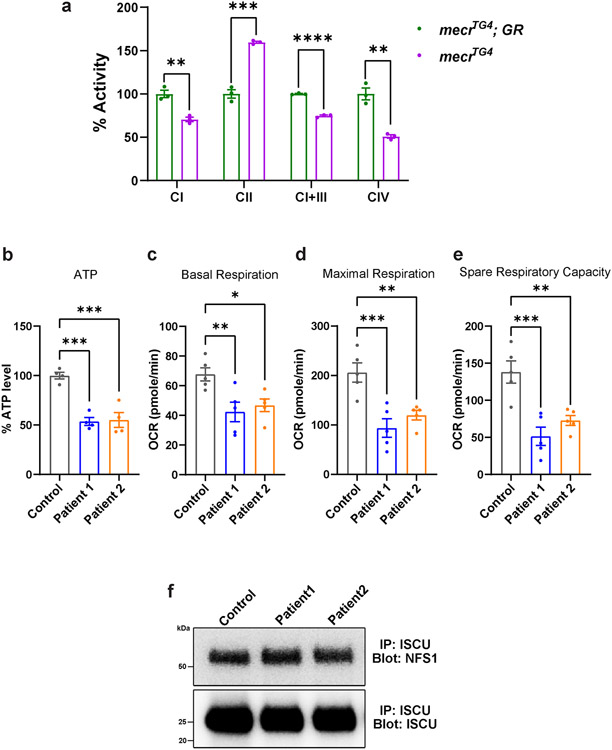
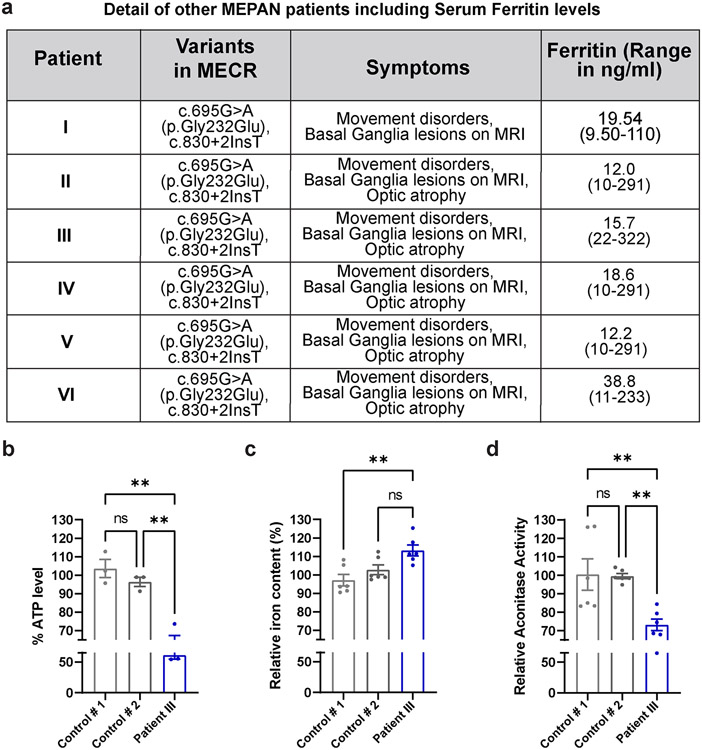
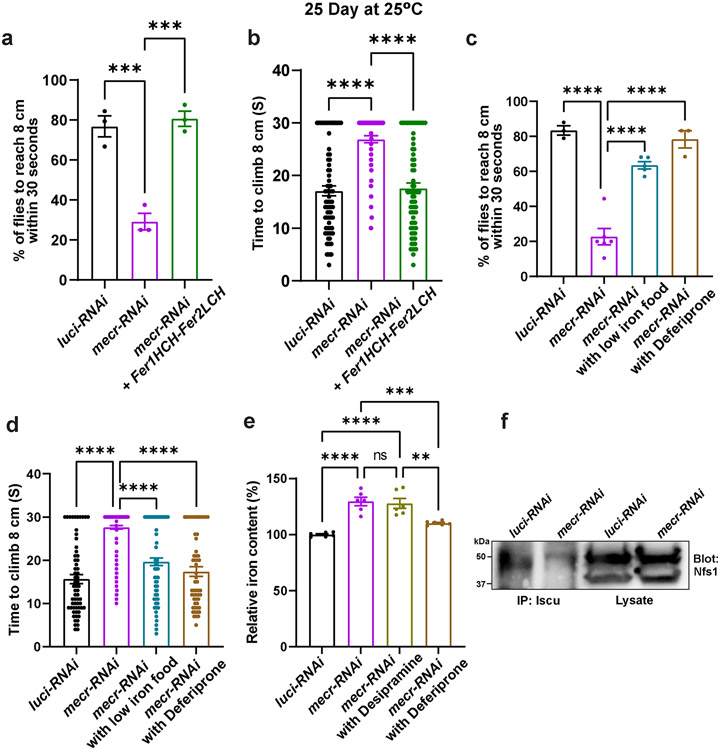
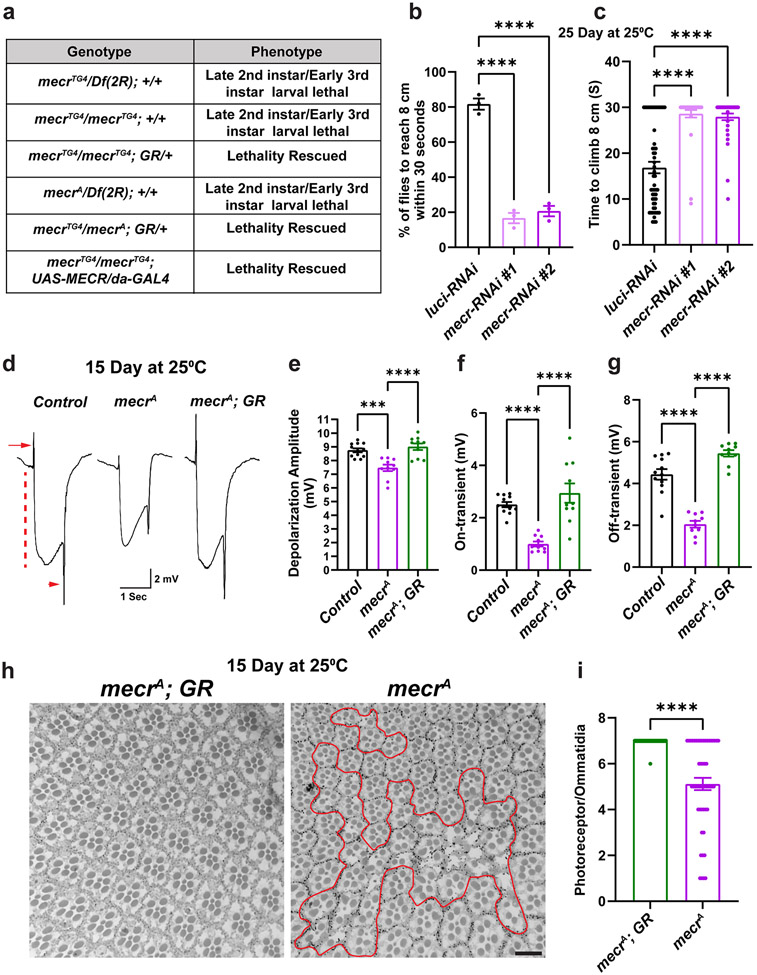
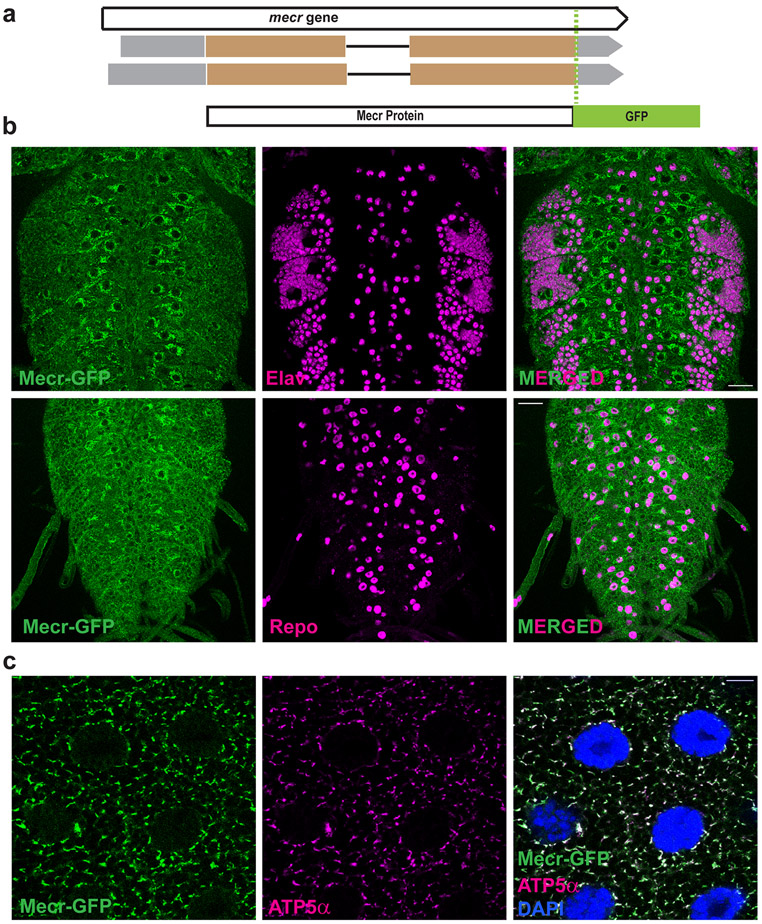
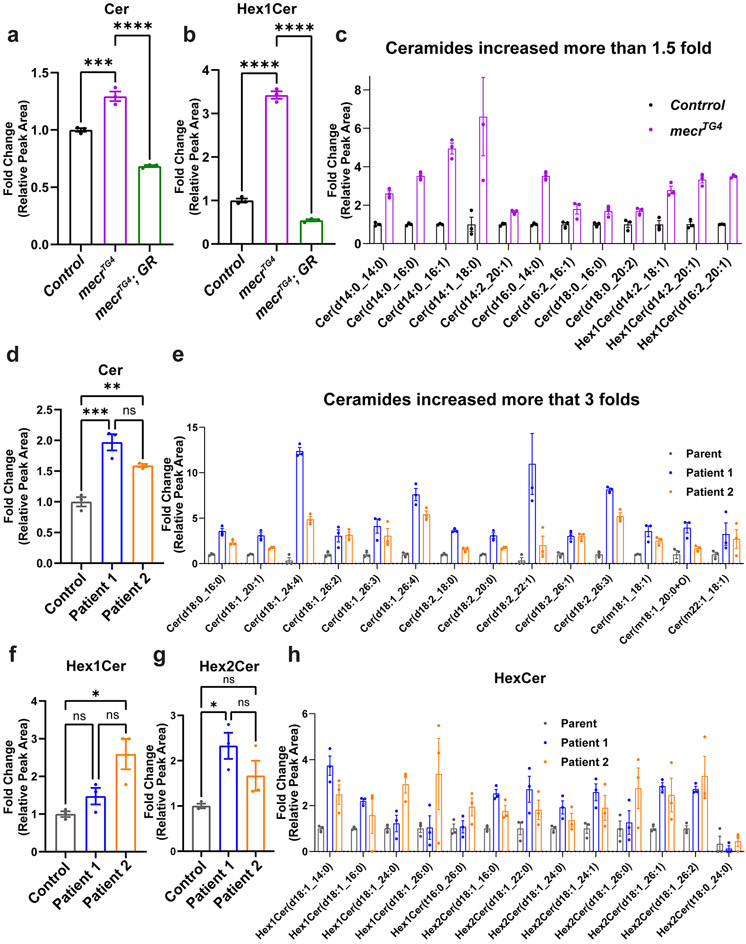
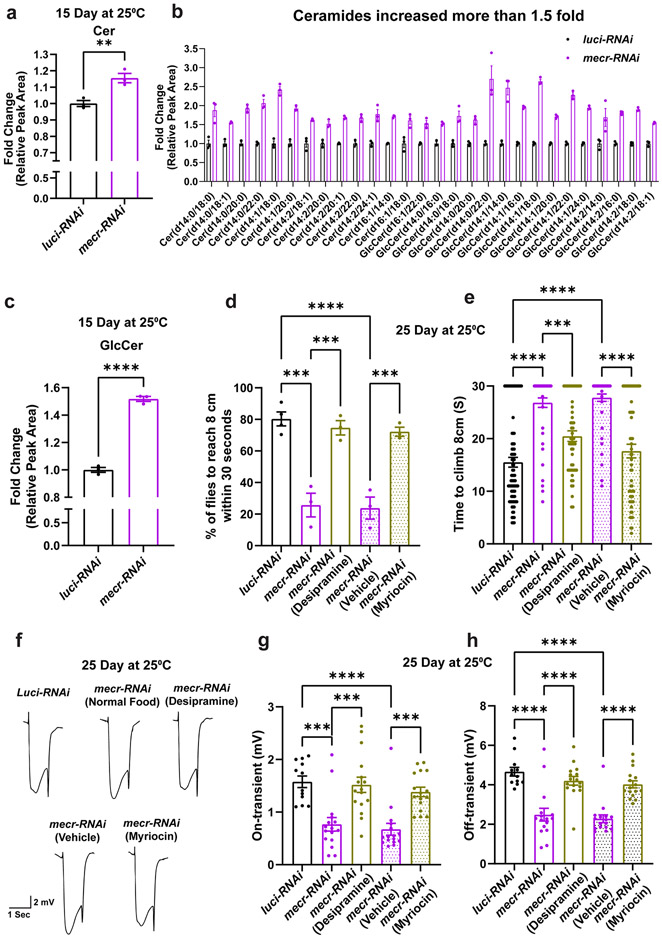
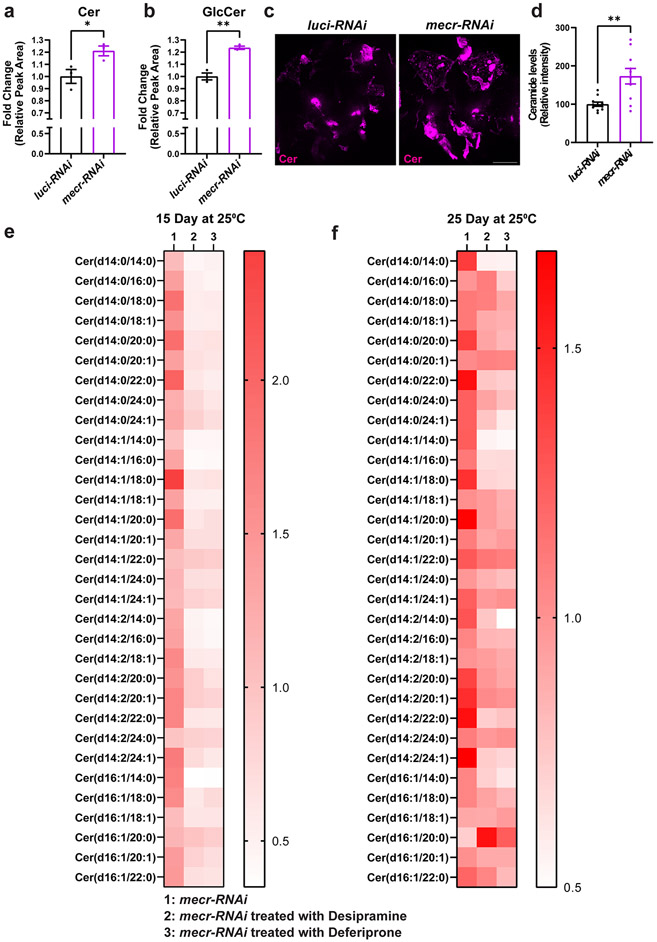
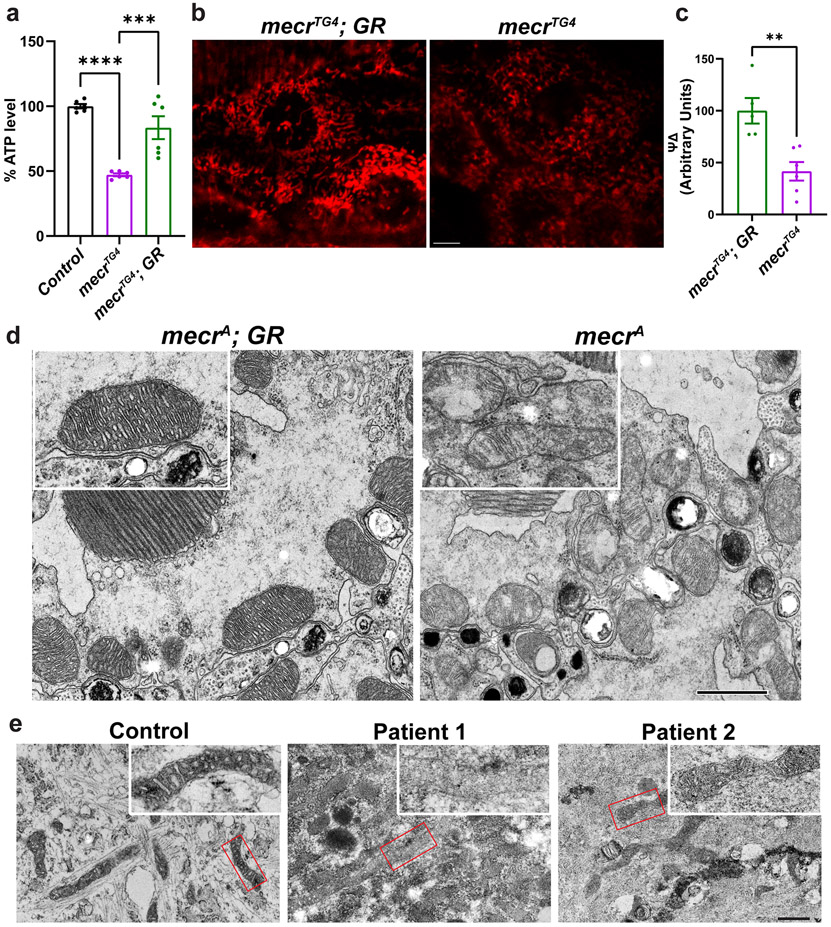
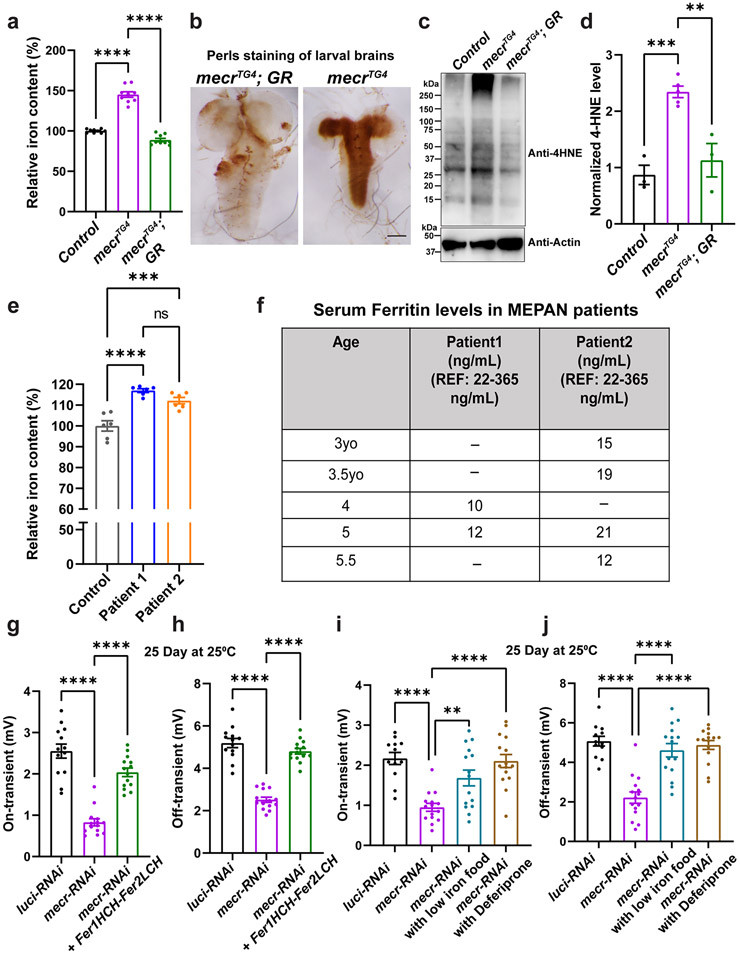
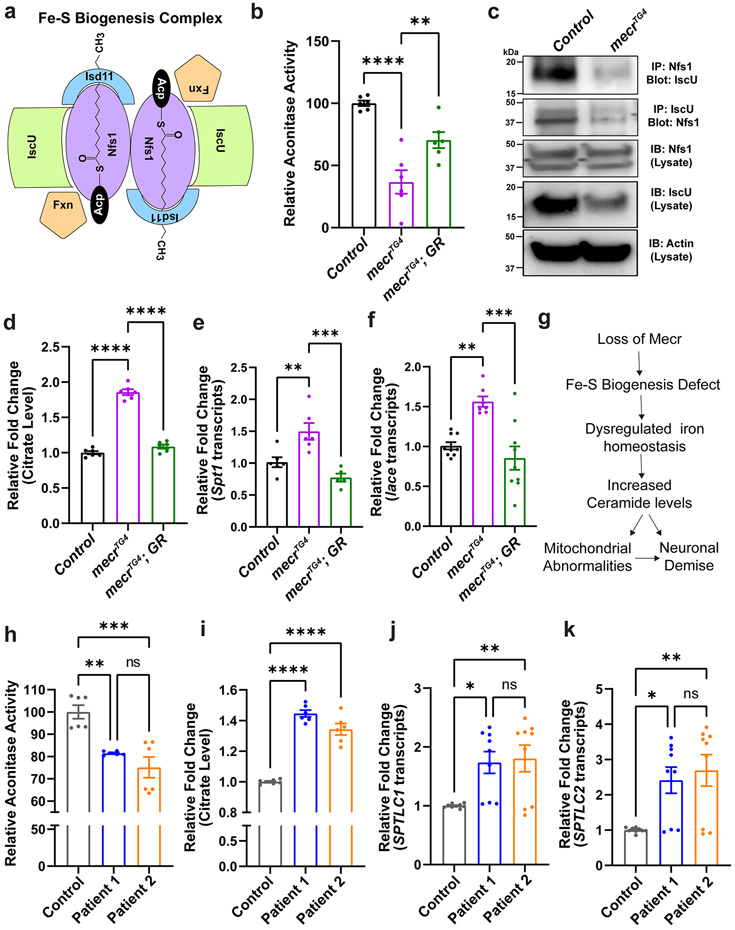
In most eukaryotic cells, fatty acid synthesis (FAS) occurs in the cytoplasm and in mitochondria. However, the relative contribution of mitochondrial FAS (mtFAS) to the cellular lipidome is not well defined. Here we show that loss of function of Drosophila mitochondrial enoyl coenzyme A reductase (Mecr), which is the enzyme required for the last step of mtFAS, causes lethality, while neuronal loss of Mecr leads to progressive neurodegeneration. We observe a defect in Fe-S cluster biogenesis and increased iron levels in flies lacking mecr, leading to elevated ceramide levels. Reducing the levels of either iron or ceramide suppresses the neurodegenerative phenotypes, indicating an interplay between ceramide and iron metabolism. Mutations in human MECR cause pediatric-onset neurodegeneration, and we show that human-derived fibroblasts display similar elevated ceramide levels and impaired iron homeostasis. In summary, this study identifies a role of mecr/MECR in ceramide and iron metabolism, providing a mechanistic link between mtFAS and neurodegeneration.


Conflict of interest statement

Declaration of interest

The authors declare that they have no competing interest.

Figures

Extended Data Fig. 1:
Extended Data Fig. 1:. The mitochondrial fatty acid synthesis pathway and generation of mecr mutants.
(a) Mitochondrial fatty acid synthesis pathway and its products. Briefly, an acetyl and malonyl moiety are condensed to make a four carbon long keto-acyl species, which remains attached to the mitochondrial Acyl Carrier Protein (mtACP), a protein that holds the growing acyl chain during the fatty acid synthesis within the mitochondria. Subsequently, this four-carbon long keto-acyl ACP undergoes a reduction-dehydration-reduction cycle to produce a butyryl-ACP (C4). C4 enters into the cycle, and two carbons from the malonyl moiety are attached to the butyryl species to make an acyl chain of six carbon length. This cycle continues until the carbon length of the growing acyl chain reaches up to 16-18 carbon. (b) Schema showing the mecr mutants used in this study. (c) Schema showing the Primers used for quantitative real-time PCR and the graphs showing the relative levels of mecr transcripts in mecrTG4 mutants. Each dot represents data from three technical replicates. (d) Western blot showing lipoic acid (LA) levels linked to Muc (ortholog of yeast Lat1 and a component of PDH complex in fruit fly) and CG5214 (ortholog of yeast Kgd2 and a component of OGDH complex in fruit fly) in mecr mutants. (e) Effects of a transgene containing mecr-GFP (Fosmid clone, CBGtg9060C0290D) or of ubiquitous expression of HA-tagged fly mecr on mecrTG4 homozygous mutants. One-way ANOVA followed by a Tukey’s post-hoc test was performed for the statistical analyses. Error bars represent SEM (****p < 0.0001).
Extended Data Fig. 2:
Extended Data Fig. 2:. The variants observed in patients are conserved in the fly Mecr protein and homozygous mecr mutants are not fully rescued by expressing these MECR variants.
(a) Protein alignments of Mecr proteins. Red boxes indicate the amino acid that are variant in MEPAN patients. Schema shows the relative position of the patient variants in MECR protein. (b) Effects of ubiquitous expression of human MECR variants when driven by da-GAL4 in mecr mutants. (c) Percentage of 15-day-old flies that are able to climb 8 cm within 30 seconds. Each dot represents the percentage of flies from three independent experiments. (d) Average time taken by 15-day-old flies to climb 8 cm. Each dot represents the time taken by one fly in each of the three experiments. n = 93 (MECRRef), n = 86 (MECRArg258Trp), n = 84 (MECRGly232Glu) flies. One-way ANOVA followed by a Tukey’s post-hoc test was performed for the statistical analyses. Error bars represent SEM (****p < 0.0001).
Extended Data Fig. 3:
Extended Data Fig. 3:. Loss of mecr causes a reduction in lifespan as well as in climbing ability.
(a-b) Western blot and quantification showing relative levels of Mecr protein upon neuronal knockdown (elav-GAL4) with two different RNAi lines at 25°C. Each dot represents the data from three independent experiments. For statistical analyses, one-way ANOVA followed by a Dunnett’s multiple comparison test is carried out. Error bars represent SEM (**p < 0.01). (c) Lifespan of flies with neuronal knockdown of mecr. (d) Percentage of 25-day-old flies that can climb 8 cm within 30 seconds. Each dot represents the percentage of flies from three independent experiments. (e) Average time taken by 25-day-old flies to climb 8 cm. n = 128 (luci-RNAi) and n = 55 (mecr-RNAi) flies. For statistical analyses, two-tailed Student’s t-test is carried out. Error bars represent SEM (*p<0.05; ****p < 0.0001). (f-h) Quantification of ERG traces from 3-5 day-old flies. Each dot represents the data from one fly. n = 8 (Control and mecrA; GR), n = 10 (mecrA) flies. For statistical analyses, one-way ANOVA followed by a Tukey’s post-hoc test is carried out. Error bars represent SEM.
Extended Data Fig. 4:
Extended Data Fig. 4:. mecr is expressed in neurons and glia, and Fly Mecr and Human MECR proteins are localized to mitochondria.
(a) Expression of mCherry driven by mecrKG4 (mecrKozak-GAL4, where we replaced the coding region of the gene with a Kozak sequence followed by a GAL4 gene) in larval brains. Elav-positive cells are neurons and Repo-positive cells are glia. (b) Expression of mCherry driven by mecrKozak-GAL4 in the adult brain. Note that mecr expression is sparse in the adult brains. However, a few cells including the prospective medial neurons, which typically produce insulin-like peptides express it abundantly. Scale bar 50 μm. (c) Colocalization of Mecr-GFP and ATP5α in 3rd instar larval fatbody tissue. Scale bar 10 μm. (d) Colocalization of human MECR and ATP5α in S2 cells. Scale bar 3.5 μm. Immunostaining was performed using an antibody against human MECR protein and an antibody against ATP5α. All experiments were carried out at least 2 times.
Extended Data Fig. 5:
Extended Data Fig. 5:. RNA levels of MECR are reduced in MEPAN patients and relative levels of phospholipids are differentially altered in patient-derived fibroblasts and mecr mutants.
(a) Pedigree of the two patients with MEPAN syndrome identified through UDN. (b) RNA-seq from blood showing reduced levels of MECR transcripts in both patients. (c-g) Relative phospholipids levels in MEPAN patient-derived fibroblasts compared to the parent-derived control fibroblasts: phosphatidylcholine (PC), phosphatidylethanolamine (PE), phosphatidylinositol (PI), phosphatidylserine (PS) and phosphatidylglycerol (PG). The dots represent values of technical replicates from one set of biological replicates. For statistical analyses one-way ANOVA followed by a Tukey’s post-hoc test are carried out. Error bars represent SEM (*p < 0.05) (h-l) Relative levels of different phospholipids in the mecrTG4 larvae compared to control. The dots represent values of technical replicates from one set of biological replicates (n = 350 2nd instar larva). For statistical analyses, two-tailed Student’s t-test are carried out. Error bars represent SEM (*p < 0.05; ***p < 0.001).
Extended Data Fig. 6:
Extended Data Fig. 6:. Altered ceramide levels in mecr mutants and human fibroblasts.
(a) Graph showing the ceramide species in the mecrTG4 fly mutant larvae. Data are presented as mean values +/− SEM (b) Graph showing the relative levels of ceramidephosphoethanolamine (CPE) in the mecrTG4 fly mutant larvae. For statistical analyses, two-tailed Student’s t-test are carried out. Error bars represent SEM (***p < 0.001). For a and b, the dots represent values of technical replicates from one set of biological replicates (n= 350 2nd instar larva). (c) Graph showing the ceramide species in both patient fibroblasts. The dots represent values of technical replicates from one set of biological replicates. Data are presented as mean values +/− SEM.
Extended Data Fig. 7:
Extended Data Fig. 7:. Desipramine and Deferiprone treatment lowers glucosylceramide levels in the fly heads in which mecr is reduced in neurons.
(a-b) Graphs showing the fold changes in different glucosylceramide species upon treatment with Desipramine and Deferiprone at 15- and 25-day timepoints. Each square indicates the average value of three technical replicates.
Extended Data Fig. 8:
Extended Data Fig. 8:. Loss of mecr/MECR leads to a respiratory deficit.
(a) Relative activity of ETC complexes (CI-IV) in mecrTG4 mutants and controls. mecrTG4 mutant larvae display reduced activity of Complex-I, I+III, and IV and increased activity of Complex-II. Each dot represents data from three technical replicates (n = 150 2nd instar larva). For statistical analyses, two-tailed Student’s t test are carried out. Error bars represent SEM (**p < 0.01; ***p < 0.001****p < 0.0001). (b) Relative levels of ATP in fibroblasts from patients and parental control. Each dot represents the values from four experiments. For statistical analyses, one-way ANOVA followed by a Tukey’s post-hoc test are carried out. Error bars represent SEM (***p < 0.001). (c-e) Relative oxygen consumption rates in control and patient derived fibroblasts as measured by Seahorse analyses. (c) Basal respiration, (d) maximal respiration, and (e) spare respiratory capacity are reduced in the patient-derived fibroblasts compared to fibroblasts derived from parent control. Each dot represents the values of replicates in each well from one set of biological replicates. For statistical analyses one-way ANOVA followed by a Dunnett’s multiple comparisons test are carried out. Error bars represent SEM (*p < 0.05; **p < 0.01; ***p < 0.001). (f) Co-IP from one set of biological replicates shows the interaction between NFS1 and ISCU in the fibroblasts. After performing immunoprecipitation using Mouse Anti-ISCU antibody, the blot was probed for NFS1, stripped, and reblotted for ISCU.
Extended Data Fig. 9:
Extended Data Fig. 9:. Ferritin levels are low in the additional MEPAN patients and the ATP levels, iron levels and aconitase activity are affected in the fibroblasts of Patient III.
(a) Table showing MEPAN patients including mutations, symptoms, and ferritin levels in blood. Out of these six patients described in the table, one patient (Patient III) was described earlier by Heimer et al., 2016. The other five patients are newly identified individuals who have not been reported elsewhere. (b) Graph showing relative ATP levels in fibroblasts from patient III compared to the fibroblasts from unrelated controls. Each dot represents the values of replicates from three experiments. (c) Graph showing the relative iron levels in the fibroblasts from patient III. Each dot represents the values of replicates from three experiments. (d) Graph showing the relative aconitase activity in the fibroblasts from patient III. Each dot represents the values of replicates from three experiments. For statistical analyses, one-way ANOVA followed by a Tukey’s post-hoc test are carried out. Error bars represent SEM (**p < 0.01).
Extended Data Fig. 10:
Extended Data Fig. 10:. Reducing iron levels alleviates age-dependent locomotor defects in flies with neuronal knockdown of mecr.
(a-b) Average percentage and climbing time to reach 8 cm of 25-day-old flies with neuronal knockdown of mecr (elav-GAL4>mecr-RNAi) and expressing ferritins. n = 81 (luci-RNAi), n = 76 (mecr-RNAi), n = 74 (mecr-RNAi and Fer1HCH-Fer2LCH) flies. (c-d) Average percentage and climbing time of 25-day-old flies upon neuronal (by elav-GAL4) knockdown of mecr treated with and without low iron food as well as deferiprone. n = 62 (luci-RNAi), n = 155 (mecr-RNAi), n = 105 (mecr-RNAi with low iron food), n = 55 (mecr-RNAi with deferiprone) flies. For a and c, each dot represents the percentage of flies from at least three independent experiments. For b and d, each dot represents the time taken by one fly in at least three independent experiments. (e) Relative amount of iron in the untreated, desipramine and deferiprone-treated fly heads with neuronal knockdown of mecr. Each dot represents the values of replicates from three experiments each using 25 fly heads. (f) Co-IP shows the interaction between Nfs1 and Iscu in the fly heads with neuronal knockdown of mecr. One-way ANOVA followed by a Tukey’s post-hoc test is carried out for statistical analyses. Error bars represent SEM (***p < 0.001; ****p < 0.0001).
Figure 1:
Figure 1:. Loss of mecr causes an age-dependent locomotor impairment, ERG defects and photoreceptor loss.
(a) Phenotypes of mecr mutants and complementation with an 80 kb P[acman] rescue construct (GR) containing the mecr gene or ubiquitous expression of human MECR. (b-c) Climbing ability of 25-day-old flies upon neuronal knockdown (by elav-GAL4) of mecr with two independent RNAi lines. (b) Percentage of 25-day-old flies that are able to climb 8 cm within 30 seconds. Each dot represents the percentage of flies from three independent experiments. (c) Average time taken by 25-day-old flies to climb 8 cm. Each dot represents the time taken by one fly in each of the three independent experiments. Note that if the flies are unable to climb 8cm within the given time, we record them at the 30 sec, and these flies are poor performers. n = 54 (luci-RNAi), n = 35 (mecr-RNAi #1), n= 46 (mecr-RNAi#2) flies. (d) ERG traces of controls and mecrA mutant clones of 15-day-old flies. ERG recordings are induced by a light pulse and exhibit “on” and “off” transients (arrow and arrowhead), indicative of synaptic communication between the PR neurons and postsynaptic cells. They also exhibit a decreased amplitude which corresponds to the depolarization of PR neurons (dashed line). (e-g) Quantification of depolarization amplitude as well as “on” and “off” transients for the respective genotypes. Each dot represents the data from one fly. n = 12 (Control), n = 10 (mecrA and mecrA; GR) flies. (h) Retinal sections and (i) quantification of PRs per ommatidium from control and mecrA mutant clones in 15-day-old flies. The scale bar is 10 μm. The red line marks the mutant clone area. In i, each dot represents the data from the retinal sections of flies. n = 51 ommatidia from at least 5 independent samples. All the flies were maintained at 25°C. For statistical analyses between two samples, two-tailed Student’s t test, and for three samples, one-way ANOVA followed by a Tukey’s post-hoc test are carried out. Error bars represent SEM (***p < 0.001; ****p < 0.0001).
Figure 2:
Figure 2:. Mecr is enriched in a subset of glial cells in larval brain and is present in mitochondria in salivary glands.
(a) Schematic diagram showing the mecr-GFP transgene (Fosmid clone, CBGtg9060C0290D) used in this study. (b) Expression of Mecr-GFP in Elav-positive neuronal and Repo-positive glial cells of the 3rd instar larval brain. Scale bar: 25 μm. (c) Salivary gland cells from 3rd instar larva and colocalization of Mecr-GFP with ATP5α, an inner mitochondrial membrane protein, Scale bar: 10 μm. All experiments were carried out at least 2 times.
Figure 3:
Figure 3:. Loss of mecr/MECR leads to an increase in ceramide levels.
(a-c) Relative amounts of ceramides and hexosylceramides in mecrTG4 mutants. The dots represent values of technical replicates from one set of biological replicates (n = 350 2nd instar larva). (d-e) Relative amounts of ceramides in fibroblasts from patients. (f-h) Relative amount of hexosylceramides in patient-derived fibroblasts. The dots represent values of technical replicates from one set of biological replicates. For statistical analyses, one-way ANOVA followed by a Tukey’s post-hoc test is carried out. Error bars represent SEM (*p < 0.05; **p < 0.01; ***p < 0.001; ****p < 0.0001).
Figure 4:
Figure 4:. Reducing Ceramide levels alleviates the age dependent phenotypes in fruit fly.
(a-c) Relative amounts of ceramides and glucosylceramides in fly heads with neuronal knockdown of mecr. The dots represent values from technical replicates. n = 100 fly heads. (d-e) Average percentage of flies climbing 8 cm and climbing time of flies with and without Myriocin and Desipramine treatment. In d, each dot represents the percentage of flies from three independent experiments, and in e, each dot represents the time taken by one fly in three independent experiments. n = 84 (luci-RNAi), n = 51 (mecr-RNAi), n = 51 (mecr-RNAi with Desipramine), n = 51 (mecr-RNAi with Vehicle), n = 57 (mecr-RNAi with Myriocin) flies. (f-h) ERG traces and quantification showing the effects of Myriocin and Desipramine treatment on 25-day-old flies with neuronal knockdown of mecr. For g-h, each dot represents the data from one fly. n = 12 (luci-RNAi), n = 16 (mecr-RNAi, mecr-RNAi (Desipramine), mecr-RNAi (Vehicle), mecr-RNAi (Myriocin) flies. For statistical analyses between two samples, two-tailed Student’s t test, and for three samples, one-way ANOVA followed by a Tukey’s post-hoc test are carried out. Error bars represent SEM (**p < 0.01; ***p < 0.001; ****p < 0.0001).
Figure 5:
Figure 5:. RNAi-mediated knockdown of mecr elevates ceramide levels which are lowered upon treatments with Desipramine or Deferiprone.
(a-b) Graph showing relative levels of ceramide and glucosylceramide in 25-day-old brains upon neuronal knockdown (by elav-GAL4) of mecr. The dots represent values from technical replicates. n = 100 fly heads. (c) Ceramide levels in 25-day-old brains. Scale bar 100μm. (d) Quantification of relative ceramide intensity in 25-day-old brains upon neuronal knockdown (by elav-GAL4) of mecr. Each dot represents the data from one adult heads (n = 11 and 10 biologically independent samples from luci-RNAi and mecr-RNAi, respectively). (e-f) Graphs showing the relative changes in different ceramide species upon treatment with Desipramine (2) and Deferiprone (3). Each square indicates the average value from three technical replicates. For statistical analyses between two samples, two-tailed Student’s t test is carried out. Error bars represent SEM (*p < 0.05; **p < 0.01).
Figure 6:
Figure 6:. Loss of mecr/MECR impairs mitochondrial function and morphology.
(a) Relative levels of ATP in mecrTG4 mutants and controls. Each dot represents the values of replicates from two independent experiments using 25 2nd instar larva. (b) Levels of mitochondrial membrane potential as measured by TMRM in larval muscle. Scale bar is 5 μm. (c) Graph showing relative quantification of TMRE. Each dot represents the data from one larva (n = 5 and 6 biologically independent samples from mecrTG4; GR and mecrTG4, respectively). (d) Transmission Electron micrographs showing mitochondrial morphology in photoreceptor neurons of 15-day-old flies. Inset: Single mitochondrion showing the extent of severity in mitochondrial morphology in mecr mutant clones (right) compared to control (left). Scale bar is 0.8 μm. At least six flies from two independent experiments were used for TEM imaging. (e) Transmission Electron micrographs showing mitochondrial morphology in control and MEPAN patient derived fibroblasts. Inset: Enlarged area from the indicated regions shown in e. Scale bar 0.6 μm. Cells from two plates for each patient were used for TEM imaging. For statistical analyses between two samples, two-tailed Student’s t test, and for three samples, one-way ANOVA followed by a Tukey’s post-hoc test are carried out. Error bars represent SEM (**p < 0.01; ***p < 0.001; ****p < 0.0001).
Figure 7:
Figure 7:. Loss of mecr/MECR impairs iron metabolism.
(a) Relative amount of iron in whole body of mecrTG4 mutants. Each dot represents the values from three experiments with two independent sets of biological replicates (n =50 2nd instar larva). (b) Iron staining in the larval brains of mecrTG4 mutants. Scale bar: 2.54 mm. (c-d) Western blot and quantification showing 4-HNE levels in control and mecrTG4 mutant. Each dot represents the values of replicates from at least three independent experiments. (e) Relative amount of iron in fibroblasts from patients and parental control. The dots represent the values of technical replicates from one set of biological replicates. (f) Table showing patients' serum ferritin levels. REF indicates the normal range of Ferritin levels in the control population. (g-h) Quantification of ERG traces showing the effects of ferritin overexpression in 25-day-old flies with neuronal knockdown (elav-GAL4) of mecr. n = 13 (luci-RNAi), n = 14 (mecr-RNAi and mecr-RNAi+Fer1HCH-Fer2LCH) flies. (i-j) ERG quantification showing the effects of low iron food and Deferiprone treatment on 25-day-old flies with neuronal knockdown (elav-GAL4) of mecr. n = 12 (luci-RNAi), n = 15 (mecr-RNAi and mecr-RNAi with low iron food, and mecr-RNAi with Deferiprone) flies. For statistical analyses between two samples, we performed two-tailed Student’s t-test, and for three samples, one-way ANOVA followed by a Tukey’s post-hoc test are performed. Error bars represent SEM (**p < 0.01; ***p < 0.001; ****p < 0.0001).
Figure 8:
Figure 8:. Loss of mecr/MECR reduces aconitase activity and promotes ceramide synthesis.
(a) Diagram of the proteins of Fe-S biogenesis complex. (b) Relative aconitase activity in mecrTG4 mutants. Each dot represents the values from three experiments with two independent sets of biological replicates (n = 50 2nd instar larva). (c) The interaction between Nfs1 and Iscu in mecrTG4 mutants is reduced. (d) Relative citrate levels in the mecrTG4 mutants. Each dot represents the values from three independent experiments (n = 50 2nd instar larva). (e-f) Relative fold changes in the transcript levels of Spt1 and lace in mecrTG4 mutants. Each dot represents the values from two (for Spt1) or three (for lace) independent experiments. (g) Proposed mechanism of neurodegeneration upon loss of mecr. (h) Relative aconitase activity in the fibroblasts from patients and parental control. Each dot represents the values from two independent experiments. (i) Relative citrate levels in patient-derived fibroblasts. Each dot represents the values from three independent experiments. (j-k) Relative fold changes in the transcript levels of SPTLC1 and SPTLC2 in patient-derived fibroblasts. Each dot represents the values of replicates from three independent experiments. For statistical analyses between two samples, two-tailed Student’s t test, and for three samples, one-way ANOVA followed by a Tukey’s post-hoc test are carried out. Error bars represent SEM (*p < 0.05; **p < 0.01; ***p < 0.001; ****p < 0.0001).

References

    1. Maier T, Jenni S & Ban N Architecture of mammalian fatty acid synthase at 4.5 å resolution. Science 311, 1258–1262 (2006). - PubMed
    1. Fhu CW & Ali A Fatty Acid Synthase: An Emerging Target in Cancer. Molecules 25, 3935 (2020). - PMC - PubMed
    1. Miinalainen IJ et al. Characterization of 2-enoyl thioester reductase from mammals. An ortholog of YBR026p/MRF1’p of the yeast mitochondrial fatty acid synthesis type II. J. Biol. Chem 278, 20154–20161 (2003). - PubMed
    1. Nair RR et al. Genetic modifications of Mecr reveal a role for mitochondrial 2-enoyl-CoA/ACP reductase in placental development in mice. Hum. Mol. Genet 26, 2104–2117 (2017). - PubMed
    1. Venkatesan R. et al. Insights into mitochondrial fatty acid synthesis from the structure of heterotetrameric 3-ketoacyl-ACP reductase/3R-hydroxyacyl-CoA dehydrogenase. Nat. Commun 5, (2014). - PubMed

Publication types