

Quantifying the human impact of Melbourne's 111-day hard lockdown experiment on the adult population
- PMID: 37653145
- PMCID: PMC10846680
- DOI: 10.1038/s41562-023-01638-1
Quantifying the human impact of Melbourne's 111-day hard lockdown experiment on the adult population
Abstract
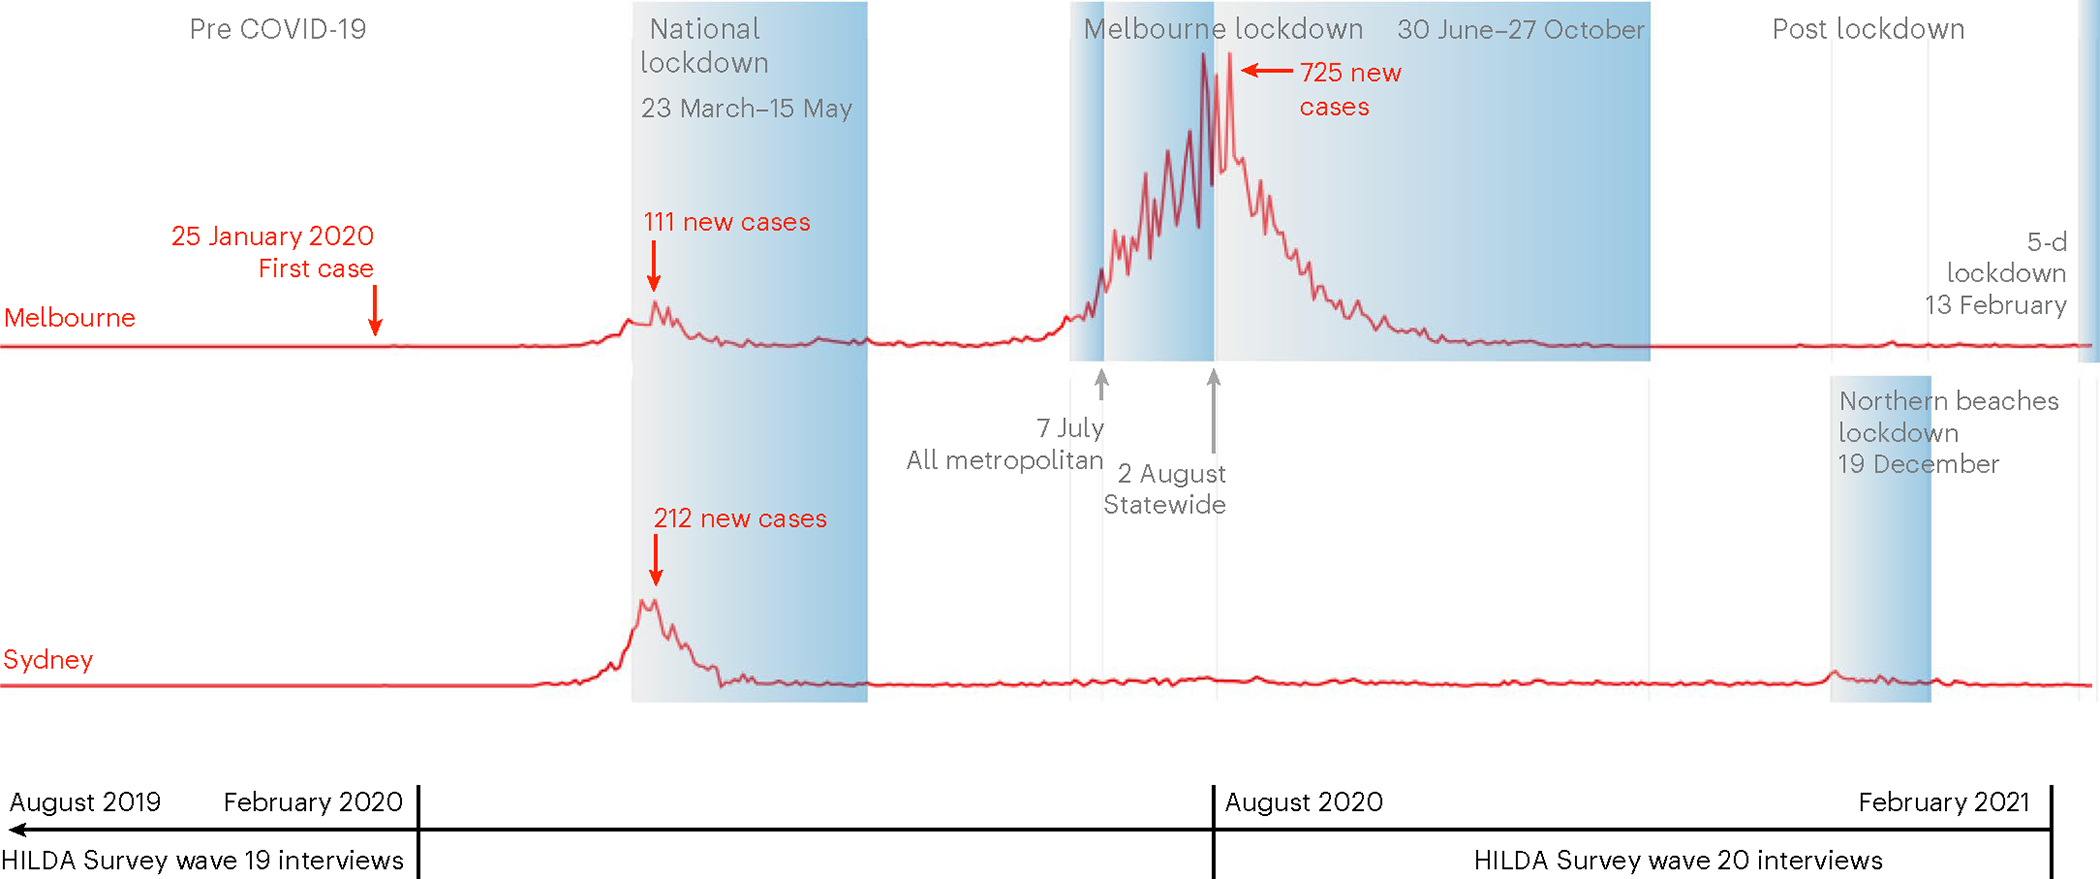
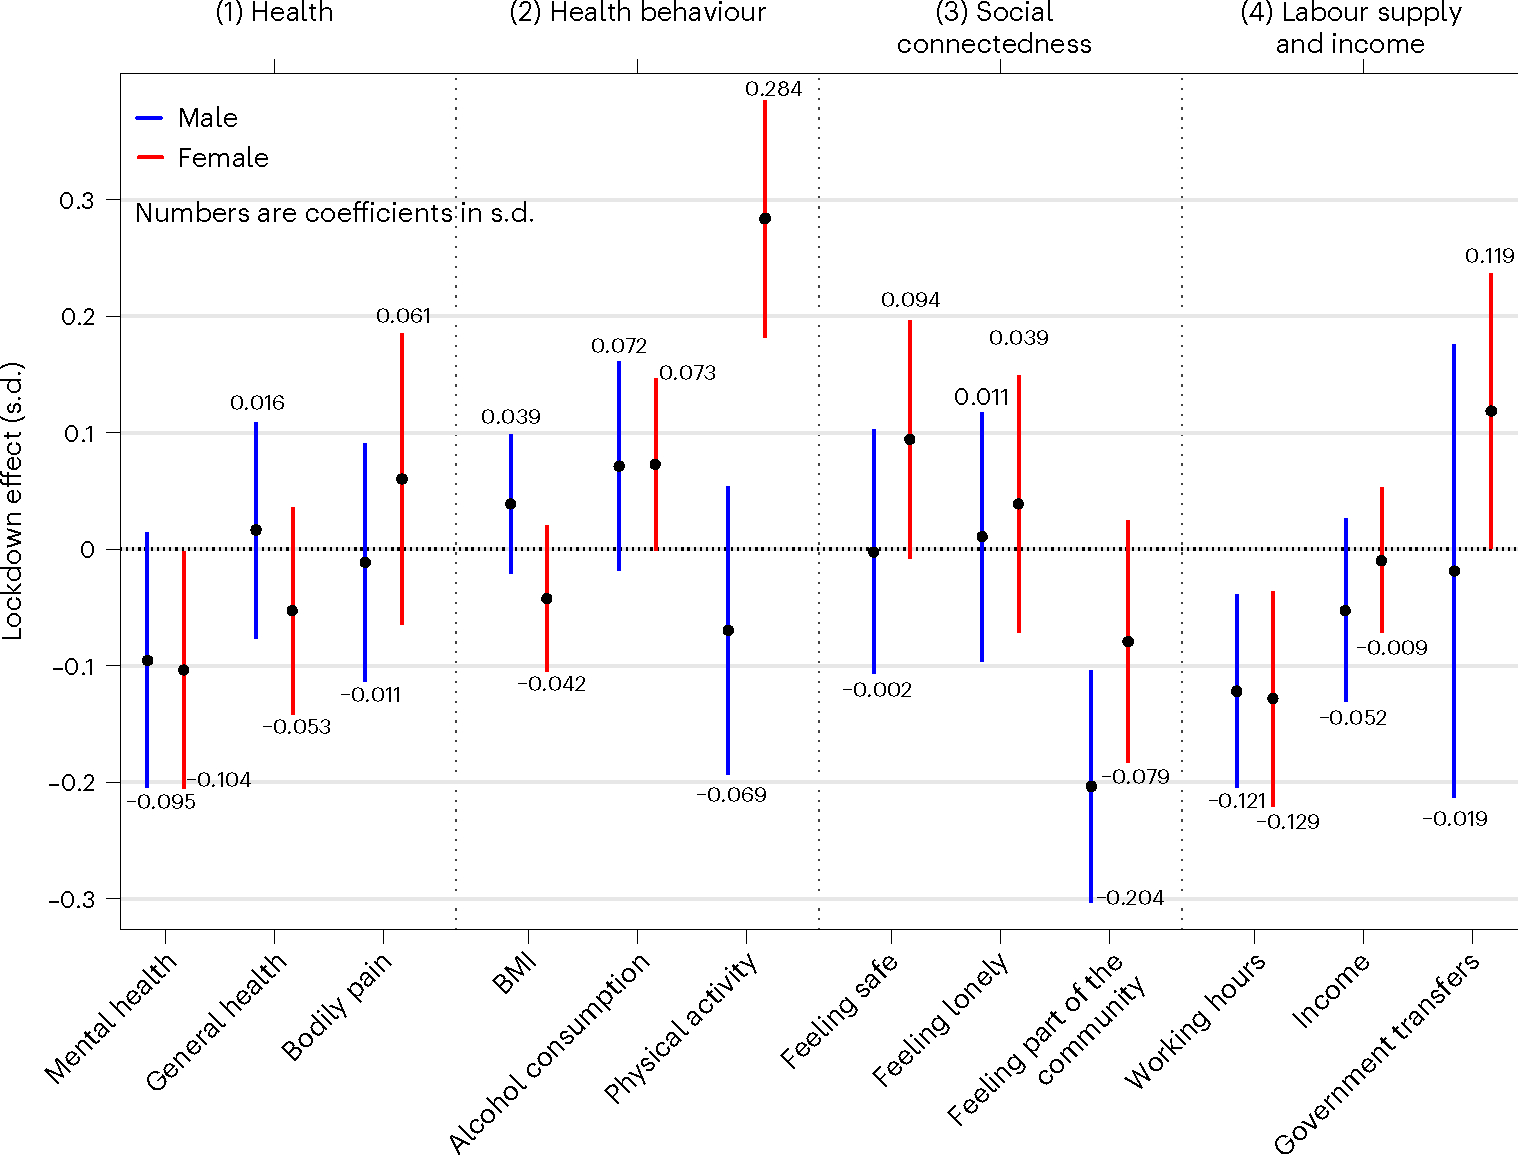
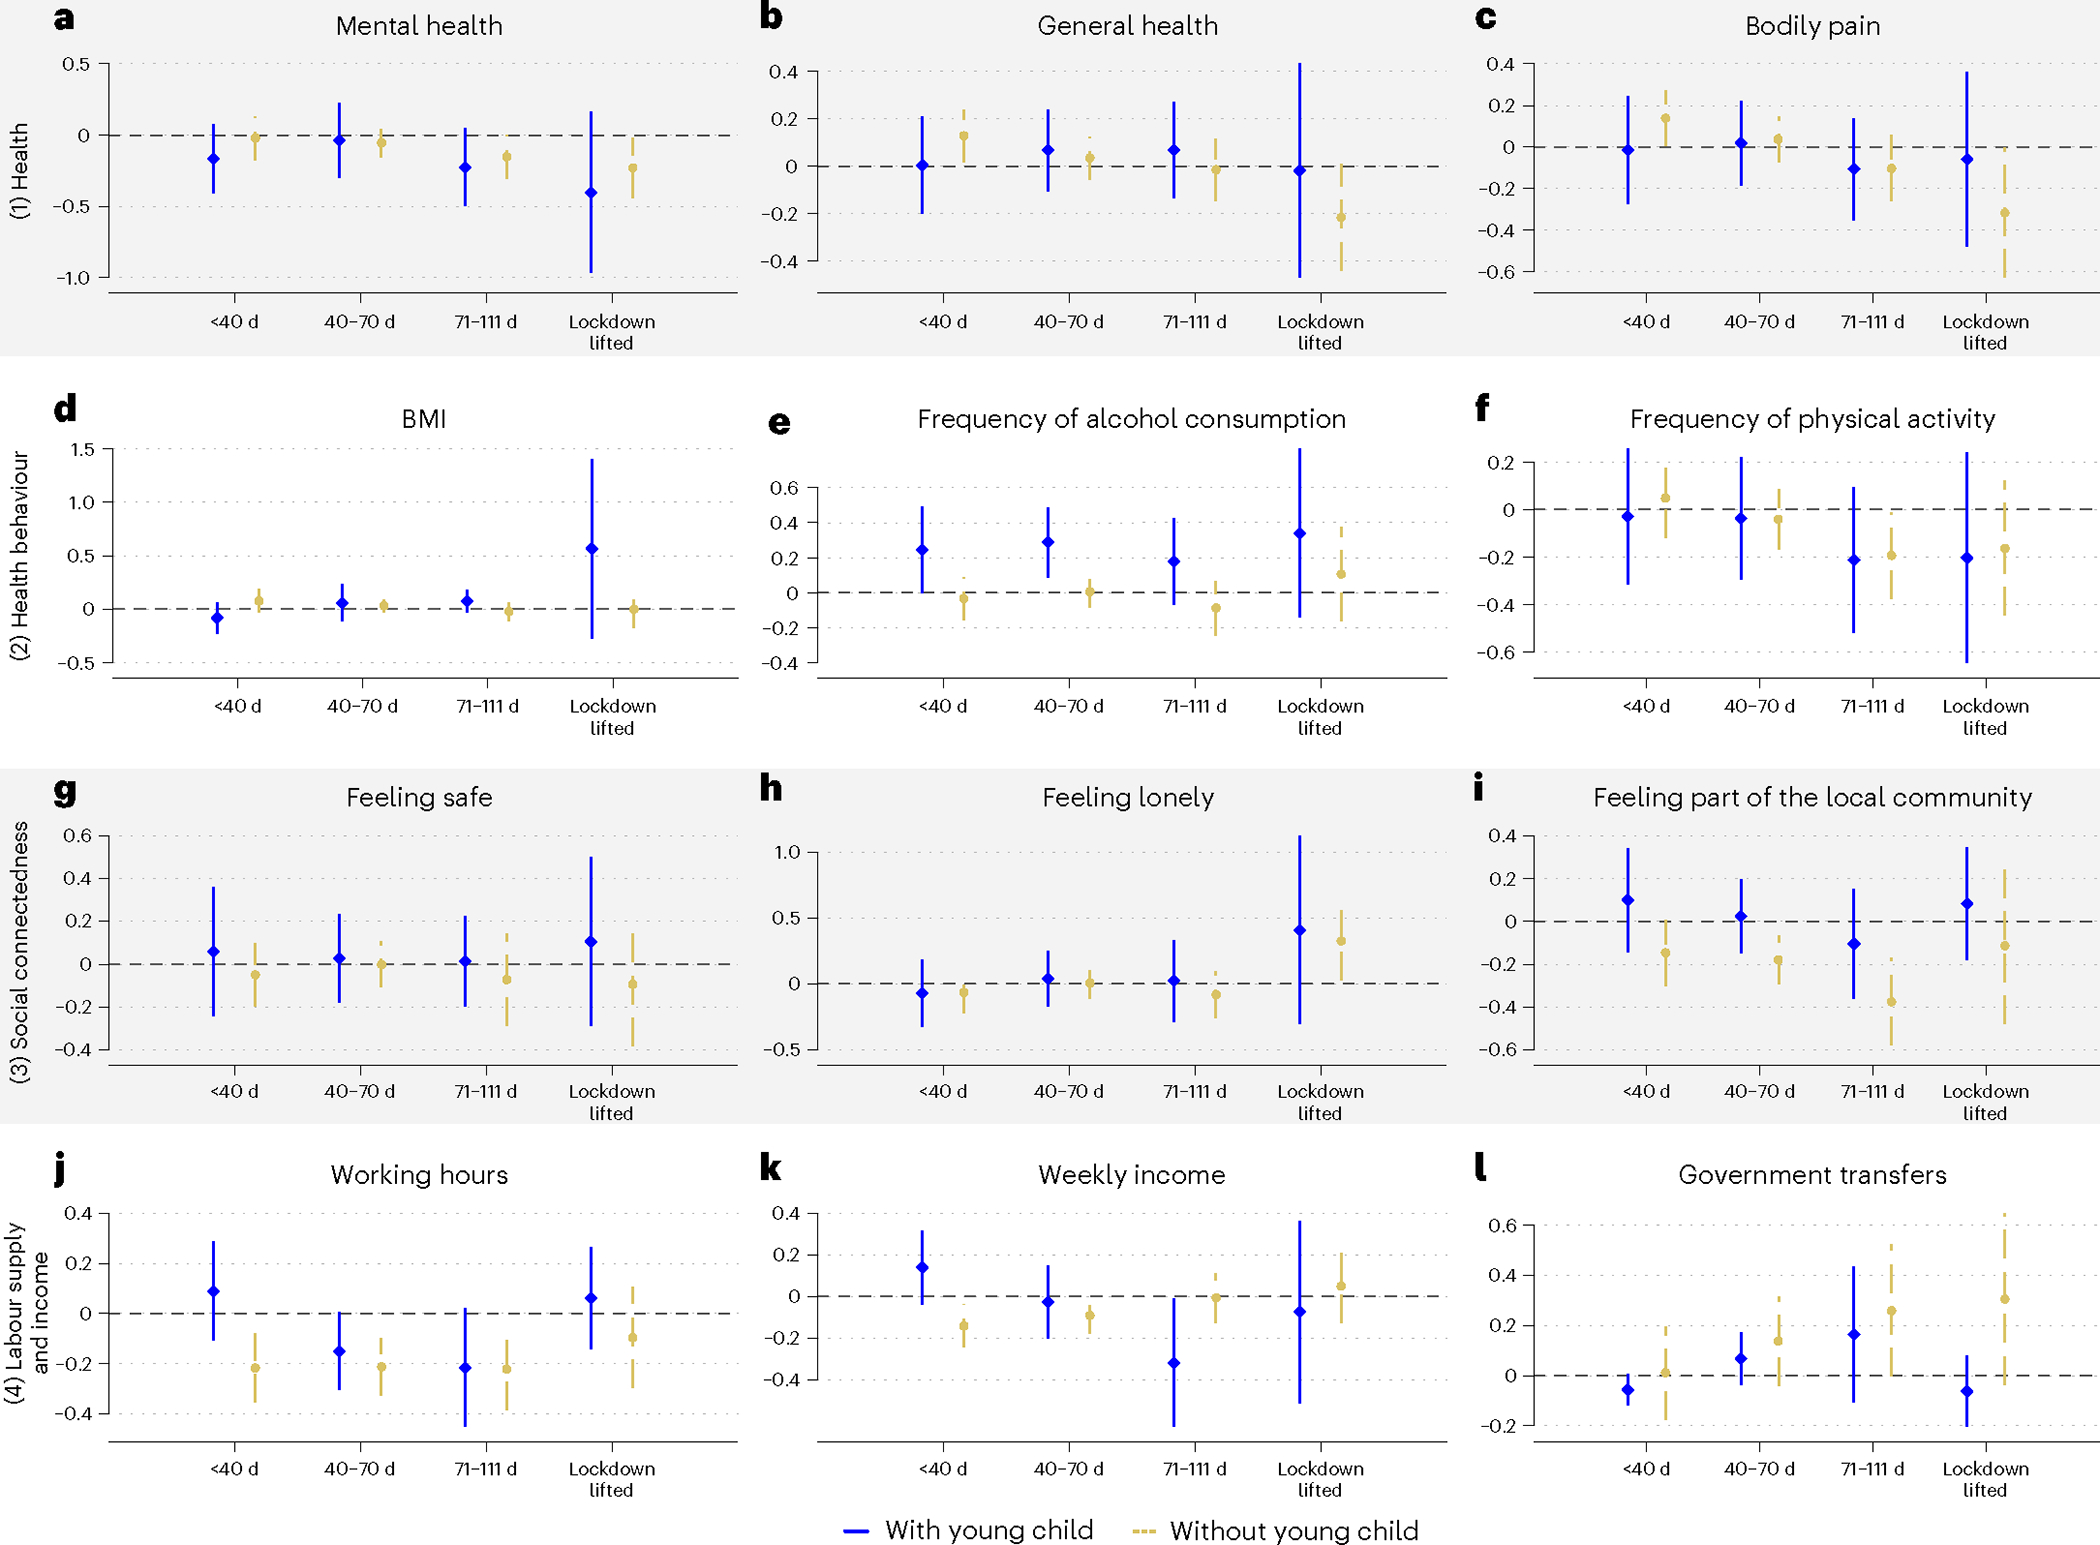
Lockdown was used worldwide to mitigate the spread of severe acute respiratory syndrome coronavirus 2 and was the cornerstone non-pharmaceutical intervention of zero-COVID strategies. Many previous impact evaluations of lockdowns are unreliable because lockdowns co-occurred with severe coronavirus disease related health and financial insecurities. This was not the case in Melbourne's 111-day lockdown, which left other Australian jurisdictions unaffected. Interrogating nationally representative longitudinal survey data and quasi-experimental variation, and controlling for multiple hypothesis testing, we found that lockdown had some statistically significant, albeit small, impacts on several domains of human life. Women had lower mental health (-0.10 s.d., P = 0.043, 95% confidence interval (CI) = -0.21 to -0) and working hours (-0.13 s.d., P = 0.006, 95% CI = -0.22 to -0.04) but exercised more often (0.28 s.d., P < 0.001, 95% CI = 0.18 to 0.39) and received more government transfers (0.12 s.d., P = 0.048, 95% CI = 0.001 to 0.24). Men felt less part of their community (-0.20 s.d., P < 0.001, 95% CI = -0.30 to -0.10) and reduced working hours (-0.12 s.d., P = 0.004, 95% CI = -0.20 to -0.04). Heterogeneity analyses demonstrated that families with children were driving the negative results. Mothers had lower mental health (-0.27 s.d., P = 0.014, 95% CI = -0.48 to -0.06), despite feeling safer (0.26 s.d., P = 0.008, 95% CI = 0.07 to 0.46). Fathers increased their alcohol consumption (0.35 s.d., P = 0.002, 95% CI = 0.13 to 0.57). Some outcomes worsened with lockdown length for mothers. We discuss potential explanations for why parents were adversely affected by lockdown.
© 2023. The Author(s), under exclusive licence to Springer Nature Limited.
Conflict of interest statement
Competing interests
The authors declare no competing interests.
Figures


Similar articles
-
Comparing HIV Post-Exposure Prophylaxis, Testing, and New Diagnoses in Two Australian Cities with Different Lockdown Measures during the COVID-19 Pandemic.Int J Environ Res Public Health. 2021 Oct 14;18(20):10814. doi: 10.3390/ijerph182010814. Int J Environ Res Public Health. 2021. PMID: 34682556 Free PMC article.
-
The longitudinal effect of COVID-19 infections and lockdown on mental health and the protective effect of neighbourhood social relations.Soc Sci Med. 2022 Mar;297:114821. doi: 10.1016/j.socscimed.2022.114821. Epub 2022 Feb 16. Soc Sci Med. 2022. PMID: 35219050 Free PMC article.
-
Mental health of pregnant women during the SARS-CoV-2 pandemic in France: Evolution of self-perceived psychological state during the first lockdown, and anxiety frequency two months after the lockdown ended.PLoS One. 2023 Apr 20;18(4):e0272108. doi: 10.1371/journal.pone.0272108. eCollection 2023. PLoS One. 2023. PMID: 37079562 Free PMC article.
-
The psychological impact of COVID-19 pandemic lockdowns: a review and meta-analysis of longitudinal studies and natural experiments.Psychol Med. 2021 Jan;51(2):201-211. doi: 10.1017/S0033291721000015. Epub 2021 Jan 13. Psychol Med. 2021. PMID: 33436130 Free PMC article. Review.
-
COVID-19 pandemic: A review of the global lockdown and its far-reaching effects.Sci Prog. 2021 Apr-Jun;104(2):368504211019854. doi: 10.1177/00368504211019854. Sci Prog. 2021. PMID: 34061685 Free PMC article. Review.
Cited by
-
The invisible burden of managing COVID-19 for Australian women: Cognitive labor and public health information.Front Public Health. 2023 Feb 1;11:1041944. doi: 10.3389/fpubh.2023.1041944. eCollection 2023. Front Public Health. 2023. PMID: 36817933 Free PMC article.
-
What happened to the predicted COVID-19-induced suicide epidemic, and why?Aust N Z J Psychiatry. 2023 Jan;57(1):11-16. doi: 10.1177/00048674221131500. Epub 2022 Oct 16. Aust N Z J Psychiatry. 2023. PMID: 36250480 Free PMC article.
References
-
- Haug N et al. Ranking the effectiveness of worldwide COVID-19 government interventions. Nat. Hum. Behav. 4, 1303–1312 (2020). - PubMed
-
- Sandford A Coronavirus: half of humanity now on lockdown as 90 countries call for confinement. Euronews https://www.euronews.com/2020/04/02/coronavirus-in-europe-spain-s-death-... (02 April 2020).
-
- Flaxman S et al. Estimating the effects of non-pharmaceutical interventions on COVID-19 in Europe. Nature 584, 257–261 (2020). - PubMed
MeSH terms
Grants and funding
LinkOut - more resources
Full Text Sources
Medical
