

Evidence of correlations between human partners based on systematic reviews and meta-analyses of 22 traits and UK Biobank analysis of 133 traits
- PMID: 37653148
- PMCID: PMC10967253
- DOI: 10.1038/s41562-023-01672-z
Evidence of correlations between human partners based on systematic reviews and meta-analyses of 22 traits and UK Biobank analysis of 133 traits
Abstract
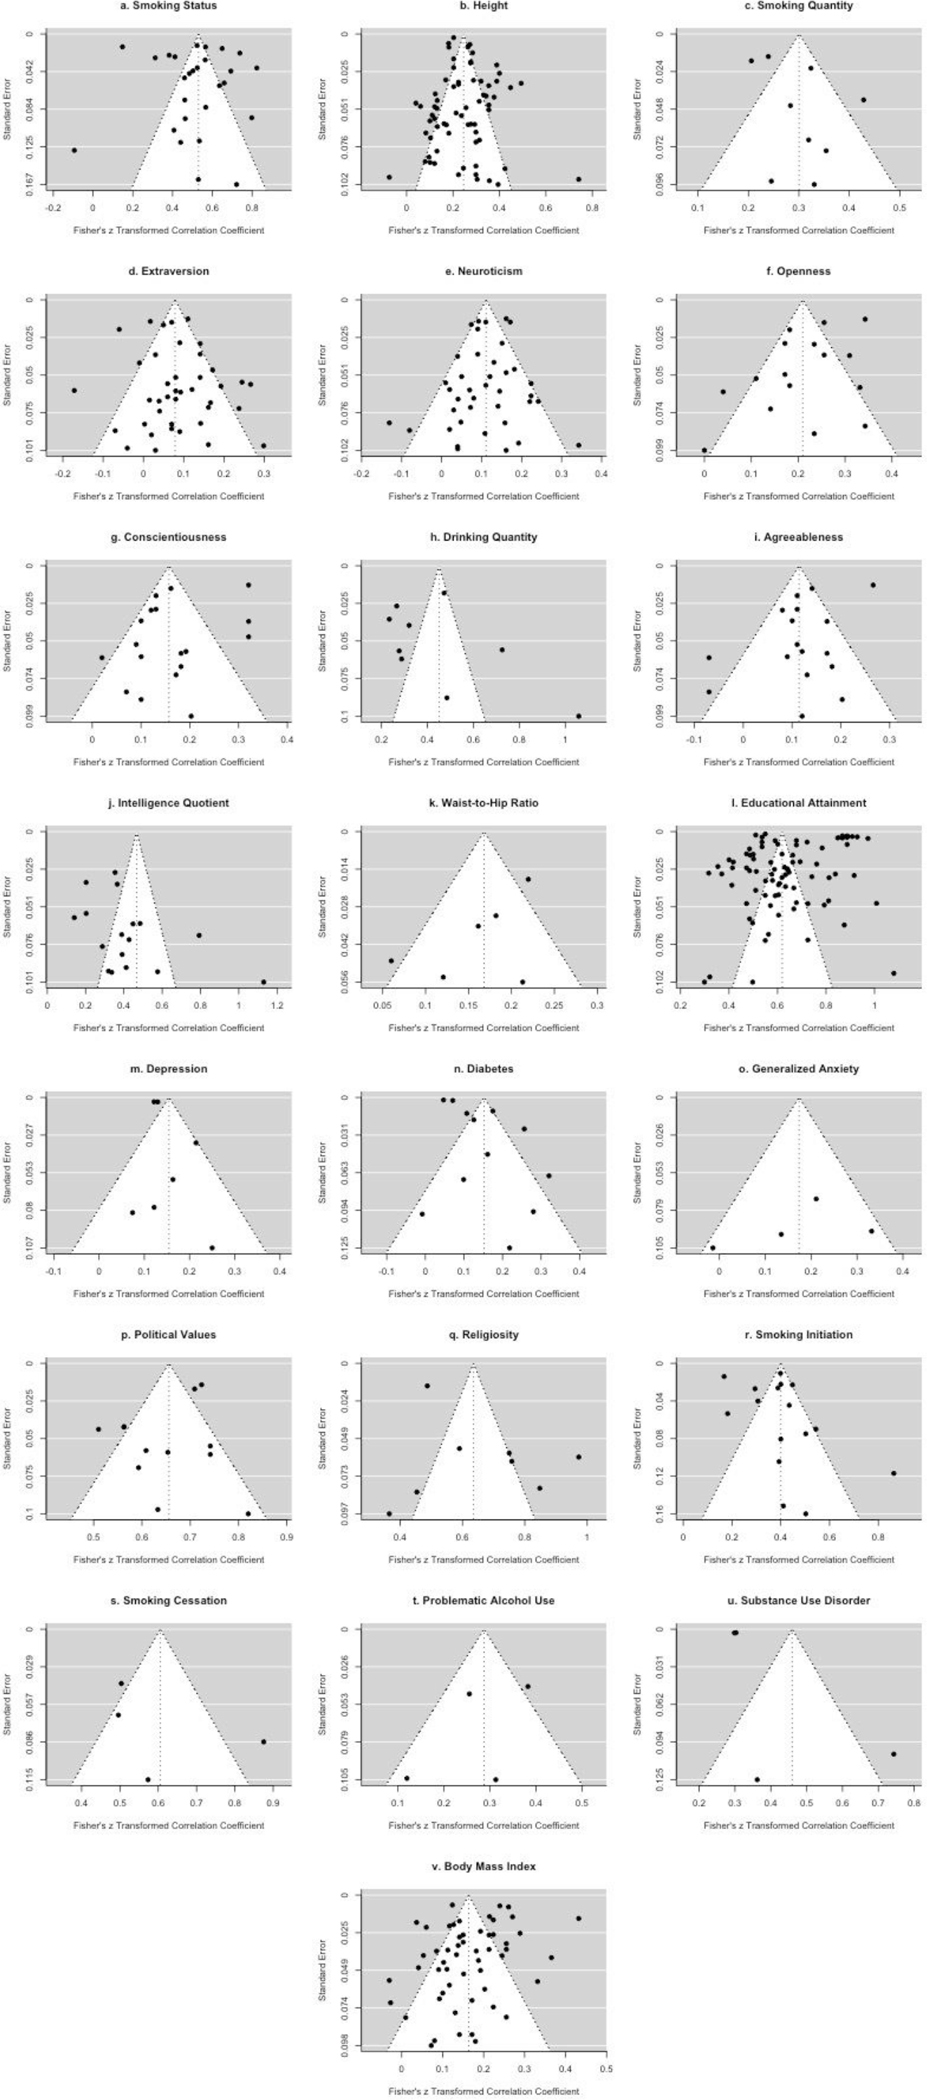
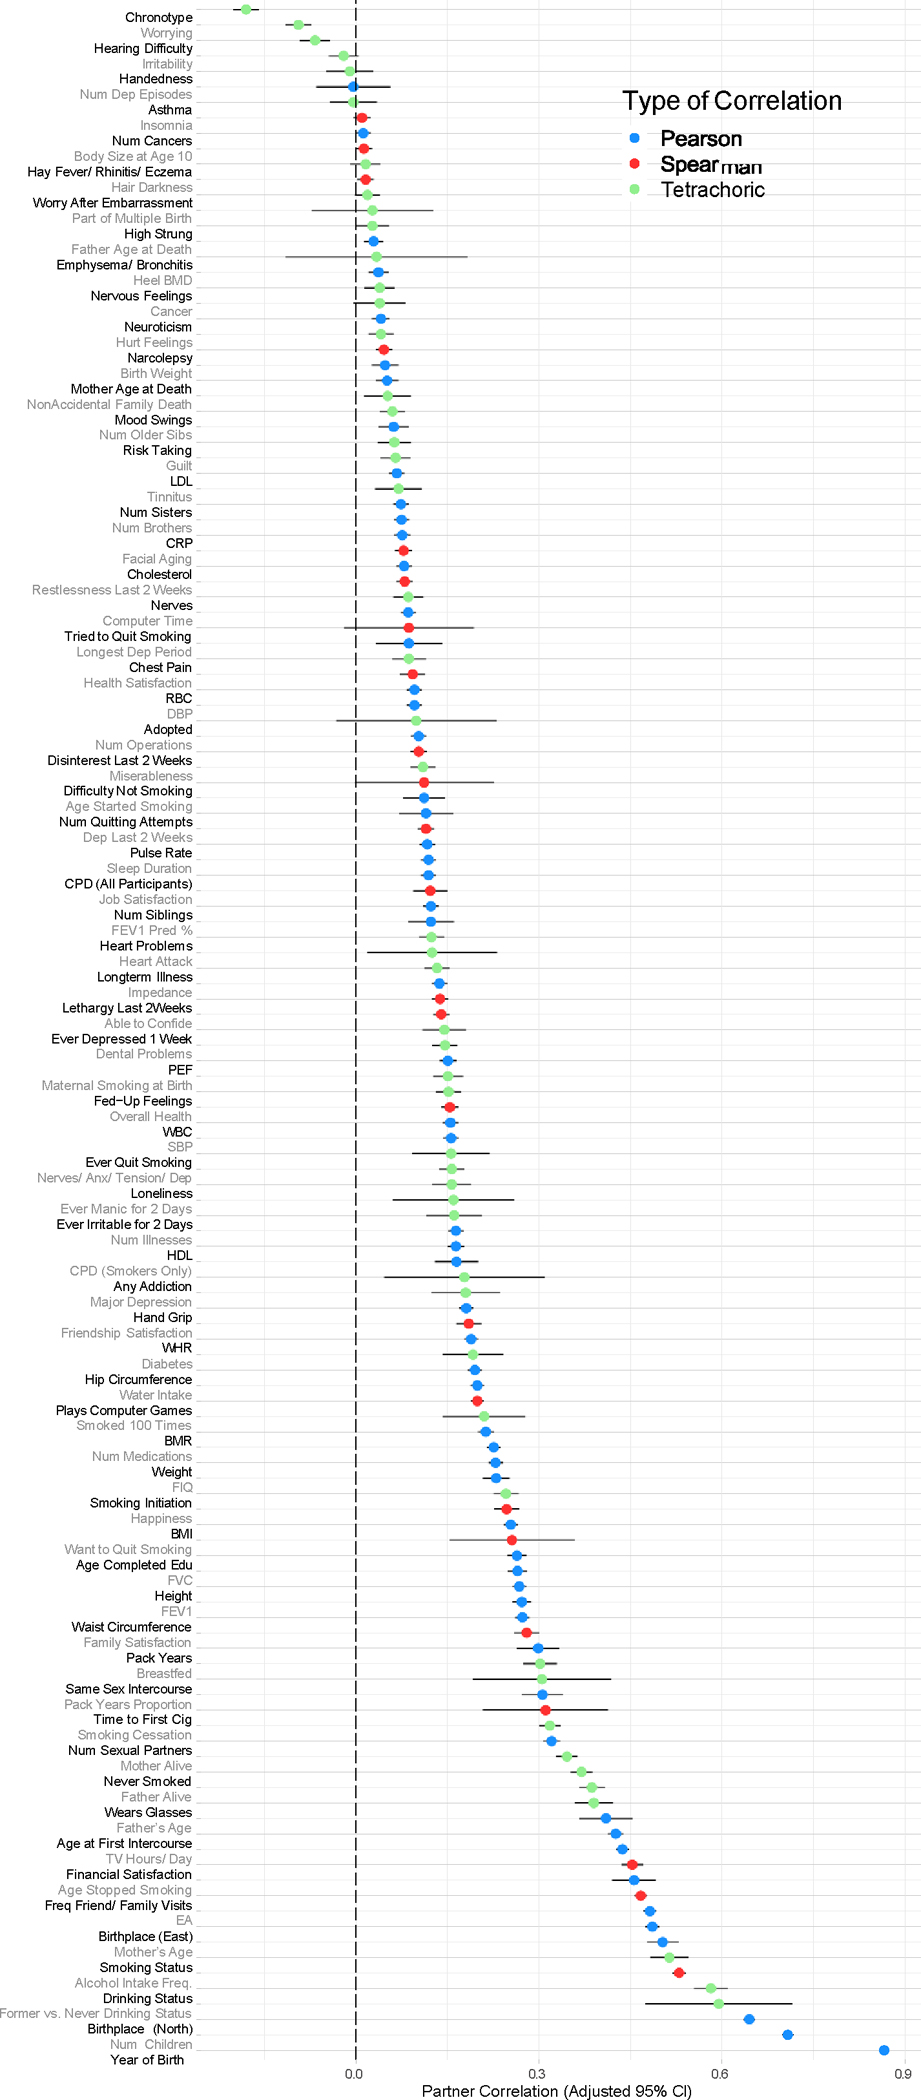
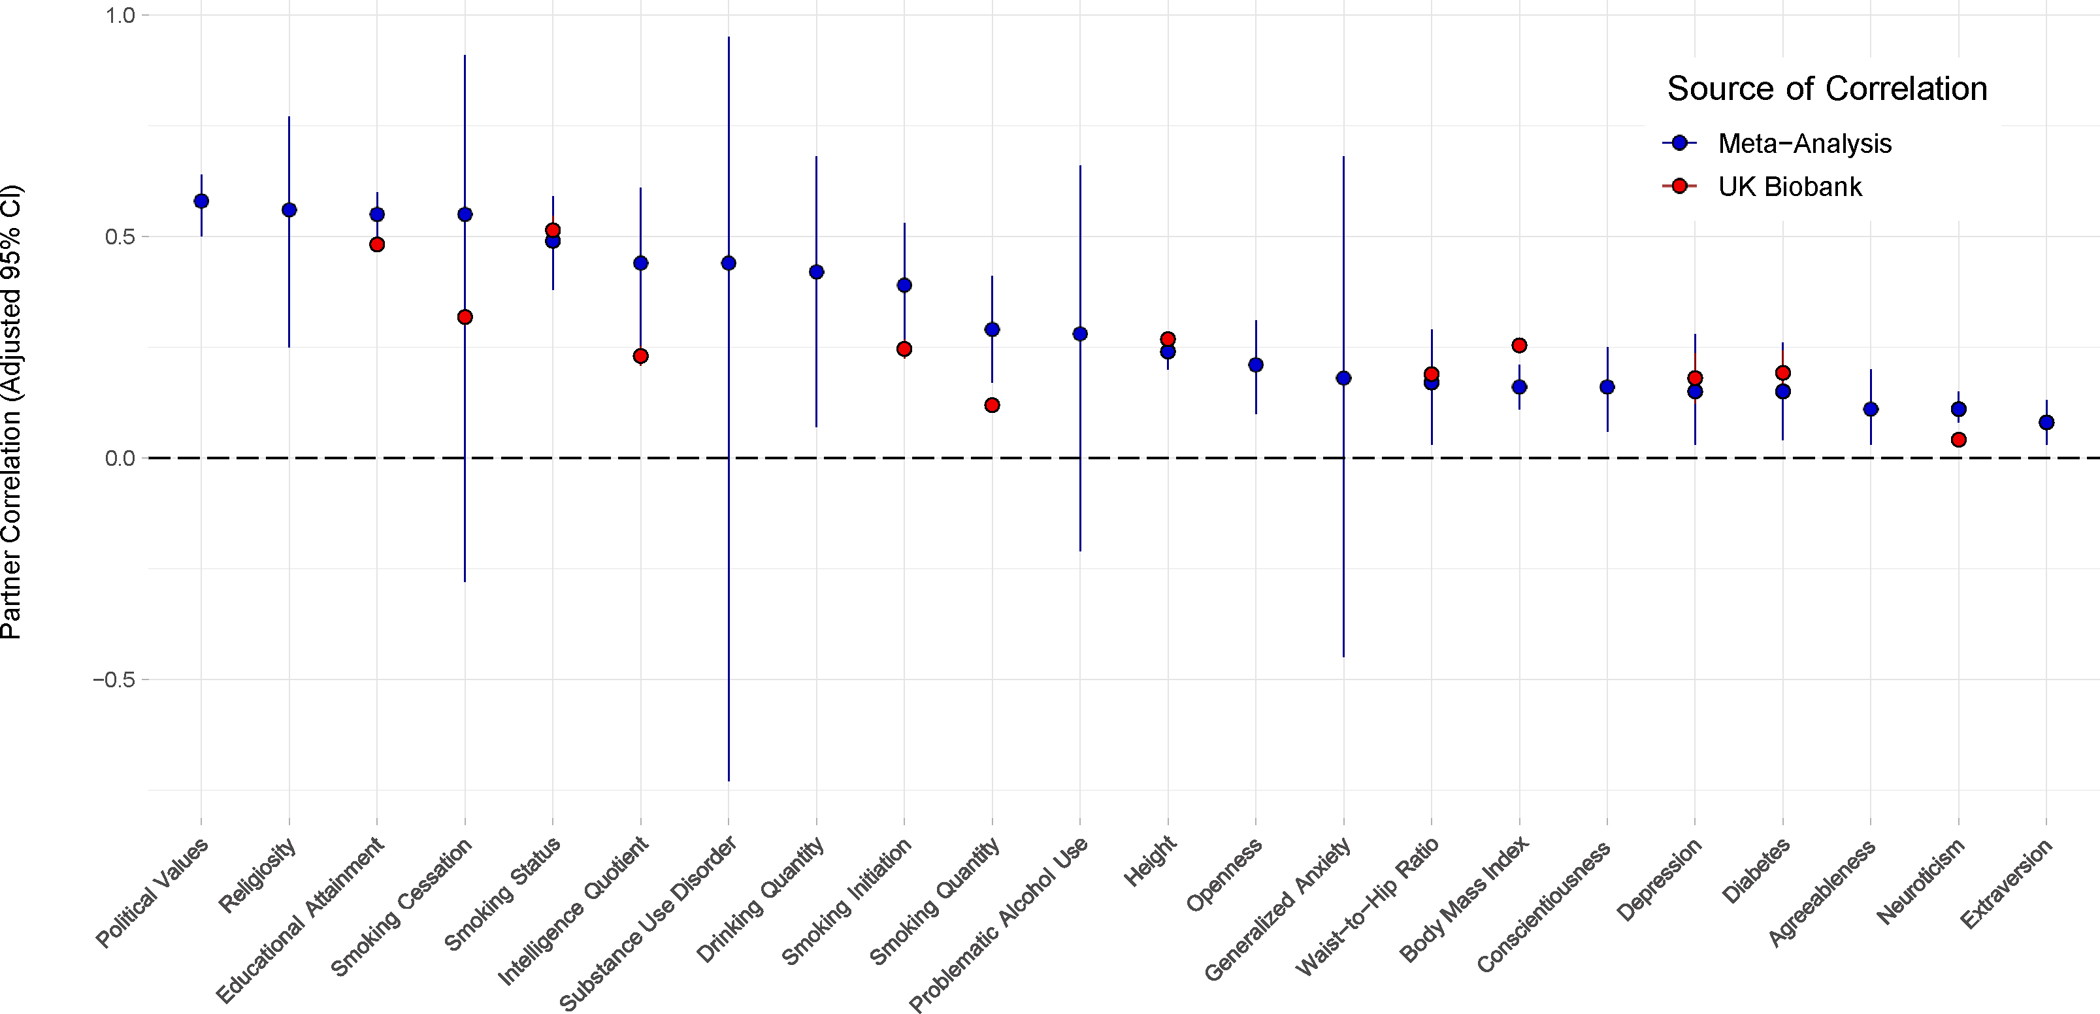
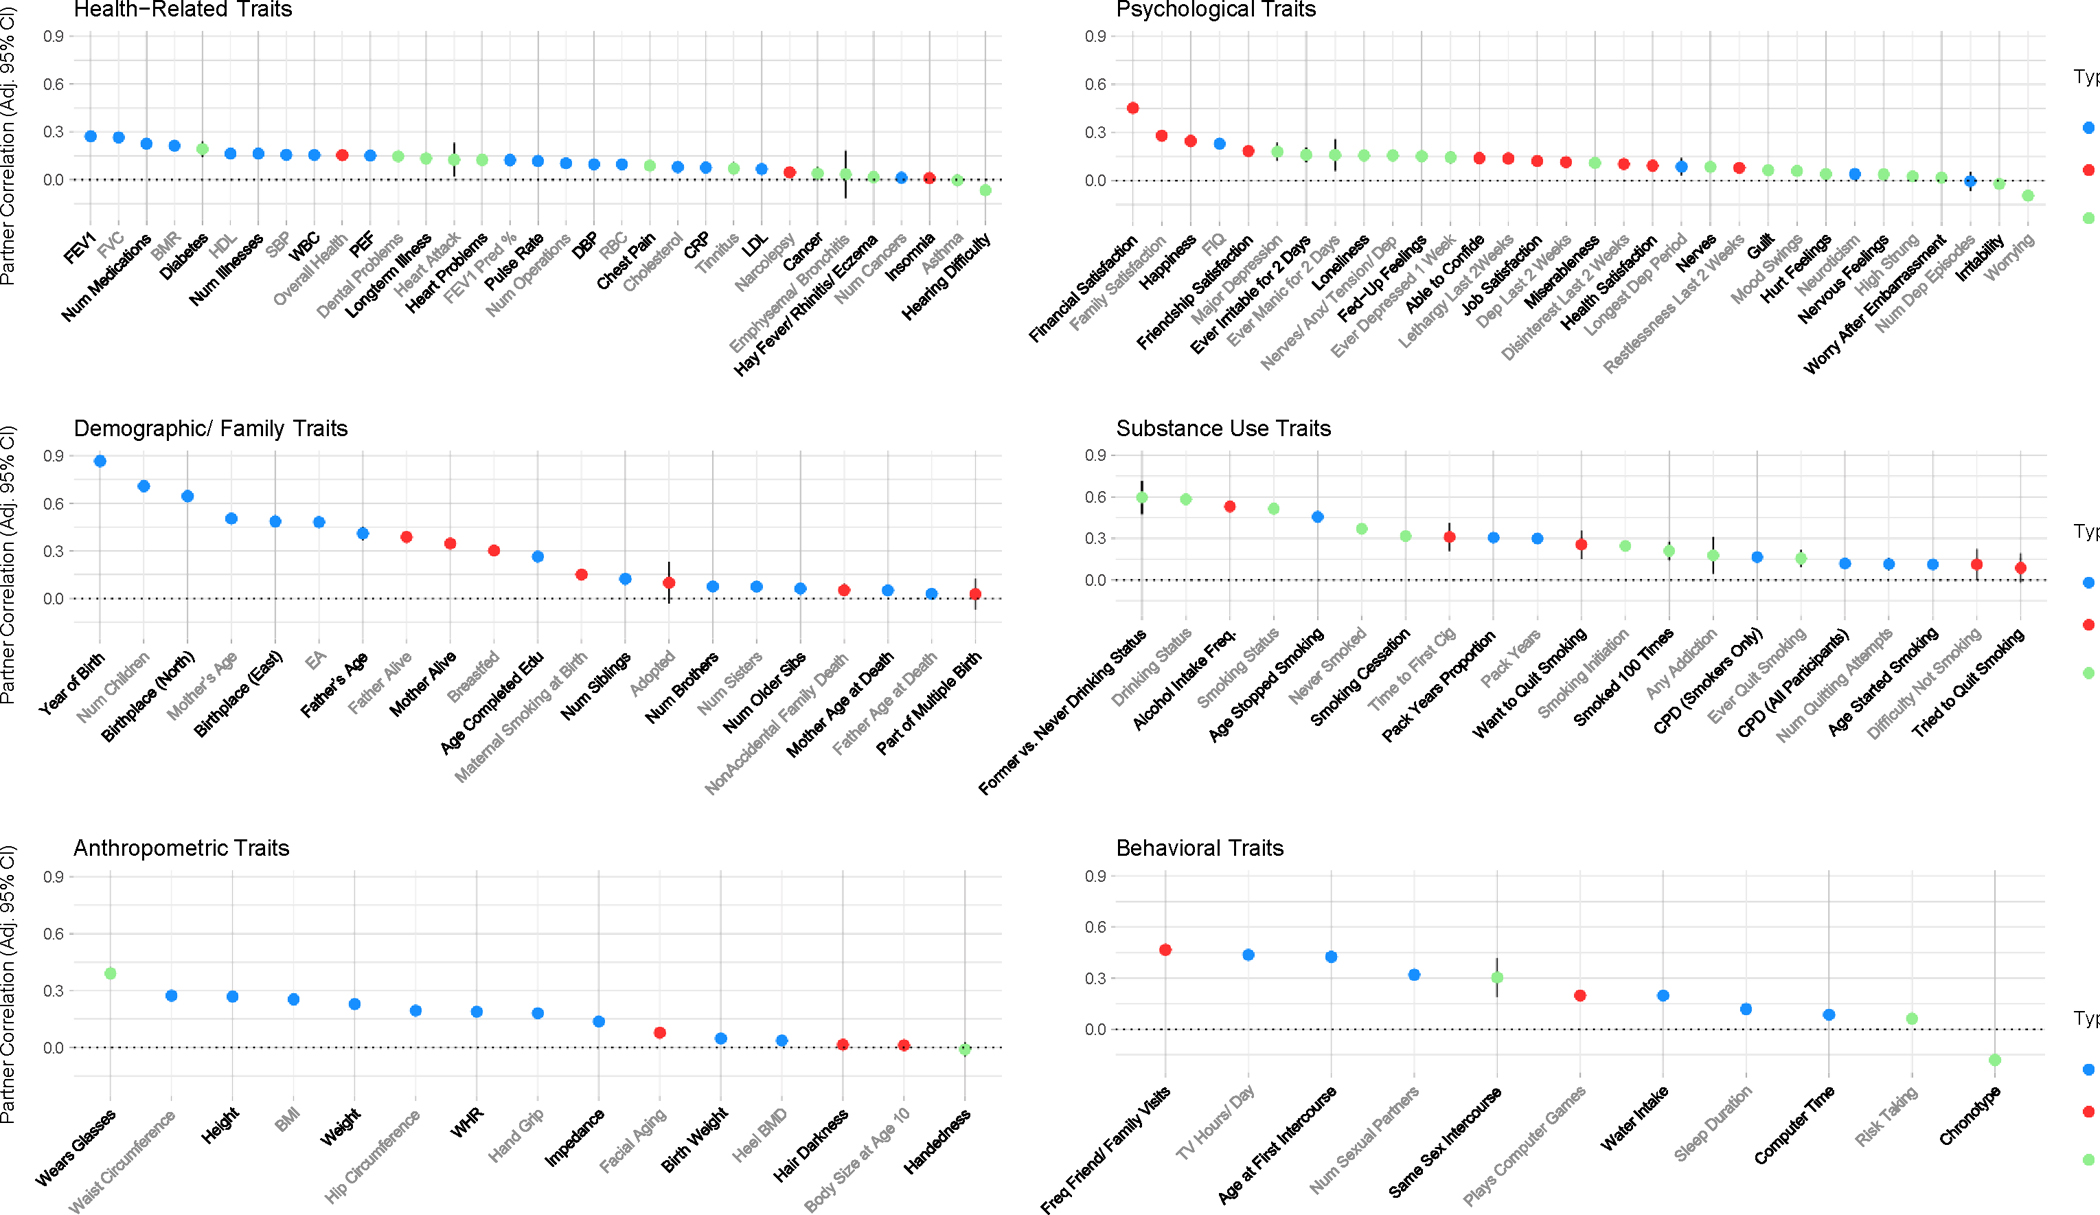
Positive correlations between mates can increase trait variation and prevalence, as well as bias estimates from genetically informed study designs. While past studies of similarity between human mating partners have largely found evidence of positive correlations, to our knowledge, no formal meta-analysis has examined human partner correlations across multiple categories of traits. Thus, we conducted systematic reviews and random-effects meta-analyses of human male-female partner correlations across 22 traits commonly studied by psychologists, economists, sociologists, anthropologists, epidemiologists and geneticists. Using ScienceDirect, PubMed and Google Scholar, we incorporated 480 partner correlations from 199 peer-reviewed studies of co-parents, engaged pairs, married pairs and/or cohabitating pairs that were published on or before 16 August 2022. We also calculated 133 trait correlations using up to 79,074 male-female couples in the UK Biobank (UKB). Estimates of the 22 mean meta-analysed correlations ranged from rmeta = 0.08 (adjusted 95% CI = 0.03, 0.13) for extraversion to rmeta = 0.58 (adjusted 95% CI = 0.50, 0.64) for political values, with funnel plots showing little evidence of publication bias across traits. The 133 UKB correlations ranged from rUKB = -0.18 (adjusted 95% CI = -0.20, -0.16) for chronotype (being a 'morning' or 'evening' person) to rUKB = 0.87 (adjusted 95% CI = 0.86, 0.87) for birth year. Across analyses, political and religious attitudes, educational attainment and some substance use traits showed the highest correlations, while psychological (that is, psychiatric/personality) and anthropometric traits generally yielded lower but positive correlations. We observed high levels of between-sample heterogeneity for most meta-analysed traits, probably because of both systematic differences between samples and true differences in partner correlations across populations.
© 2023. The Author(s), under exclusive licence to Springer Nature Limited.
Conflict of interest statement
Competing Interests Statement
The authors declare no competing interests.
Figures
Similar articles
-
Recovery schools for improving behavioral and academic outcomes among students in recovery from substance use disorders: a systematic review.Campbell Syst Rev. 2018 Oct 4;14(1):1-86. doi: 10.4073/csr.2018.9. eCollection 2018. Campbell Syst Rev. 2018. PMID: 37131375 Free PMC article.
-
Deployment of personnel to military operations: impact on mental health and social functioning.Campbell Syst Rev. 2018 Jun 1;14(1):1-127. doi: 10.4073/csr.2018.6. eCollection 2018. Campbell Syst Rev. 2018. PMID: 37131363 Free PMC article.
-
Behavioural modification interventions for medically unexplained symptoms in primary care: systematic reviews and economic evaluation.Health Technol Assess. 2020 Sep;24(46):1-490. doi: 10.3310/hta24460. Health Technol Assess. 2020. PMID: 32975190 Free PMC article.
-
Partner choice, confounding and trait convergence all contribute to phenotypic partner similarity.Nat Hum Behav. 2023 May;7(5):776-789. doi: 10.1038/s41562-022-01500-w. Epub 2023 Mar 16. Nat Hum Behav. 2023. PMID: 36928782 Free PMC article.
-
Gender differences in chronotype diminish with age: a meta-analysis based on morningness/chronotype questionnaires.Chronobiol Int. 2019 Jul;36(7):888-905. doi: 10.1080/07420528.2019.1585867. Epub 2019 May 9. Chronobiol Int. 2019. PMID: 31070061
Cited by
-
Genetic basis of partner choice.bioRxiv [Preprint]. 2025 Feb 5:2025.02.03.636375. doi: 10.1101/2025.02.03.636375. bioRxiv. 2025. PMID: 39975039 Free PMC article. Preprint.
-
Evaluating causal associations of chronotype with pregnancy and perinatal outcomes and its interactions with insomnia and sleep duration: a mendelian randomization study.BMC Pregnancy Childbirth. 2024 Dec 18;24(1):816. doi: 10.1186/s12884-024-07023-8. BMC Pregnancy Childbirth. 2024. PMID: 39696061 Free PMC article.
-
Examining the role of common variants in rare neurodevelopmental conditions.Nature. 2024 Dec;636(8042):404-411. doi: 10.1038/s41586-024-08217-y. Epub 2024 Nov 20. Nature. 2024. PMID: 39567701 Free PMC article.
-
Intimate Partner Violence Against Women in Burkina Faso During COVID-19: A Cross-Sectional Study.Inquiry. 2025 Jan-Dec;62:469580251345386. doi: 10.1177/00469580251345386. Epub 2025 Jun 24. Inquiry. 2025. PMID: 40553128 Free PMC article.
-
Beyond additive genetic effects: Explaining family resemblance in school performance across millions of pairs of Norwegian relatives.Proc Natl Acad Sci U S A. 2025 Jun 24;122(25):e2419627122. doi: 10.1073/pnas.2419627122. Epub 2025 Jun 20. Proc Natl Acad Sci U S A. 2025. PMID: 40540601 Free PMC article.
References
-
- Fisher RA The Correlation between Relatives on the Supposition of Mendelian Inheritance. Earth Environ. Sci. Trans. R. Soc. Edinb. 52, 399–433 (1919).
-
- Kong A et al. The nature of nurture: Effects of parental genotypes. Science 359, 424–428 (2018). - PubMed
-
- Eaves L The use of twins in the analysis of assortative mating. Heredity 43, 399–409 (1979). - PubMed
-
- Lavryashina MB et al. Interethnic Dynamics among the Indigenous Peoples of Southern Siberia (Demographic Aspect)*. Archaeol. Ethnol. Anthropol. Eurasia 41, 131–142 (2013).
Publication types
MeSH terms
Grants and funding
LinkOut - more resources
Full Text Sources
Miscellaneous
