. 2023 Nov;19(11):1423-1431.
doi: 10.1038/s41589-023-01422-2. Epub 2023 Aug 31.

Motif-dependent binding on the intervening domain regulates O-GlcNAc transferase

Affiliations

Motif-dependent binding on the intervening domain regulates O-GlcNAc transferase

Connor M Blankenship et al. Nat Chem Biol. 2023 Nov.

Abstract

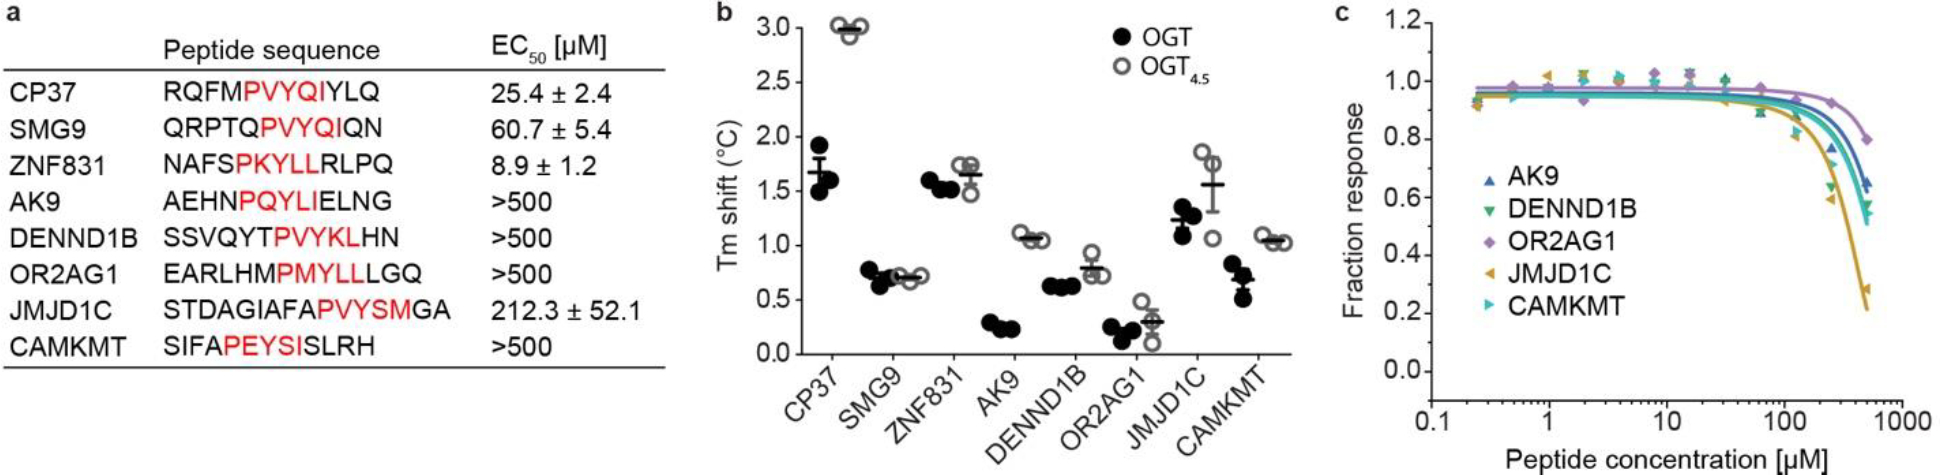
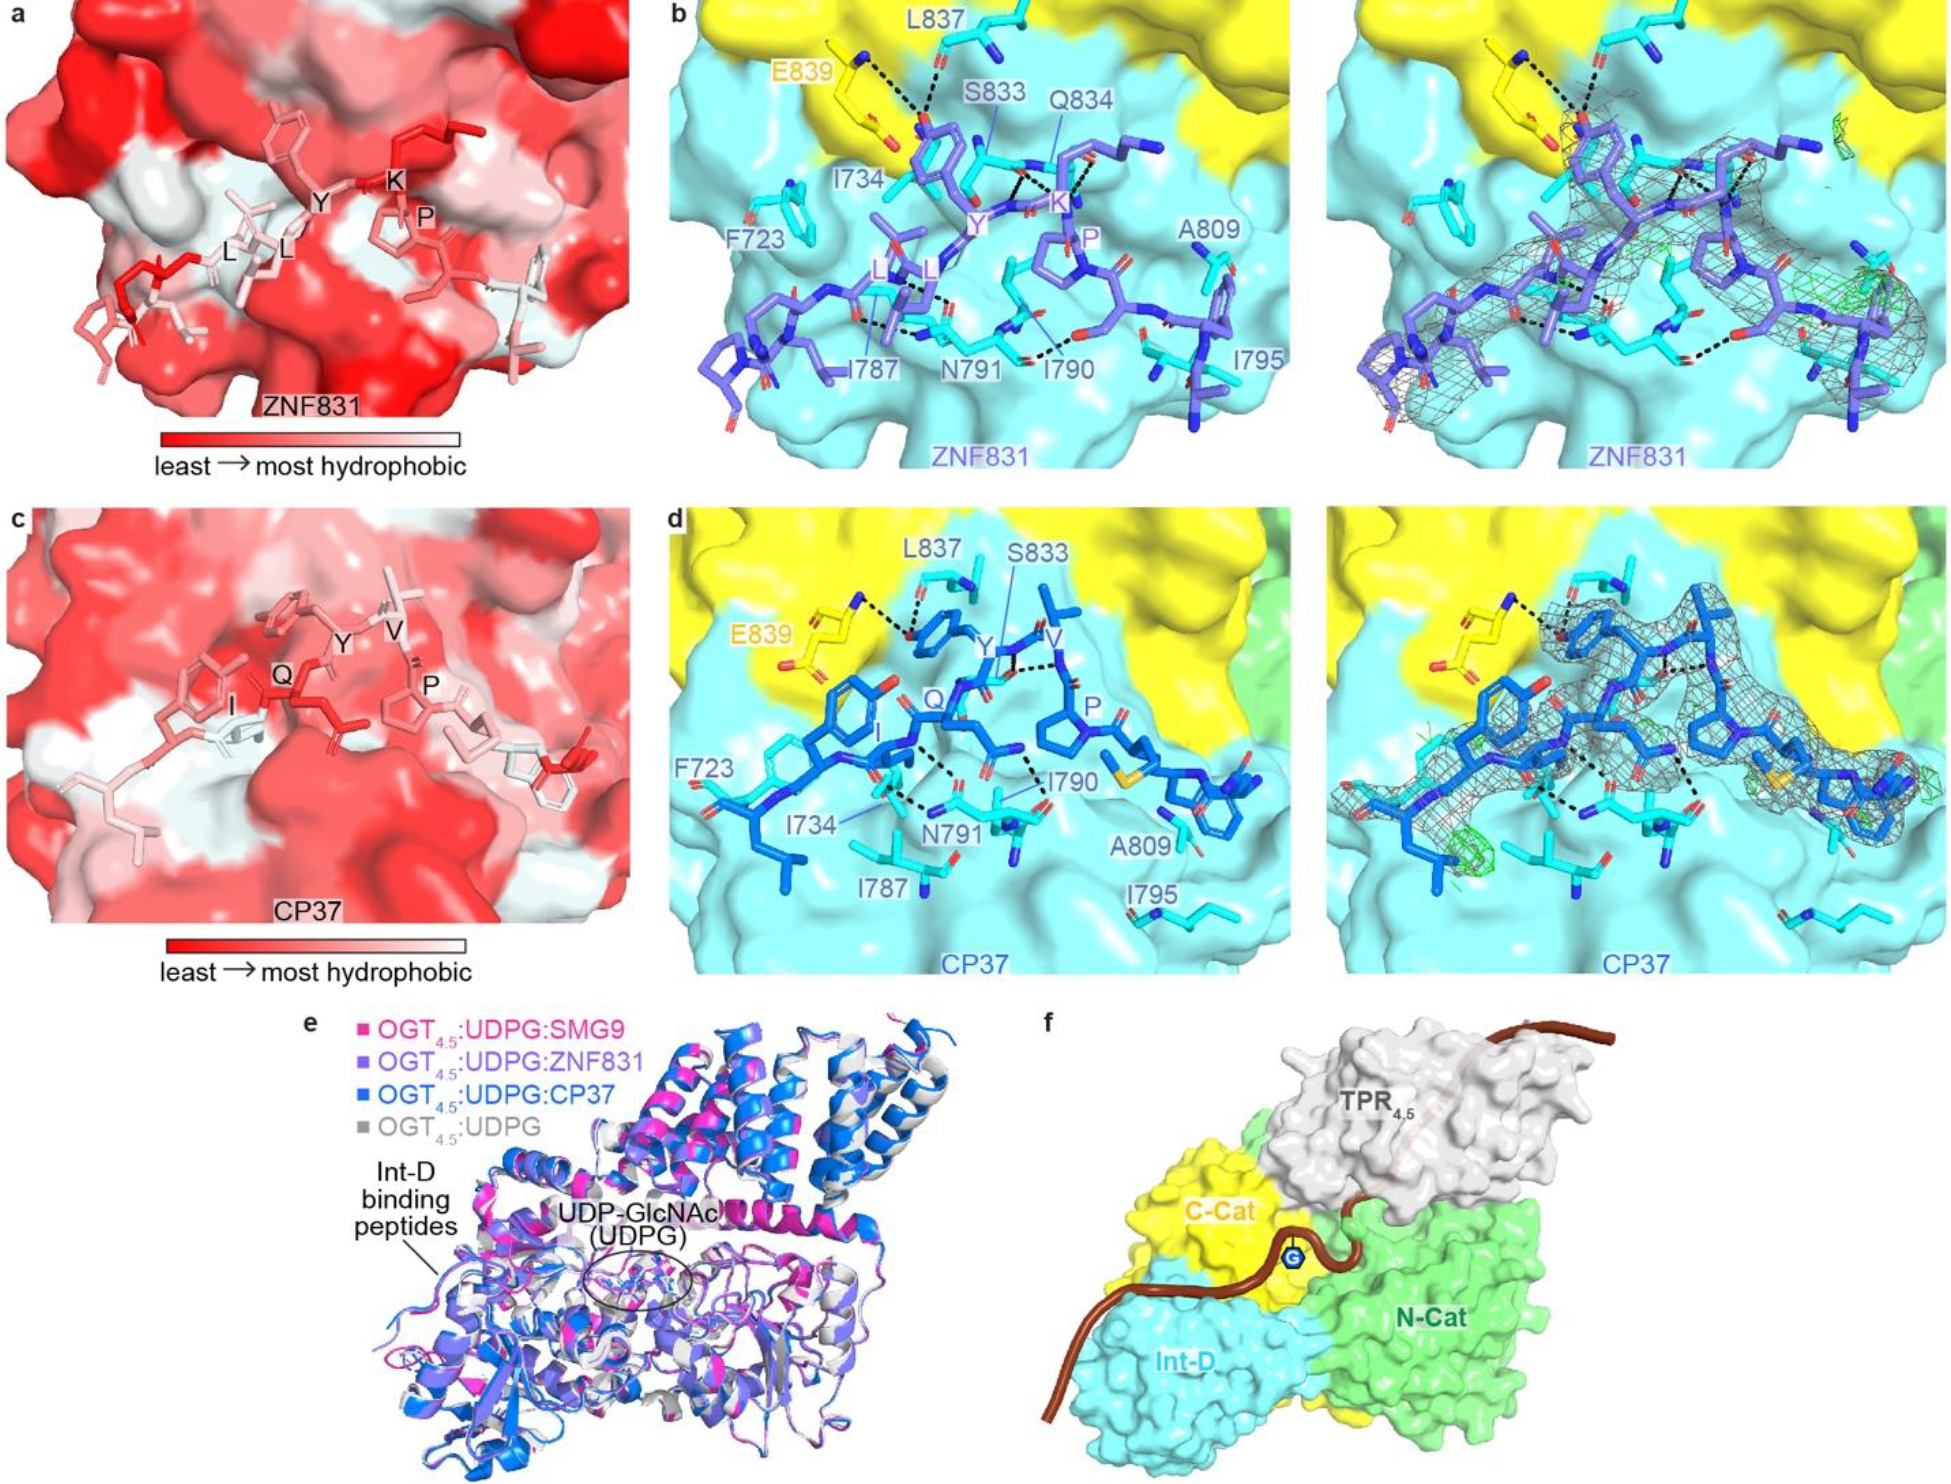
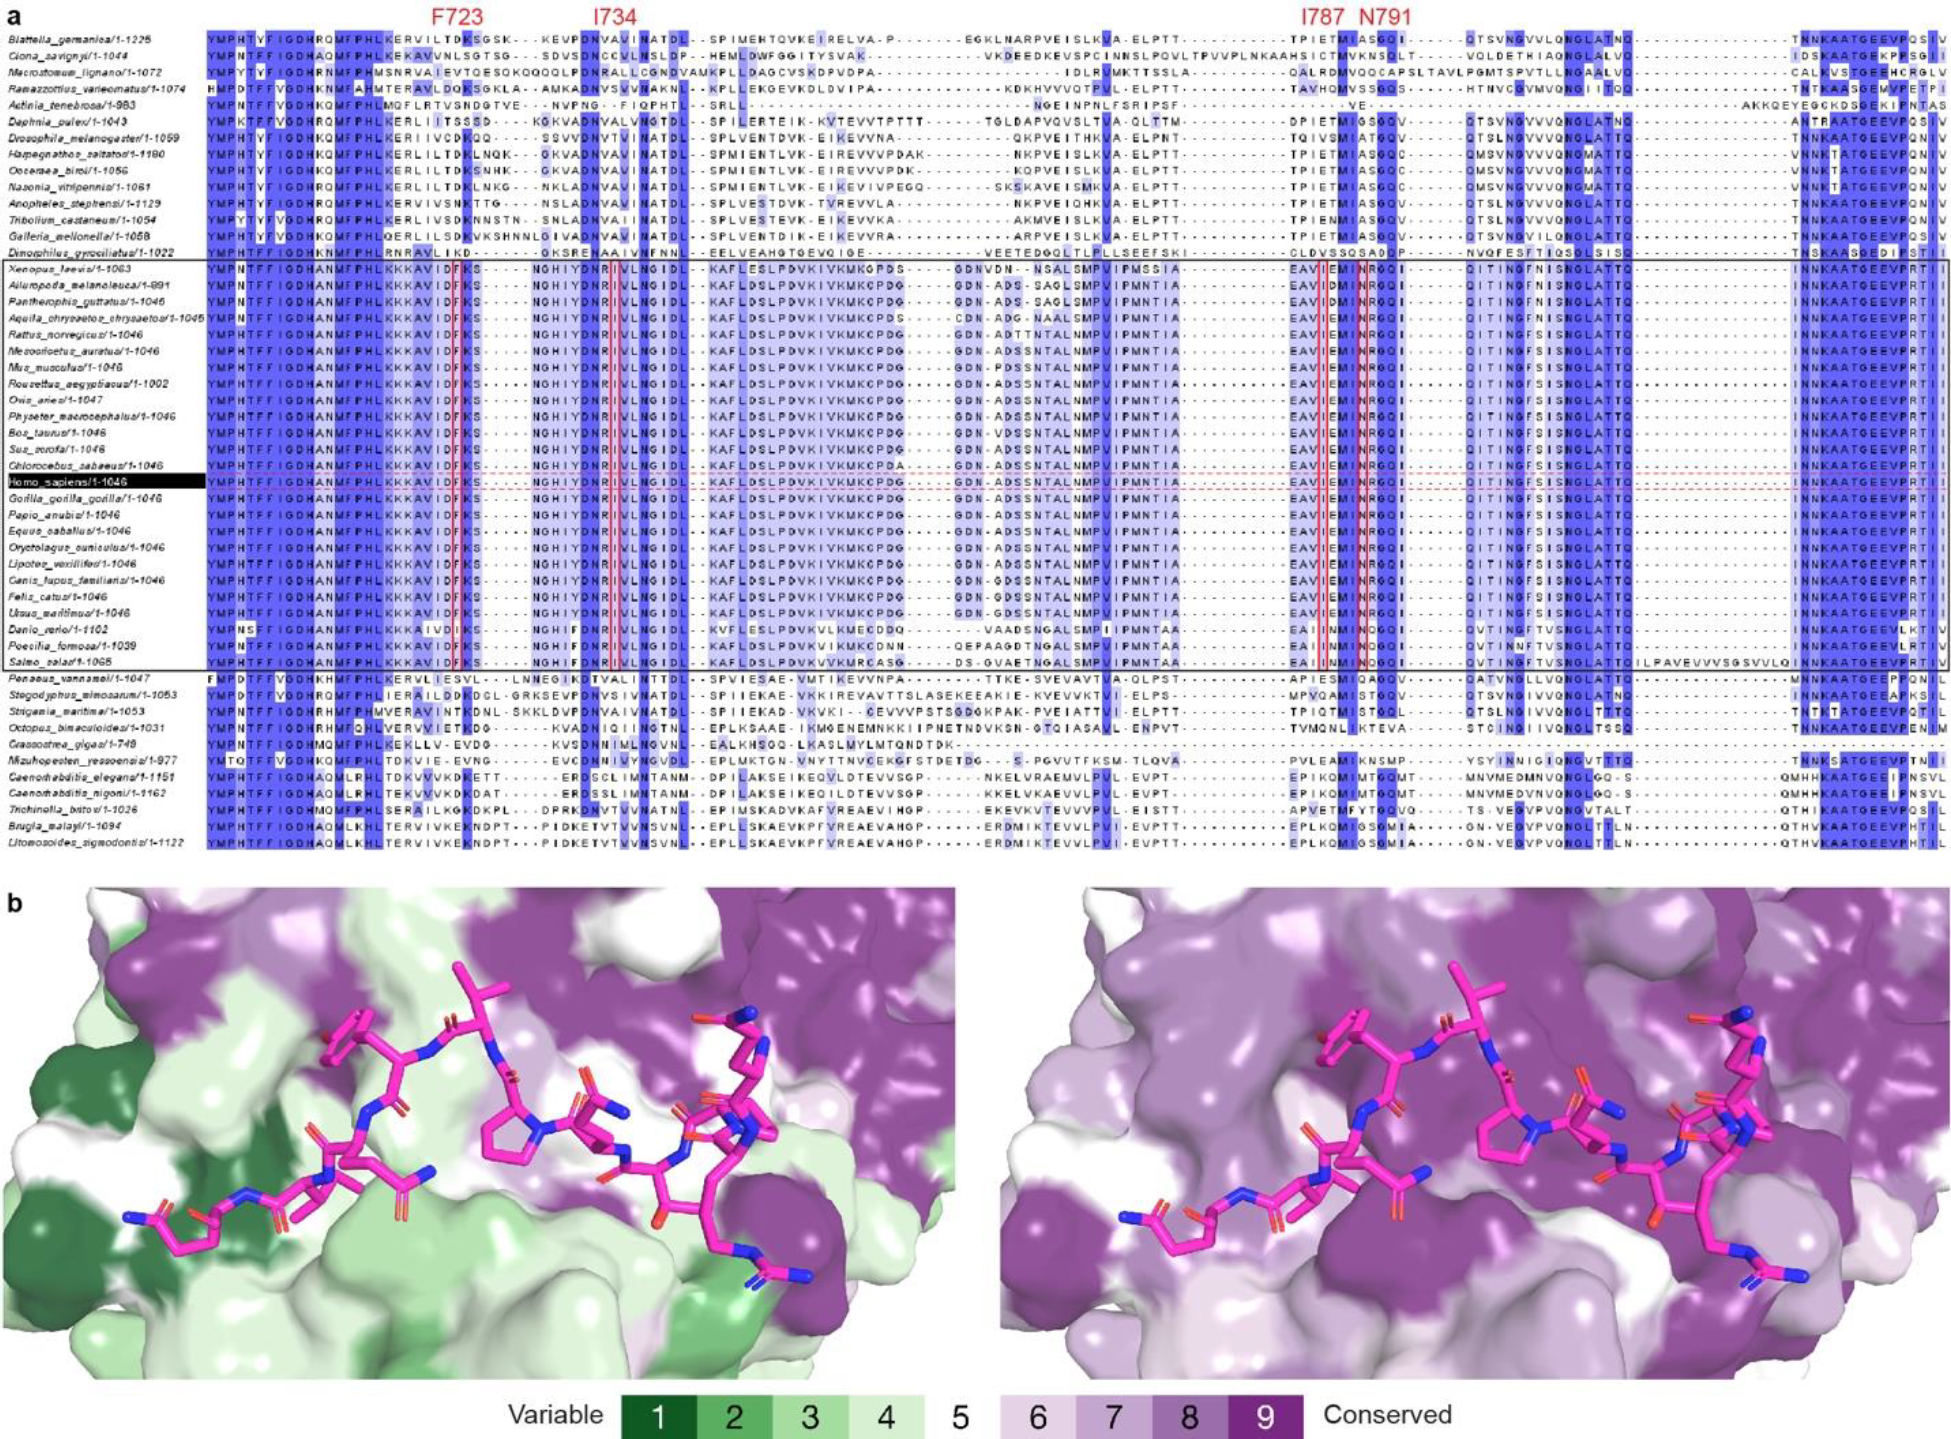
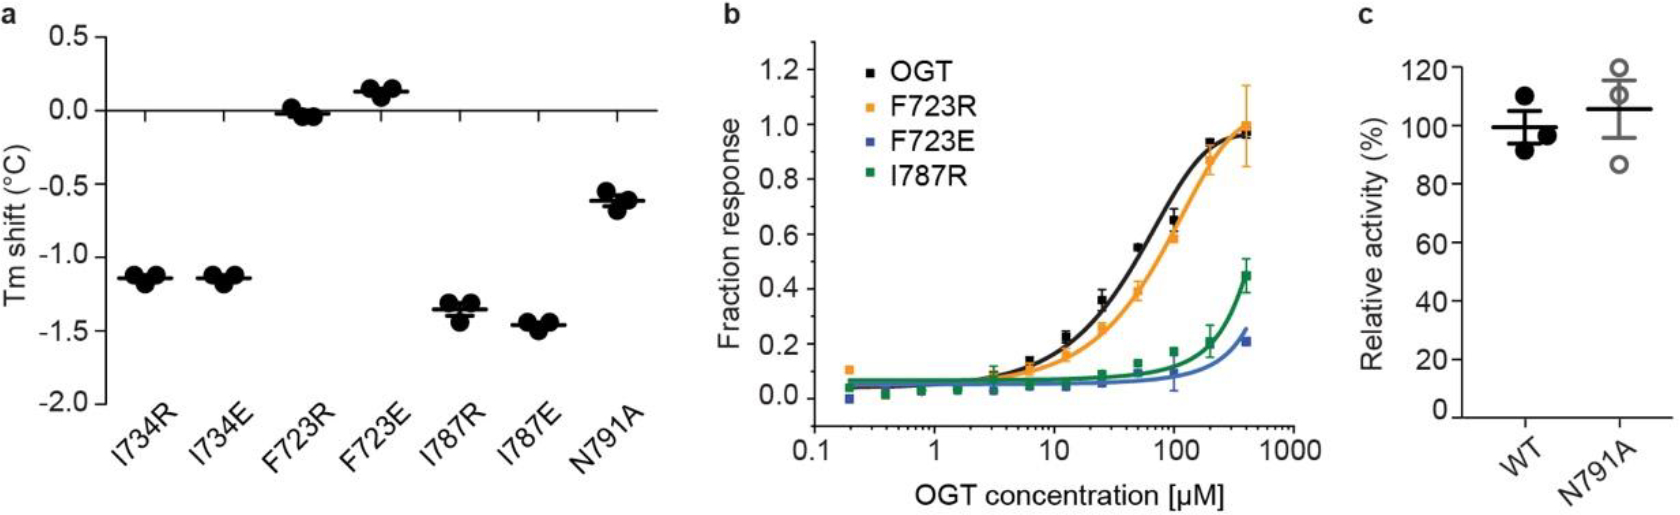
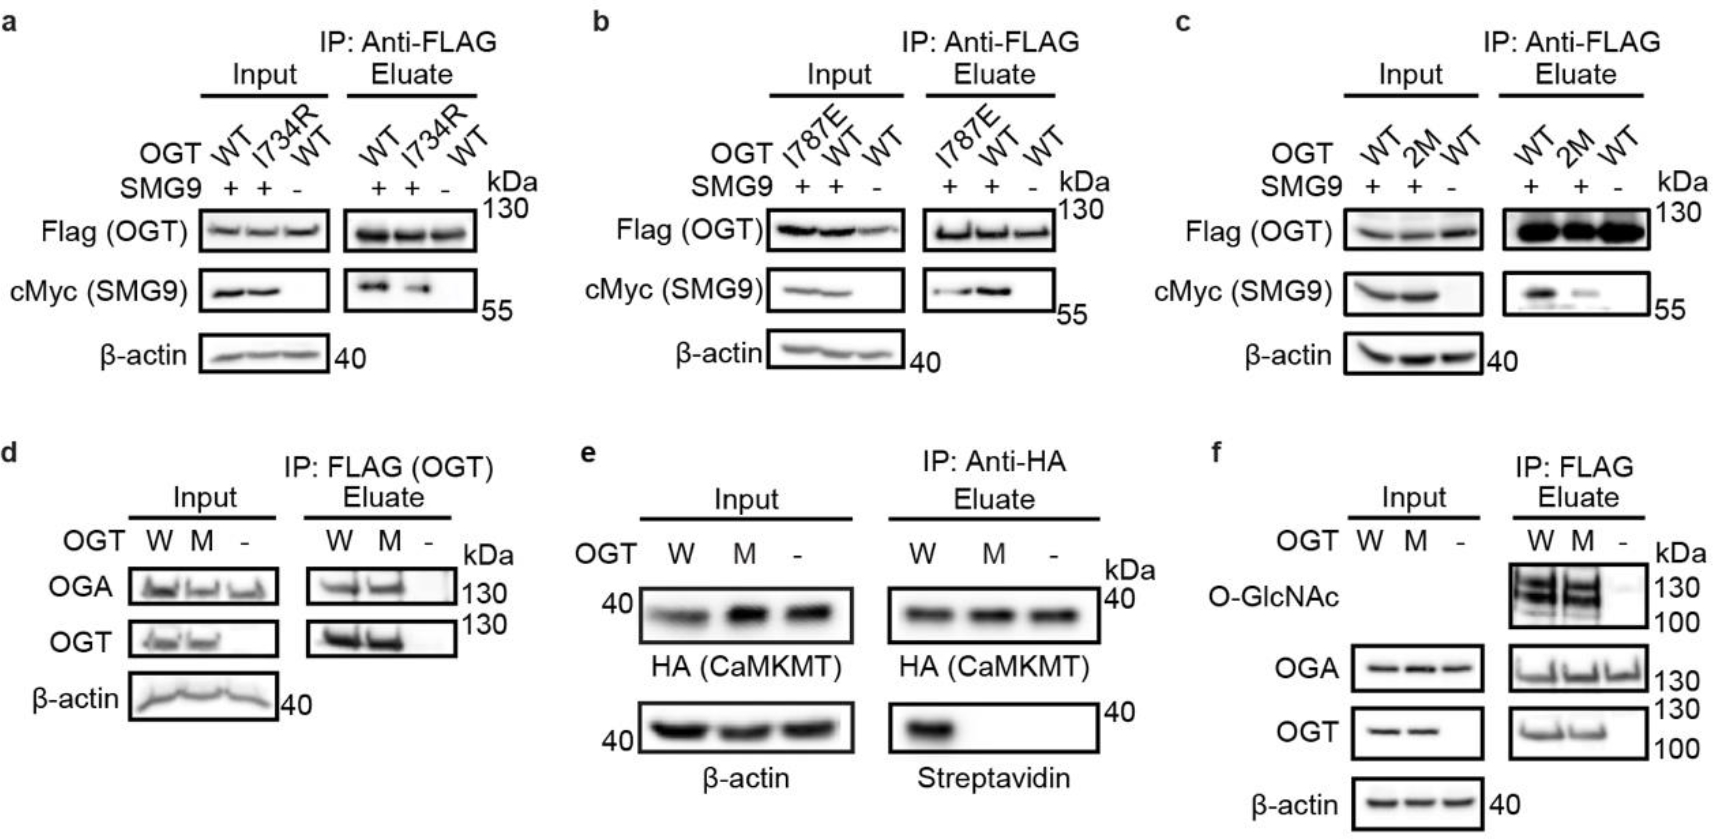
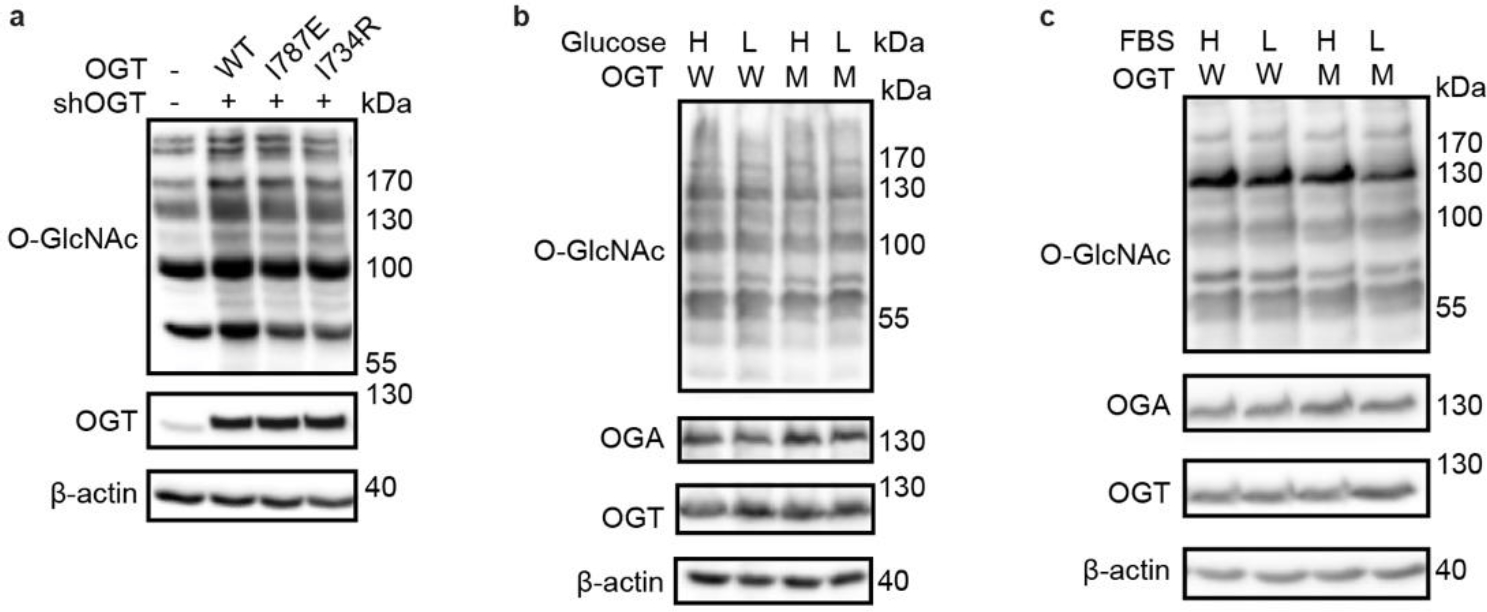
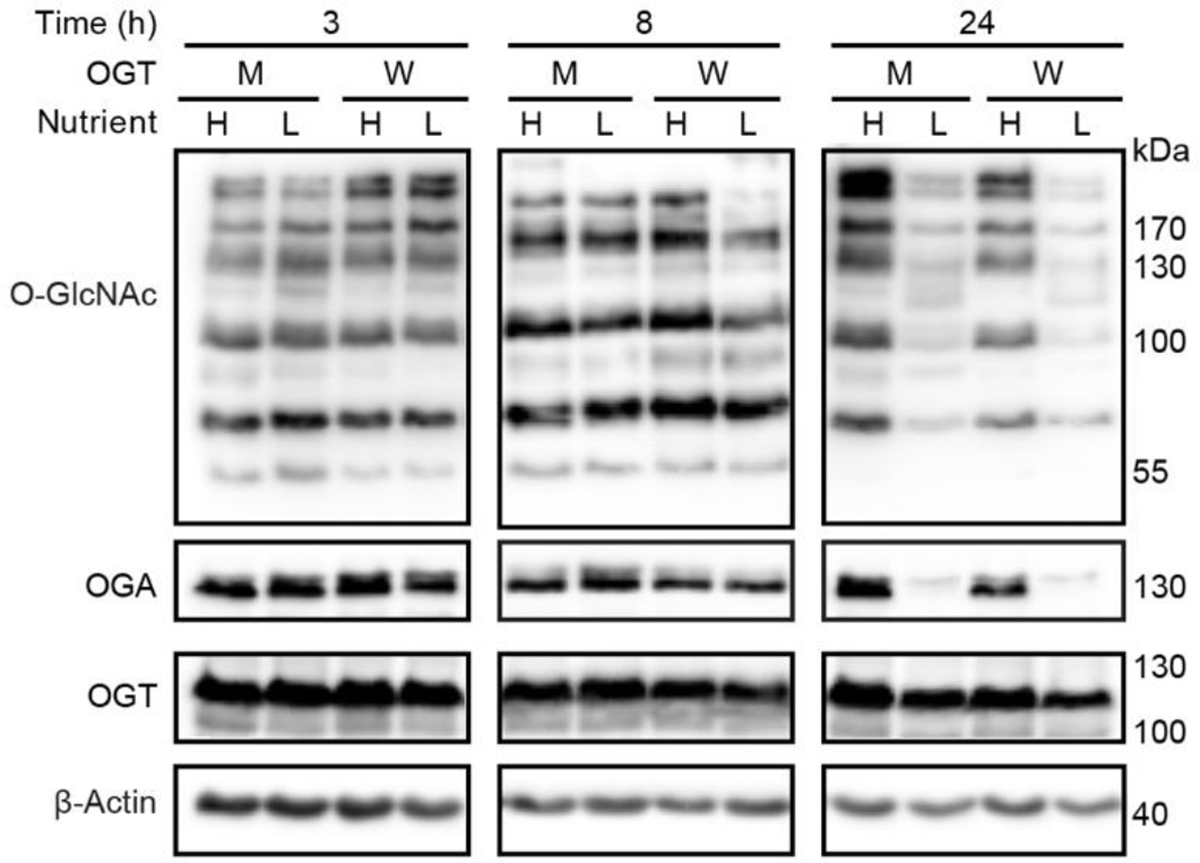
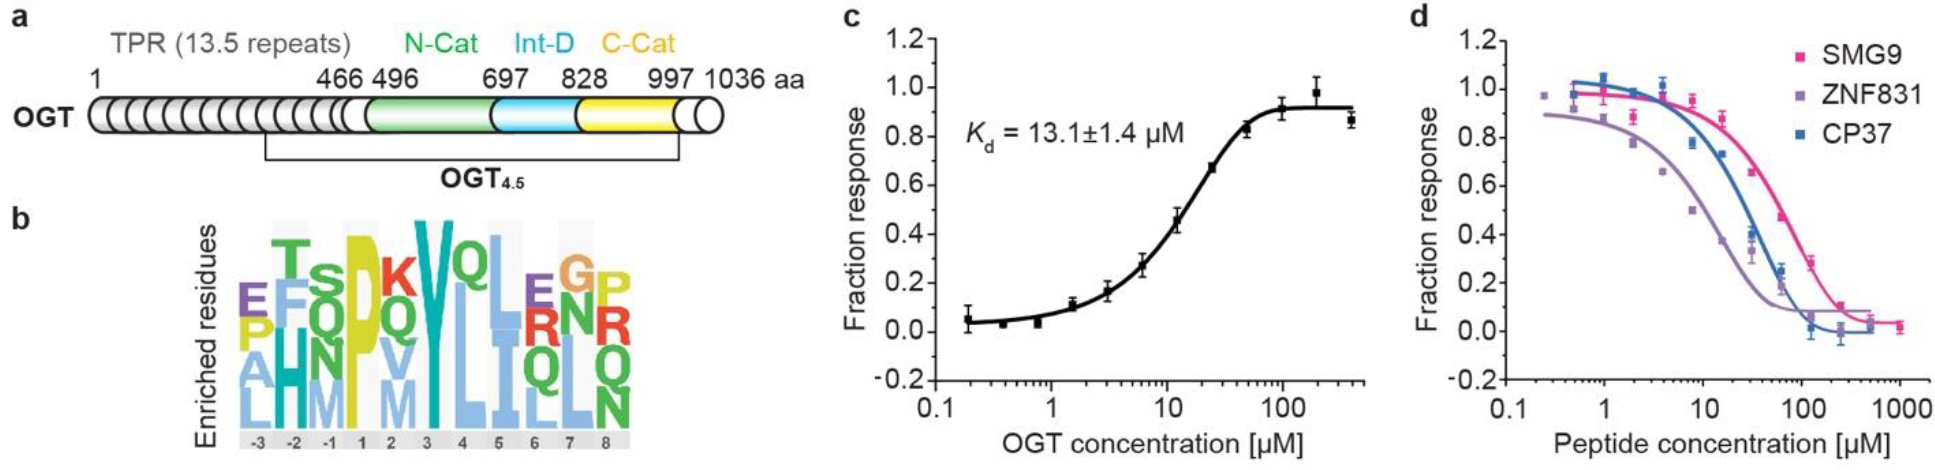
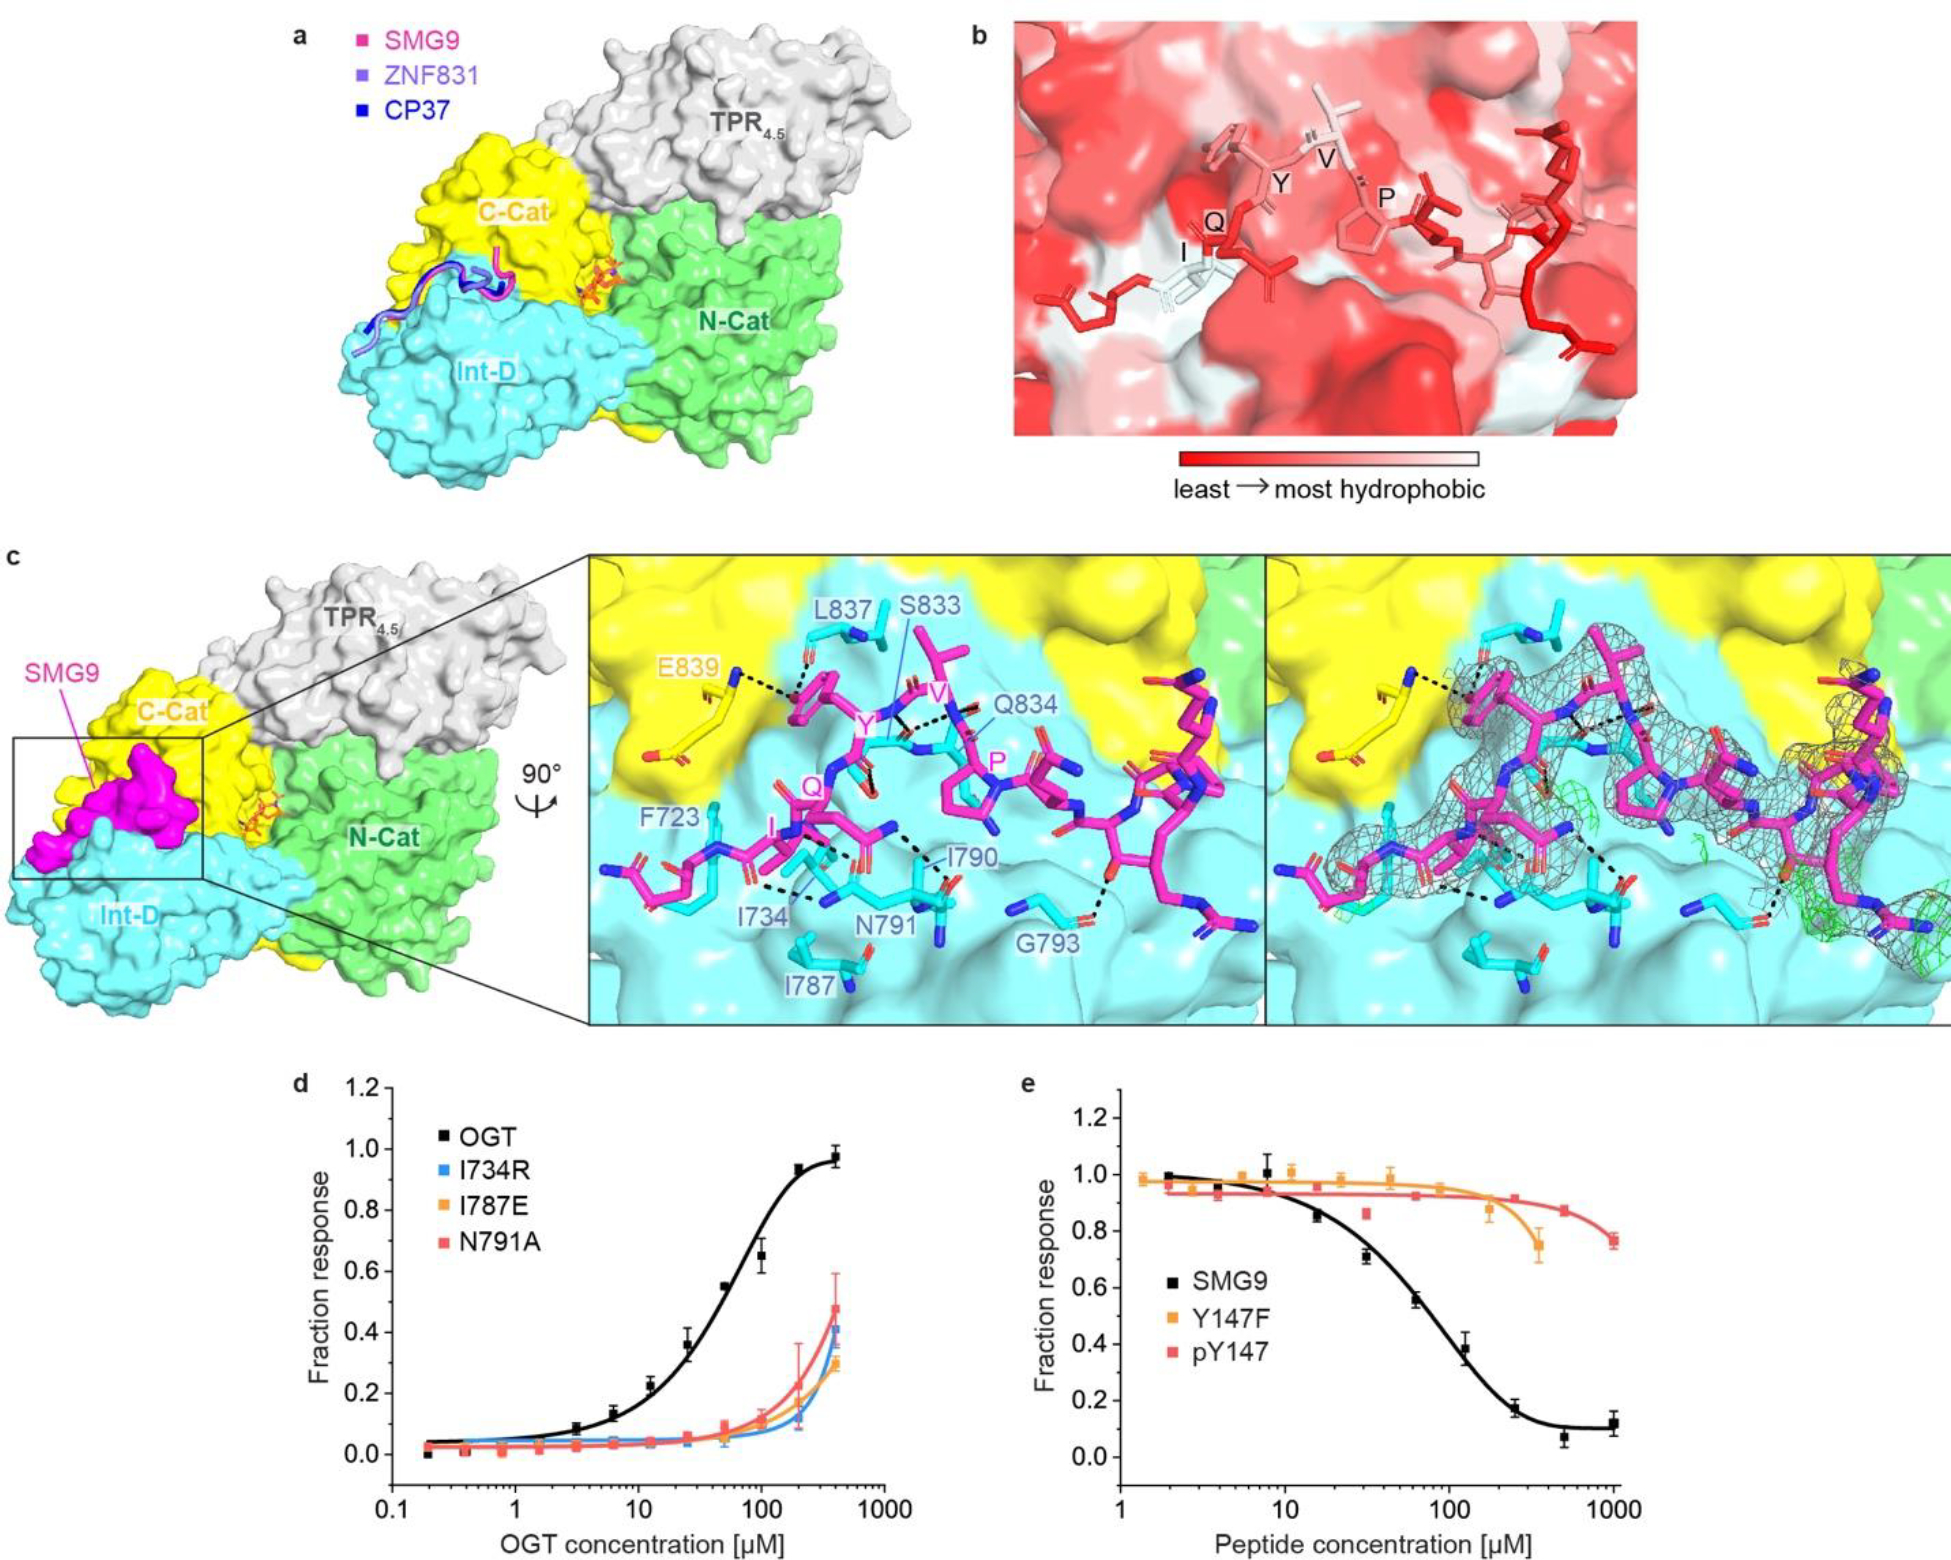
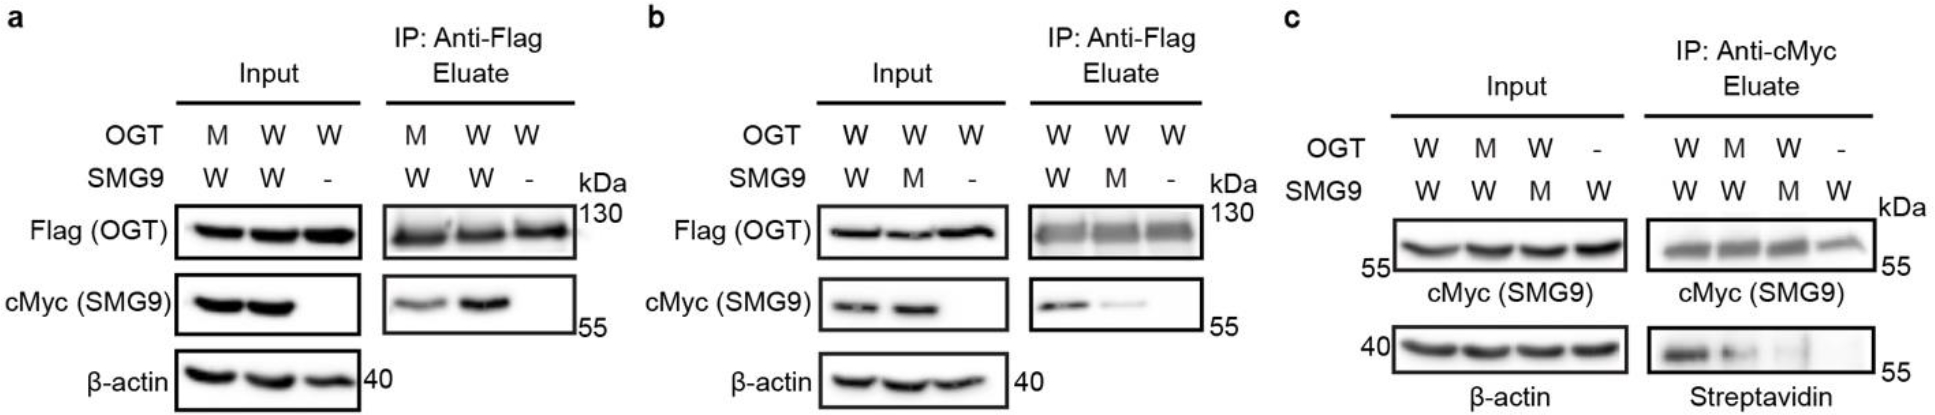
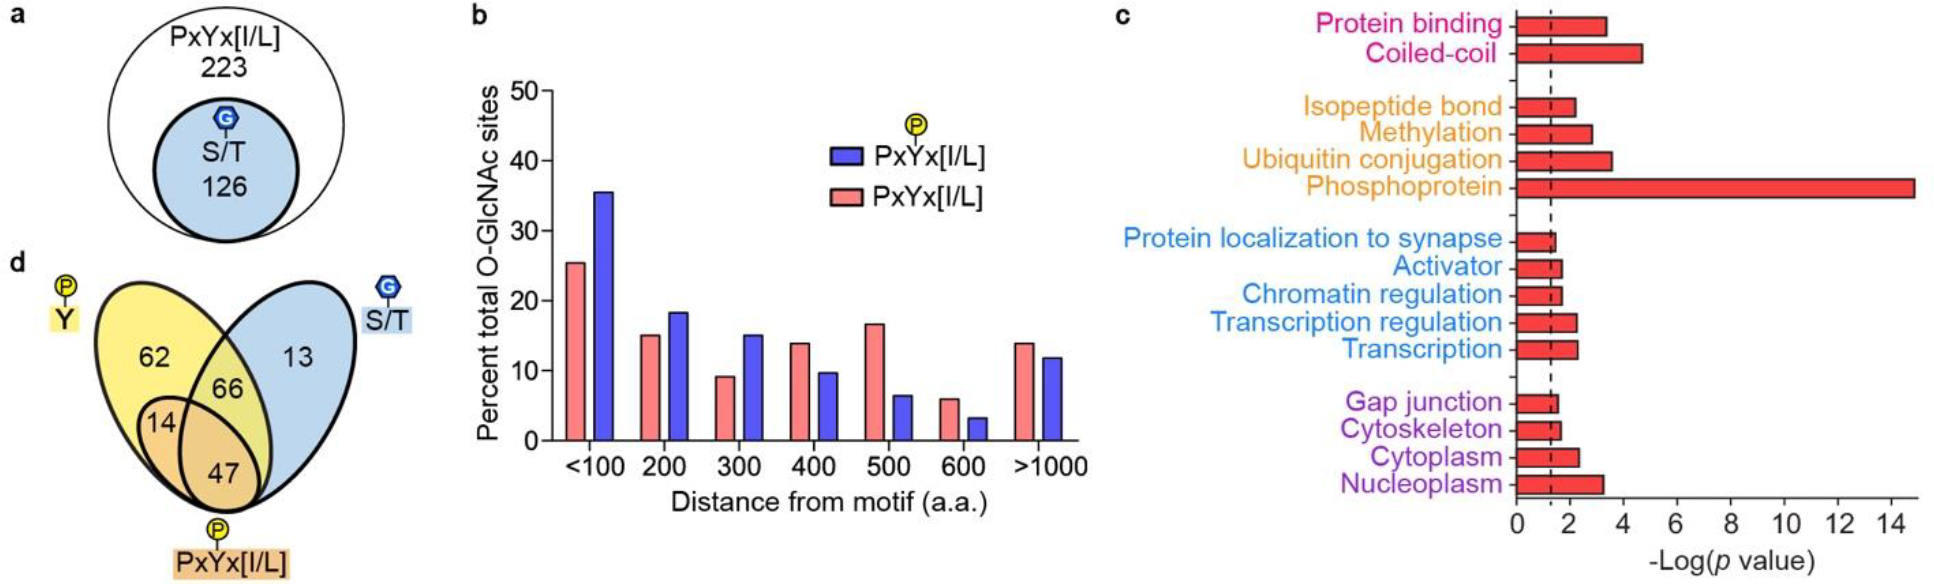
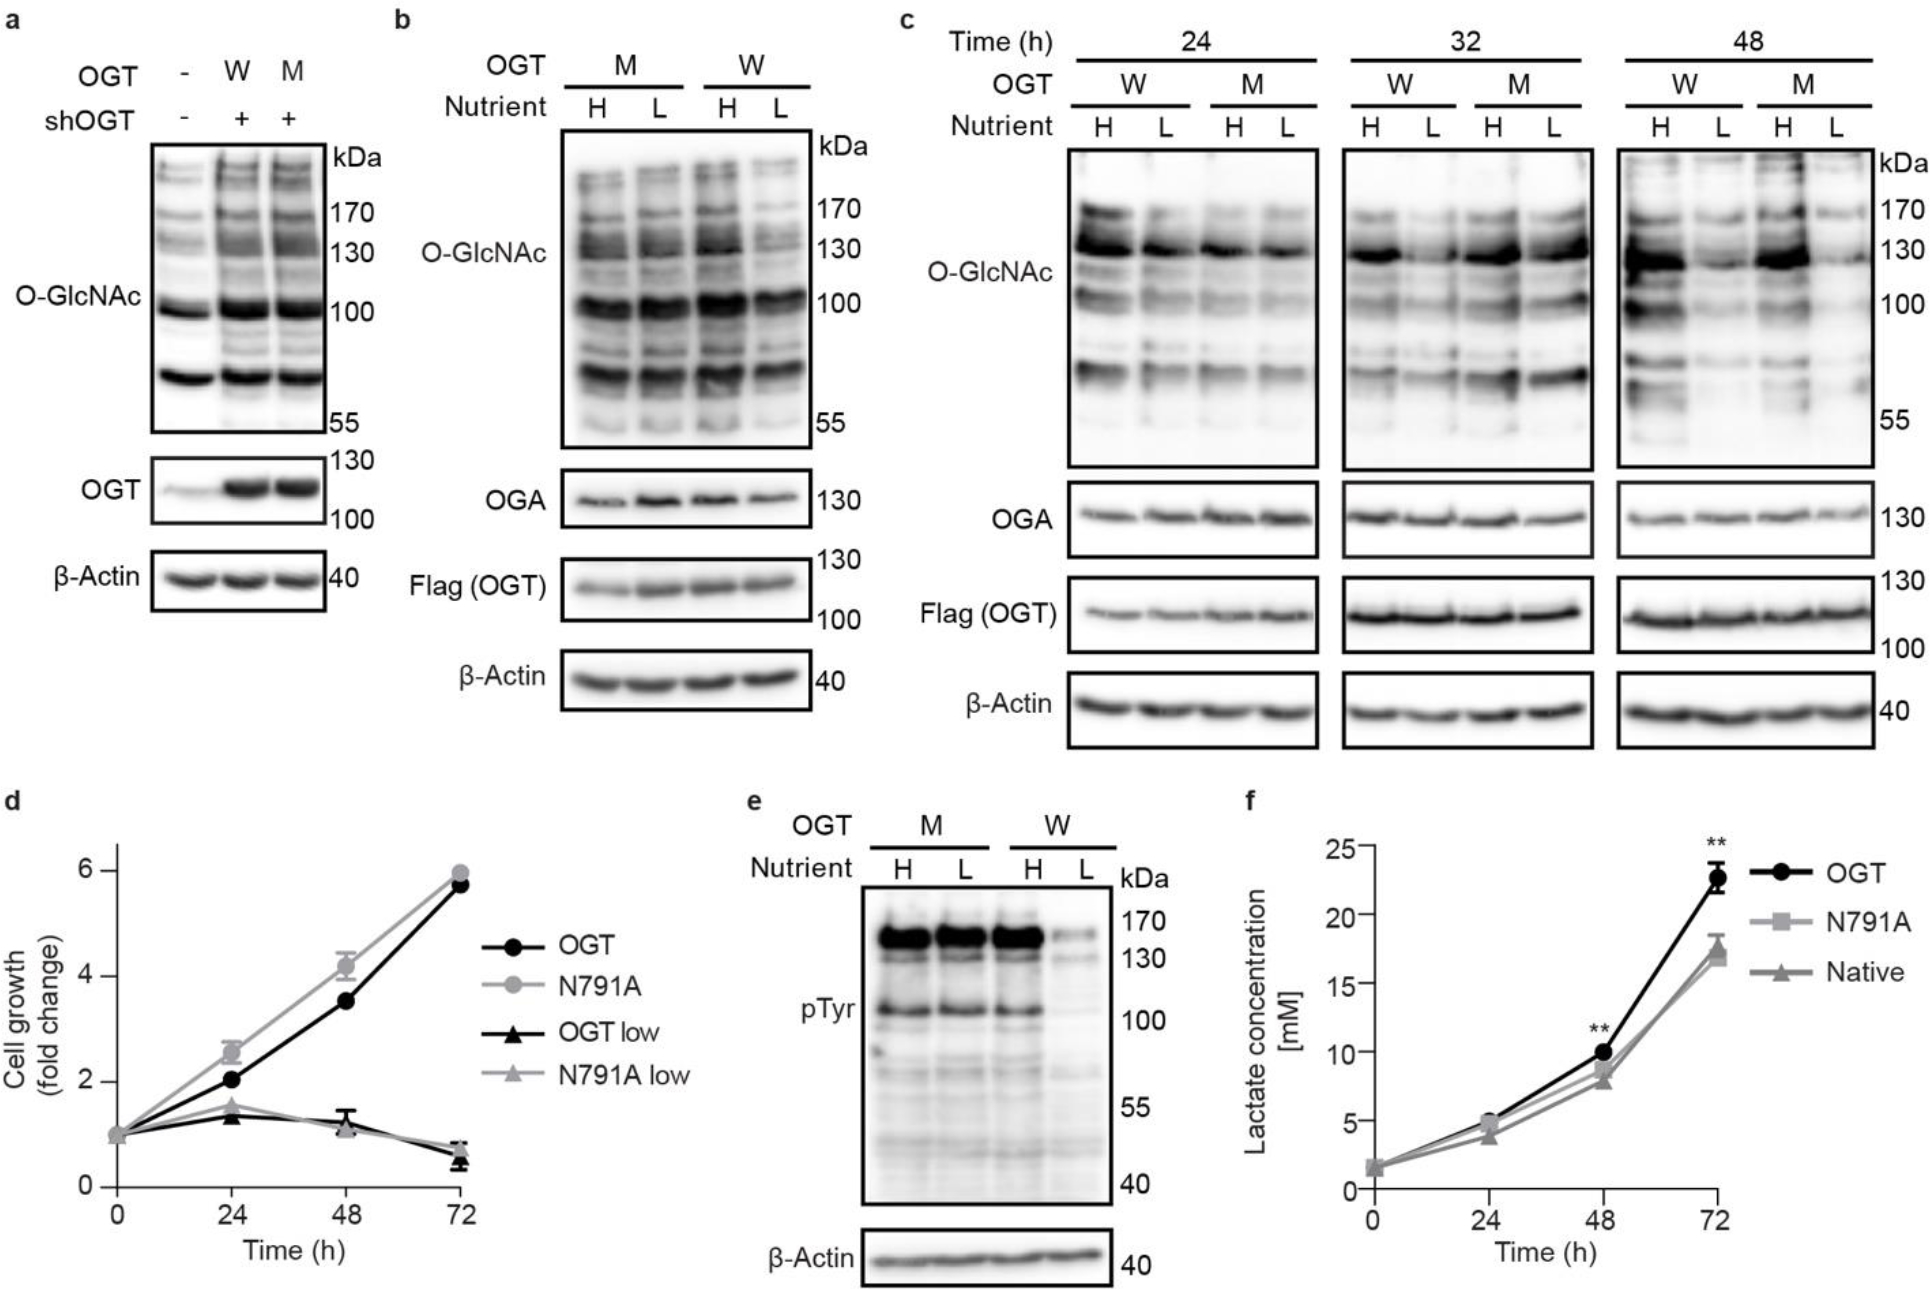
The modification of intracellular proteins with O-linked β-N-acetylglucosamine (O-GlcNAc) moieties is a highly dynamic process that spatiotemporally regulates nearly every important cellular program. Despite its significance, little is known about the substrate recognition and regulation modes of O-GlcNAc transferase (OGT), the primary enzyme responsible for O-GlcNAc addition. In this study, we identified the intervening domain (Int-D), a poorly understood protein fold found only in metazoan OGTs, as a specific regulator of OGT protein-protein interactions and substrate modification. Using proteomic peptide phage display (ProP-PD) coupled with structural, biochemical and cellular characterizations, we discovered a strongly enriched peptide motif, employed by the Int-D to facilitate specific O-GlcNAcylation. We further show that disruption of Int-D binding dysregulates important cellular programs, including response to nutrient deprivation and glucose metabolism. These findings illustrate a mode of OGT substrate recognition and offer key insights into the biological roles of this unique domain.


Conflict of interest statement

Competing Interests

The authors have no competing interests to declare.

Figures

Extended Data Figure 1.
Extended Data Figure 1.. OGT binding evaluation of motif-containing peptides.
(a) Sequences of one consensus (CP37) and seven natural motif-containing peptides along with their apparent binding affinities (EC50) from competitive fluorescence polarization assay using 5-FAM-SMG9 peptide and OGT4.5. Standard deviations from three biological replicates are shown. PxYx[I/L] motif in each peptide is highlighted in red. (b) Thermal shift assay showing the shift in denaturation temperature (Tm) of OGT and OGT4.5 with peptide incubation, n=3. (c) Competitive fluorescence polarization assay between 5-FAM-SMG9 and motif-containing peptides AK9 (blue), DENND1B (green), OR2AG1 (purple), JMJD1C (brown), and CAMKMT (cyan) for OGT4.5 binding. Data are presented as individual measurements +/− SD of mean of three biological replicates.
Extended Data Figure 2.
(a) Zoom-in view at the Int-D binding site demonstrating hydrophobic interactions between ZNF831 peptide (shown as sticks) and Int-D in OGT4.5 (shown as surface). Red and white colors represent the least and most hydrophobic areas, respectively. (b) Zoom-in view at the Int-D binding site demonstrating polar interactions between ZNF831 peptide (shown as purple sticks) and Int-D in OGT4.5 (shown as surface) with interacting OGT residues shown in sticks. 2FoFc electron density map of ZNF831 peptide is shown as grey mesh and contoured at 1.0 σ, FoFc electron density map is shown as green mesh and contoured at 3.0 σ. (c) Zoom-in view at the Int-D binding site demonstrating hydrophobic interactions between CP37 peptide (shown as sticks) and Int-D in OGT4.5 (shown as surface). Red and white colors represent the least and most hydrophobic areas, respectively. (d) Zoom-in view at the Int-D binding site demonstrating polar interactions between CP37 peptide (shown as blue sticks) and Int-D in OGT4.5 (shown as surface) with interacting OGT residues shown in sticks. 2FoFc electron density map of CP37 peptide is shown as grey mesh and contoured at 1.0 σ, FoFc electron density map is shown as green mesh and contoured at 3.0 σ. (e) Superimposition of OGT4.5:UDP-GlcNAc (4GZ5, grey), OGT4.5:UDP-GlcNAc:SMG9 (magenta), OGT4.5:UDP-GlcNAc:ZNF831 (purple), and OGT4.5:UDP-GlcNAc:CP37 (blue) crystal structures showing peptide binding to Int-D does not change the overall structure of OGT4.5. (f) A proposed model of a substrate peptide (shown as brown cartoon) binding to OGT4.5 (shown as surface, domains colored as in Figure 1a). Int-D and TPR domain interactions facilitate substate glycosylation in the active site of OGT. G symbol represents GlcNAc moiety.
Extended Data Figure 3.
Extended Data Figure 3.. Evolutionary conservation analyses of OGT intervening domain.
(a) Sequences of 50 metazoan OGT homologs, including 25 homologs from vertebrates (highlighted in black box), were aligned by Clustal Omega. Jalview was used to review the alignment results and generate the figure. Residues are colored according to the percentage identity in each column (> 80 %, dark blue; > 60 %, blue; > 40%, light blue; < 40%, white). Int-D residues involved in motif interaction are highlighted in red boxes. (b) ConSurf analysis of metazoan (left) and vertebrate (right) OGT evolutionary conservation profile. Residues on the Int-D binding site are conserved among vertebrates but not invertebrates. Residues are colored from green to purple by variability across the aligned structures.
Extended Data Figure 4.
Extended Data Figure 4.. OGT Int-D mutants reduce peptide binding but retain intrinsic activity.
(a) Thermal shift assay showing the mutation induced change in OGT denaturation temperature (Tm). Data are presented as individual measurements +/− SD of mean of three biological replicates. (b) Saturation fluorescence polarization (FP) binding assay of fluorescently labeled 5-FAM-SMG9 peptide with WT OGT (black) and mutants F723R (orange), F723E (blue), and I787R (green). Data are presented as mean values +/− SD of three biological replicates. (c) Radiolabeled activity assay measuring integration of UDP-3H-GlcNAc onto CKII peptide by recombinantly purified WT OGT (WT) or OGT-N791A mutant (N791A). Data are presented as individual measurements +/− SD of mean of three biological replicates.
Extended Data Figure 5.
Extended Data Figure 5.. The Int-D binding site is a motif-dependent regulator of protein association and O-GlcNAcylation.
Co-immunoprecipitation of cMyc-SMG9 with Flag-OGT (WT) or (a) Flag-OGT-I734R (I734R), (b) Flag-OGT-I787E (I787E), (c) Flag-OGT-I787E-N791A (2M), from TRex-293 cells, followed by western blot. (d) Co-immunoprecipitation of endogenous OGA with Flag-OGT (W) or Flag-OGT-N791A (M) from TRex-293 cells, followed by western blot. (e) O-GlcNAcylation detection on CaMKMT from cells co-expressed with Flag-OGT (W) or Flag-OGT-N791A (M). HA-tagged CaMKMT was immunoprecipitated from TRex-293 cell lysate by anti-HA agarose and the O-GlcNAcylation was detected with the same GalT assay as SMG9. (f) O-GlcNAcylation detection on Flag-OGT (W), Flag-OGT-N791A (M), and Flag-HA-OGA-D175N. Flag-tagged OGT and OGA were immunoprecipitated from TRex-293 cell lysate by Flag-agarose, followed by western blot. All whole cell lysates have endogenous OGT knocked down. Blots are representative of at least three biological replicates.
Extended Data Figure 6.
Extended Data Figure 6.. Global O-GlcNAcylation is unperturbed by Int-D site mutation and single nutrient deprivation.
(a) Western blot detection of global O-GlcNAcylation in TRex-293 cells overexpressing OGT (WT), OGT-I787E (I787E), or OGT-I734R (I734R) with endogenous OGT knockdown (shOGT). Western blots of O-GlcNAcylation under high (H) and low (L) glucose (b) or serum (c) treatment with OGT (W) or OGT-N791A (M) overexpression. High nutrient conditions include DMEM with 4.5 g/L glucose and 10% FBS, low nutrient conditions include DMEM with 0.45 g/L glucose and 1% FBS. Blots are representative of at least three biological replicates.
Extended Data Figure 7.
Extended Data Figure 7.. Delayed response to nutrient deprivation in HeLa cells.
Western blot showing time course study of O-GlcNAcylation response to nutrient deprivation in HeLa cells stably expressing OGT (W) and OGT-N791A (M). Cells were induced for 48 hours prior to high or low nutrient treatment, then samples were collected at 3, 8, and 24 hours of treatment. Western blots are representative of three biological replicates.
Figure 1.
Figure 1.. ProP-PD screening identified a specific OGT binding motif.
(a) Domain schematic of full-length OGT with tetratricopeptide repeat (TPR) domain in gray, N-terminal catalytic (N-Cat) domain in green, intervening domain (Int-D) in blue, and C-terminal catalytic (C-Cat) domain in yellow. The crystallization construct OGT4.5 with only 4.5 of 13.5 TPR repeats was also shown. (b) Sequence logo of highly enriched peptides from both OGT and OGT4.5 ProP-PD screens, aligned to the PxYx[I/L] motif. (c) Microscale thermophoresis (MST) binding assay of SMG9 peptide with OGT, n=3. (d) Competitive fluorescence polarization (FP) binding assay with fluorescently labeled 5-FAM-SMG9 peptide competing with unmodified SMG9, ZNF831, and consensus peptide 37 (CP37), for OGT binding, n=3. Data are presented as mean values +/− SD of three replicates.
Figure 2.
Figure 2.. OGT crystal structures reveal a binding site in the Int-D.
(a) OGT4.5 in complex with Int-D-binding peptides and UDP-GlcNAc. SMG9, ZNF831, and CP37 peptides are shown as cartoon in magenta, purple and blue, respectively. Protein domains in OGT4.5 are colored as in Figure 1a. UDP-GlcNAc is shown in orange sticks. (b) Zoom-in view at the Int-D binding site demonstrating hydrophobic interactions between SMG9 peptide (shown as sticks) and Int-D in OGT4.5 (shown as surface). Red to white color scale represent hydrophobicity. (c) Left: surface representation of SMG9 peptide bound to OGT4.5. Right: zoom-in view at the Int-D binding site demonstrating polar interactions between SMG9 peptide (shown as magenta sticks) and Int-D in OGT4.5 (shown as surface) with interacting OGT residues shown in sticks. 2FoFc electron density map of SMG9 peptide is shown as grey mesh and contoured at 1.0 σ, FoFc electron density map is shown as green mesh and contoured at 3.0 σ. (d) Saturation fluorescence polarization (FP) binding assay of fluorescently labeled 5-FAM-SMG9 peptide with wild-type (WT) OGT (black) and mutants I734R (blue), I787E (orange), and N791A (red), n=3. (e) Competitive FP binding assay of WT SMG9 (black), mutant SMG9 Y147F (orange) and phosphorylated SMG9 pY147 (red) peptides with fluorescently labeled 5-FAM-SMG9 peptide binding to OGT, n=3. Data are presented as mean values +/− SD of three replicates.
Figure 3.
Figure 3.. Int-D binding site is a regulator of protein association and O-GlcNAcylation.
(a) Co-IP of cMyc-SMG9 with Flag-OGT (W) or Flag-OGT-N791A (M) from TRex-293 cells, followed by western blot detection. (b) Co-IP of cMyc-SMG9 (W) or cMyc-SMG9-Y147F (M) with Flag-OGT from TRex-293 cells, followed by western blot detection. (c) O-GlcNAcylation detection on SMG9 (W) or SMG9-Y147F (M) from cells co-expressed with Flag-OGT (W) or Flag-OGT-N791A (M). cMyc-tagged SMG9 (WT or Y147F mutant) was immunoprecipitated from TRex-293 cell lysate by cMyc-agarose, biotinylated by GalT assay, and detected by streptavidin-HRP far western blot. All whole cell lysates have endogenous OGT knocked down. Blots are representative of at least three biological replicates.
Figure 4.
Figure 4.. Bioinformatic analysis of PxYx[I/L] motif containing proteins.
(a) O-GlcNAcylated proteins (blue circle), among the 223 PxYx[I/L] motif-containing proteins (white circle). (b) Distance of known O-GlcNAcylation sites from all PxYx[I/L] motifs (pink) and phosphorylated PxYx[I/L] motifs (blue). (c) Gene Ontology terms associated with motif-containing proteins. Molecular function and protein domain (pink), posttranslational modifications (orange), biological processes (blue), cellular components (purple). Dotted line represents p-value cutoff of 0.05. (d) Overlap analysis of motif-containing proteins with reported tyrosine phosphorylation anywhere on the protein (yellow oval), O-GlcNAcylation anywhere on the protein (blue oval), and tyrosine phosphorylation on the PxYx[I/L] (orange oval).
Figure 5.
Figure 5.. OGT Int-D binding site is a regulator of O-GlcNAc dynamics during nutrient deprivation and lactate production.
(a) Western blot detection of global O-GlcNAcylation in TRex-293 cells overexpressing OGT (W) or OGT-N791A (M) with endogenous OGT knockdown (shOGT). (b) Western blot of O-GlcNAcylation under high (H) and low (L) nutrient conditions with OGT (W) or OGT-N791A (M) overexpression. High nutrient conditions include DMEM with 4.5 g/L glucose and 10% FBS, low nutrient conditions include DMEM with 0.45 g/L glucose and 1% FBS. (c) Western blot showing time course study of O-GlcNAcylation response to a low nutrient condition with OGT (W) and OGT-N791A (M) overexpression. Cells were induced for 48 hours prior to high or low nutrient treatment, then samples were collected at 24, 32, and 48 hours of treatment. (d) Growth rate of cells overexpressing OGT (black lines) or OGT-N791A (gray lines) under high (circles) and low (triangles) nutrient conditions over 72 hours. Data are presented as mean values +/− SD of four biological replicates. No significant difference was detected between cell lines by two-tailed unpaired t-test in either nutrient condition. (e) Western blot of global phosphotyrosine signal from samples treated with the same conditions as panel b. (f) Media lactate concentration from native TRex-293 cells or those expressing WT OGT or N791A after 24, 48, and 72 hours. Lactate concentration, from LactateGlo assay, was normalized to cell number by CellTiter-Glo assay and quantified by lactate standard curve. Conditions were compared by two-tailed unpaired t-test, ** p=0.002. Data are presented as mean values +/− SD of four biological replicates. Western blots are representative of three biological replicates.

Update of

Similar articles

Cited by

References

    1. Chiaradonna F, Ricciardiello F & Palorini R The nutrient-sensing hexosamine biosynthetic pathway as the hub of cancer metabolic rewiring. Cells 7, 53 (2018). - PMC - PubMed
    1. Liu C & Li J O-GlcNAc: a sweetheart of the cell cycle and DNA damage response. Front. Endocrinol. 9, (2018). - PMC - PubMed
    1. Parker MP, Peterson KR & Slawson C O-GlcNAcylation and O-GlcNAc cycling regulate gene transcription: emerging roles in cancer. Cancers 13, 1666 (2021). - PMC - PubMed
    1. Ruan H-B, Nie Y & Yang X Regulation of protein degradation by O-GlcNAcylation: crosstalk with ubiquitination. Mol. Cell. Proteomics 12, 3489–3497 (2013). - PMC - PubMed
    1. Ong Q, Han W & Yang X O-GlcNAc as an integrator of signaling pathways. Front. Endocrinol. 9, (2018). - PMC - PubMed

Methods-only References

    1. Vonrhein C et al. Data processing and analysis with the autoPROC toolbox. Acta Crystallogr. D Biol. Crystallogr. 67, 293–302 (2011). - PMC - PubMed
    1. Evans PR & Murshudov GN How good are my data and what is the resolution? Acta Crystallogr. D Biol. Crystallogr. 69, 1204–1214 (2013). - PMC - PubMed
    1. Evans P Scaling and assessment of data quality. Acta Crystallogr. D Biol. Crystallogr. 62, 72–82 (2006). - PubMed
    1. McCoy AJ et al. Phaser crystallographic software. J. Appl. Crystallogr. 40, 658–674 (2007). - PMC - PubMed
    1. Emsley P & Cowtan K Coot: model-building tools for molecular graphics. Acta Crystallogr. D Biol. Crystallogr. 60, 2126–2132 (2004). - PubMed

LinkOut - more resources