. 2023 Sep;30(9):1346-1356.
doi: 10.1038/s41594-023-01072-x. Epub 2023 Aug 31.

DNA-PK and the TRF2 iDDR inhibit MRN-initiated resection at leading-end telomeres

Affiliations

DNA-PK and the TRF2 iDDR inhibit MRN-initiated resection at leading-end telomeres

Logan R Myler et al. Nat Struct Mol Biol. 2023 Sep.

Abstract

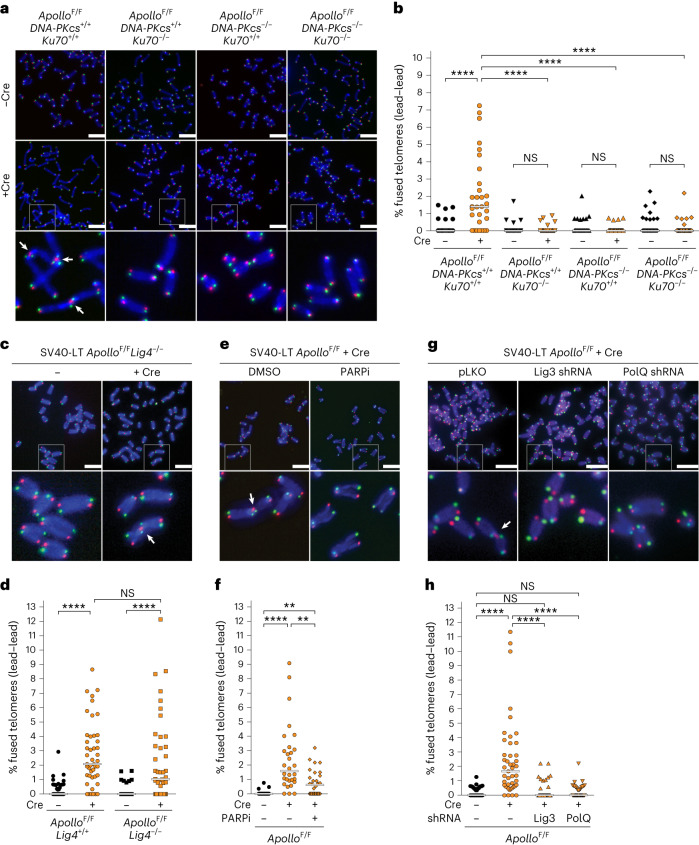
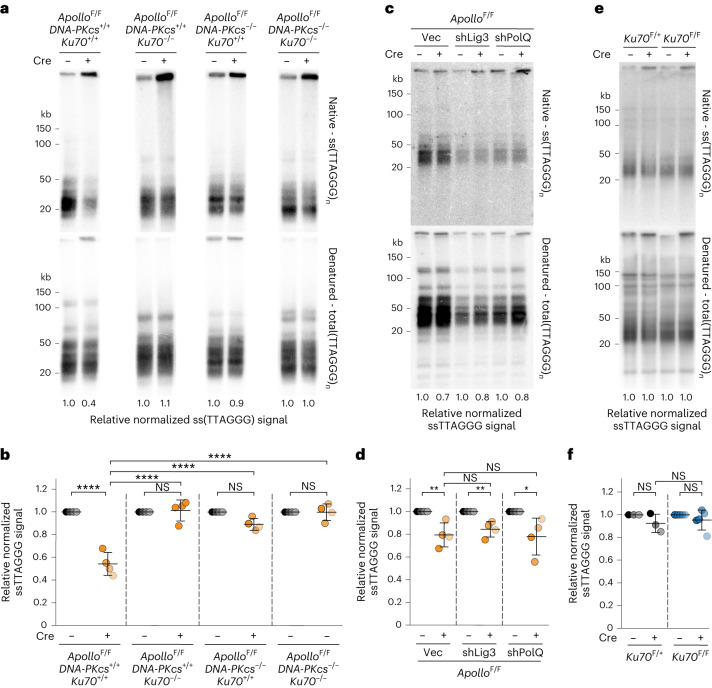
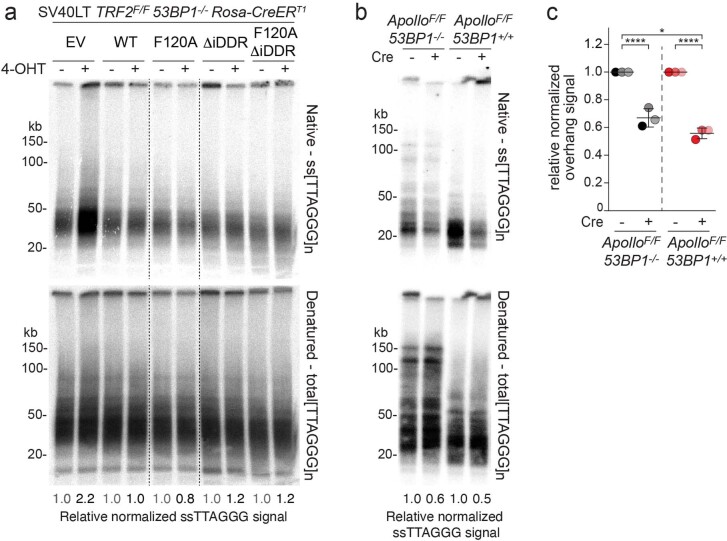
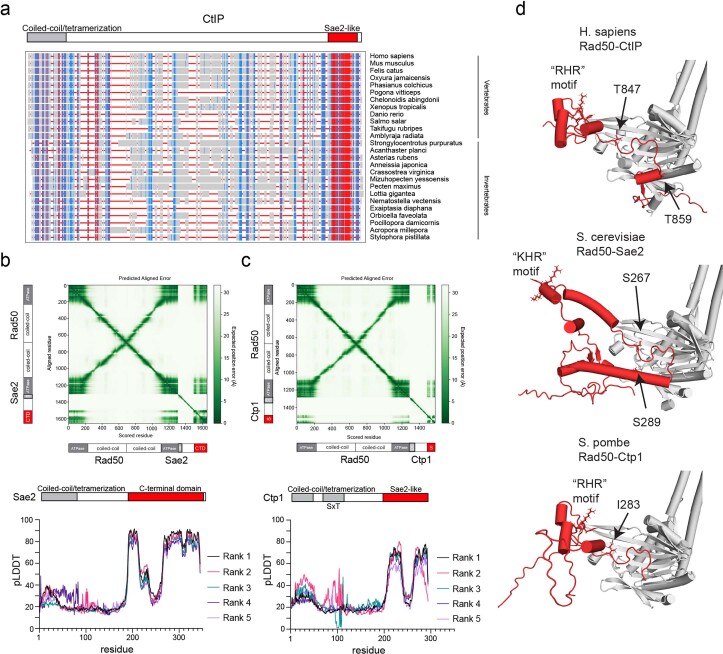
Telomeres replicated by leading-strand synthesis lack the 3' overhang required for telomere protection. Surprisingly, resection of these blunt telomeres is initiated by the telomere-specific 5' exonuclease Apollo rather than the Mre11-Rad50-Nbs1 (MRN) complex, the nuclease that acts at DNA breaks. Without Apollo, leading-end telomeres undergo fusion, which, as demonstrated here, is mediated by alternative end joining. Here, we show that DNA-PK and TRF2 coordinate the repression of MRN at blunt mouse telomeres. DNA-PK represses an MRN-dependent long-range resection, while the endonuclease activity of MRN-CtIP, which could cleave DNA-PK off of blunt telomere ends, is inhibited in vitro and in vivo by the iDDR of TRF2. AlphaFold-Multimer predicts a conserved association of the iDDR with Rad50, potentially interfering with CtIP binding and MRN endonuclease activation. We propose that repression of MRN-mediated resection is a conserved aspect of telomere maintenance and represents an ancient feature of DNA-PK and the iDDR.


Conflict of interest statement

T.d.L. is a member of the scientific advisory board of Calico, San Francisco, CA, USA. The remaining authors declare no competing interests.

Figures

Fig. 1
Fig. 1. Alt-EJ promotes leading-end telomere fusions due to Apollo deletion.
a, Representative chromosome orientation fluorescence in situ hybridization (CO-FISH) of metaphase spreads in ApolloF/FDNA-PKcs+/+Ku70+/+, ApolloF/FDNA-PKcs+/+Ku70−/−, ApolloF/FDNA-PKcs−/−Ku70+/+, or ApolloF/FDNA-PKcs−/−Ku70−/− MEFs immortalized by simian virus 40 large T antigen (SV40LT) without any treatment or 96 h after Hit & Run Cre-mediated deletion of Apollo. Leading- and lagging-end telomeres were detected with Cy3-(TTAGGG)3 (red) and Alexa-Fluor-488-(CCCTAA)3 (green) probes, respectively. DNA was stained with DAPI (blue). Arrows indicate leading-end telomere fusions. The boxed regions are enlarged in the bottom row. b, Quantification of leading-end telomere fusions as shown in a. Each dot represents the percentage of telomeres fused in one metaphase. Bars represent the median of fused telomeres in n = 30 metaphases over 3 independent experiments (10 metaphases per experiment). Only fusions involving two leading-end telomeres (lead–lead) are shown. c,d, Representative micrographs of metaphase spreads in ApolloF/FLig4+/+ and ApolloF/FLig4−/− MEFs (c) and quantification of leading-end telomere fusions (d) before and 96 h after Hit & Run Cre. Quantification as in b for n = 45 metaphases over 3 independent experiments (15 metaphases per experiment). e,f, Representative micrographs of metaphase spreads of ApolloF/F MEFs (e) and quantification of leading-end telomere fusions (f) 96 h after Hit & Run Cre and/or after 24 h of treatment with 2 μM of the PARP inhibitor olaparib (PARPi). Quantification as in b for n = 30 metaphases over 3 independent experiments (10 metaphases per experiment). g,h, Representative micrographs of metaphase spreads of ApolloF/F MEFs (g) and quantification of leading-end telomere fusions (h) 108 h after Hit & Run Cre. Cells were transduced with empty vector or an shRNA targeting Lig3 or PolQ. for n = 45 metaphases over 3 independent experiments (15 metaphases per experiment). Statistical analysis by Kruskal–Wallis one-way analysis of variance (ANOVA) for multiple comparisons. Scale bars (a,c,e,g), 10 μm. ****P < 0.0001, ***P < 0.001, **P < 0.01, *P < 0.05. NS, not significant. See also Extended Data Fig. 1. Source data
Fig. 2
Fig. 2. DNA-PK prevents Apollo-independent processing of 3′ telomere overhang.
a, Telomeric overhang assay on SV40LT-immortalized ApolloF/FDNA-PKcs+/+Ku70+/+, ApolloF/FDNA-PKcs+/+Ku70−/−, ApolloF/FDNA-PKcs−/−Ku70+/+ or ApolloF/FDNA-PKcs−/−Ku70−/− MEFs 96 h after Hit & Run Cre-mediated deletion of endogenous Apollo. Top, single-stranded telomeric DNA signal (Native - ss(TTAGGG)3). Bottom, total telomeric signal (Denatured - total(TTAGGG)3). The ssTTAGGG signal was normalized to the total telomeric DNA in the same lane. The normalized −Cre value for each cell line is set to 1, and the +Cre value is given relative to 1. b, Quantification of the relative overhang signal as detected in a for n = 4 independent experiments (indicated by different shades), with mean ± s.d. indicated. c,d, Telomeric overhang assay (c) and quantification (d) on SV40LT-immortalized ApolloF/F MEFs transduced with empty vector or shRNAs targeting Lig3 or PolQ and 108 h after Cre-mediated deletion of endogenous Apollo. n = 4 independent experiments. Data are presented as mean ± s.d. e,f, Telomeric overhang assay (e) and quantification (f) of Ku70F/+ (n = 3) and two independent Ku70F/F (n = 5) MEFs 96 h after Hit & Run Cre-mediated deletion of endogenous Ku70. n = 3 independent experiments. Data are presented as mean ± s.d. Statistical analysis by two-way ANOVA (b,f) and two-tailed unpaired t-test (d). ****P < 0.0001, ***P < 0.001, **P < 0.01, *P < 0.05. See also Extended Data Figs. 1 and 2. Source data
Fig. 3
Fig. 3. Nbs1 protects from leading-end telomeres fusions in the absence of Apollo and DNA-PKcs.
a, Immunoblots for Nbs1 in SV40LT-immortalized ApolloF/FDNA-PKcs−/− MEFs, after transduction with Cas9 expression vector with short guide RNA (sgRNA) targeting Nbs1 or without this sgRNA (Vec) and/or Hit & Run Cre. Actin is shown as a loading control. b,c, Representative micrographs of metaphase spreads in ApolloF/F and ApolloF/FDNA-PKcs−/− MEFs (scale bars, 10 μm) (b) and quantification of leading-end telomere fusions (c) 96 h after Cre-mediated deletion of Apollo and/or 48 h after deletion of Nbs1 by CRISPR–Cas9 and the specific sgRNA, as shown in a, for n = 30 metaphases collected over 3 independent experiments (10 metaphases per experiment). In micrographs, the boxed area is enlarged in the bottom row. The white arrow indicates a leading-end telomere fusion. In the graph, bars represent the median. Statistical analysis by Kruskal–Wallis one-way ANOVA for multiple comparisons. ****P < 0.0001, ***P < 0.001, **P < 0.01, *P < 0.05. Source data
Fig. 4
Fig. 4. TRF2 prevents Apollo-independent processing of 3′ telomere overhang through the iDDR region.
a, Immunoblot of endogenous and exogenous TRF2 and Chk2 phosphorylation in SV40LT-immortalized Trf2F/FRsCre-ERT1 MEFs expressing empty vector (EV) or the MYC-Trf2 (WT), MYC-Trf2ΔiDDR (ΔiDDR), MYC-Trf2F120A (F120A) or MYC-Trf2F120A ΔiDDR (F120A ΔiDDR) alleles at 96 h after 4-OH tamoxifen (4-OHT)-mediated deletion of endogenous TRF2. Actin is shown as a loading control. b,c, Telomeric overhang assay (b) and quantification (c) from n = 4 independent experiments of cells treated as described in a. For each MYC-Trf2 allele, the normalized −Cre value was set to 1, and the +Cre value was given relative to 1, with mean ± s.d. indicated. Statistical analysis by two-tailed unpaired t-test. d,e, CO-FISH metaphase analysis (d) and quantification of leading-end telomere fusions (e) in Trf2F/FRsCre-ERT1 MEFs expressing empty vector (EV) or one of the MYC-Trf2 alleles described in a 96 h after treatment with 4-OHT. Scale bars, 10 μm. The bars on the graph show the median. Statistical analysis by Kruskal–Wallis one-way ANOVA for multiple comparisons for n = 30 metaphases over 3 independent experiments (10 metaphases per experiment). ****P < 0.0001, ***P < 0.001, **P < 0.01, *P < 0.05. See also Extended Data Fig. 3. Source data
Fig. 5
Fig. 5. The TRF2 iDDR acts through MRN.
a,b, Telomeric overhang assay and quantification from n = 4 independent experiments of Trf2F/FNbs1F/+ and Trf2F/FNbs1F/− MEFs expressing the indicated MYC-Trf2 alleles 120 h after Cre-mediated deletion of TRF2 or TRF2 and Nbs1. Each cell line was normalized to the WT allele. Data are presented as mean ± s.d. Statistical analysis by two-tailed unpaired t-test. c,d, CO-FISH metaphase analysis (c) and quantification of leading-end telomere fusions (d) in Trf2F/FNbs1F/+ and Trf2F/FNbs1F/− MEFs expressing the indicated MYC-Trf2 alleles 120 h after Cre-mediated deletion of TRF2 or TRF2 and Nbs1. Scale bars, 10 μm. Graph represents n = 45, 38, 44, 64, 58, 58, 51, 57 metaphases over 3 independent experiments (at least 10 metaphases per experiment), with medians. Statistical analysis by Kruskal–Wallis one-way ANOVA for multiple comparisons. ****P < 0.0001, ***P < 0.001, **P < 0.01, *P < 0.05. See also Extended Data Fig. 4. Source data
Fig. 6
Fig. 6. The iDDR of TRF2 inhibits MRN endonuclease activity in vitro.
a, Coomassie-stained SDS–PAGE gel of purified TRF2 proteins. The gel is a representative of three independent protein preparations. WT and ∆iDDR were prepared identically. Protein molecular weight (MW) is shown as control. b, Schematic of the MRN–CtIP endonuclease assay with DNA-PK. c, MRN endonuclease assay in the presence of WT or ΔiDDR TRF2. MRN (50 nM) was incubated with phosphorylated CtIP (80 nM), DNA-PKcs (10 nM), Ku70/80 (10 nM) and varying concentrations of TRF2 (25, 50, 100 or 200 nM) in the presence of a 5′ 32P-labeled DNA substrate. The gel is a representative example of two independent replicates. The blue arrow indicates the primary endonucleolytic cleavage product (~45 nt away from the end). d, Schematic of the MRN exonuclease assay. e,f, MRN endonuclease assay gel (e) and quantification (f) of n = 4 independent replicates in the presence of WT or ΔiDDR TRF2. Data are presented as mean ± s.d. Statistics by two-tailed unpaired t-test assuming a Gaussian distribution. ****P < 0.0001, ***P < 0.001, **P < 0.01, *P < 0.05. Source data
Fig. 7
Fig. 7. The iDDR of TRF2 is predicted to compete with CtIP for binding to RAD50.
a, Predicted aligned error (PAE) plot from AlphaFold-Multimer modeling of human RAD50–TRF2. Representative of five ranked models generated with default parameters. b, pLDDT plot showing per-residue confidence score across human TRF2 from the ranked RAD50–TRF2 models. c, Predicted structure of a human RAD50 dimer with a dimer of human TRF2. The RAD50 coiled-coils were truncated for the dimer model. Only the iDDR of TRF2 is shown. d, PAE plot from the AlphaFold-Multimer modeling of human RAD50–CtIP. Representative of five ranked models generated with default parameters. e, pLDDT plot showing per-residue confidence score across human CtIP from the ranked RAD50–CtIP models. f, Predicted structure of a human RAD50 dimer with the Sae2-like domain of human CtIP. The RAD50–CtIP monomer model was superimposed on the predicted structure of an RAD50 dimer from c. g, Model for inhibition of MRN endonuclease activity by the TRF2 iDDR. TRF2 competes with CtIP for binding to RAD50, which stimulates the endonuclease-active state of MRN. h, Model for leading-end telomere processing and protection mediated by TRF2 and DNA-PK. TRF2 promotes the 5′-resection of the leading-end telomere by recruiting Apollo. In the absence of Apollo, either owing to Apollo deletion or the lack of recruitment due to TRF2-F120A, the newly replicated leading-end telomere ends cannot be resected and undergo fusion mediated by alt-NHEJ. In the absence of Apollo and the iDDR domain of TRF2, MRN–CtIP initiates resection at DNA-PK-bound leading-end telomeres, leading to telomere protection and the absence of fusions. When both DNA-PK and Apollo are absent, MRN can promote the resection of the free DNA ends, even in the presence of the TRF2 iDDR domain. See also Extended Data Figs. 5–7.
Extended Data Fig. 1
Extended Data Fig. 1. DNA-PK does not affect Chk2 phosphorylation after Apollo deletion.
a) Immunoblots for DNA-PKcs, Ku70, and phosphorylated Chk2 in SV40LT-immortalized ApolloF/F, ApolloF/F Ku70−/−, ApolloF/F DNA-PKcs−/− or ApolloF/F Ku70−/− DNA-PKcs−/− MEFs, without any further treatment or 96 h after transduction with Hit & Run Cre, as analyzed in Figs. 1a,b and 2a,b. (b) and (c) Quantification of telomere fusions as shown in Fig. 1a aggregated for chromatid-type involving two lagging-end telomeres (lag/lag) (b) or chromosome-type fusions (chromosome) (c). Bars represent the median over 10 metaphases for three independent experiments (30 metaphases in total). (d) Immunoblots for Lig3 in SV40LT-immortalized ApolloF/F MEFs after transduction with the empty vector or the shRNA against Lig3 and/or 108 h after treatment with Hit & Run Cre as analyzed in Fig. 1g,h. (e) PolQ mRNA expression normalized to β-actin in SV40LT-immortalized ApolloF/F MEFs after transduction with the empty vector or the shRNA against PolQ and 108 h after treatment with Hit & Run Cre, as analyzed in Fig. 1g,h. Values were obtained from three independent experiments and normalized to the empty vectors, with means and SD. Statistical analysis by unpaired t-test with Welch correction. Source data
Extended Data Fig. 2
Extended Data Fig. 2. Exo1 promotes Apollo-independent processing of telomere overhang in absence of DNA-PKcs.
(a), (b) Telomeric overhang assay and quantification on SV40-LT-immortalized ApolloF/F Lig4+/+ and ApolloF/F Lig4−/− MEFs 96 h after Cre-mediated deletion of endogenous Apollo for three independent experiments. Statistical analysis by two-way ANOVA. (c) Targeting of the mouse XRCC6/KU70 locus. The Xrcc6 genomic locus, the KOMP-derived targeted allele with the LacZ/Neo insert and the floxed allele are indicated. The LoxP sites are represented as triangles. (d) Immunoblots for mouse Ku70 in SV40-LT-immortalized Ku70F/+ or Ku70F/F without any treatment or 108 h after viral transduction with Hit & Run Cre as analyzed in Fig. 2e,f. (e) Quantification of leading end telomere fusions in ApolloF/F DNA-PKcs−/− MEFs 108 h after Cre-mediated deletion of endogenous Apollo and/or depletion of Exo1 for two independent experiments. Bars represent median of 20 metaphases (10 per experiment). Statistical analysis by Kruskal-Wallis one-way ANOVA for multiple comparisons. (f), (g) Telomeric overhang assay and quantification on SV40-LT-immortalized ApolloF/F DNA-PKcs−/− MEFs 108 h after Cre-mediated deletion of endogenous Apollo and/or depletion of Exo1 for four independent experiments. Statistical analysis by unpaired t-test. Source data
Extended Data Fig. 3
Extended Data Fig. 3. Expression of MYC-TRF2 alleles.
(a) Schematic of MYC-tagged mouse TRF2 with Basic, Telomeric Repeat Factors Homology (TRH), Hinge, and Myb domains. Phenylalanine 120 (F120) required for the interaction with Apollo and the iDDR region are highlighted. (b) Lower and higher exposure for the immunoblot of endogenous and exogenous TRF2 as shown in Fig. 4a. (c) Quantification of the percentage of phosphorylated Chk2 versus total Chk2 as shown in Fig. 4a for n = 2 independent experiments. Bars indicate the average. (d) IF-FISH of SV40LT-immortalized Trf2F/FRsCre-ERT1 MEFs expressing the empty vector (EV) or the indicated MYC-Trf2 alleles 73 h after 4-OHT-mediated deletion of endogenous TRF2. TIFs are detected by immunofluorescence with antibodies for γ-H2AX (red) and the Telomeres-specific probe Alexa488-OO-(TTAGG)3 (green). Bars represent 10 μm. (e) Quantification of the percentage of TIFs as in (d). Median bars from 600 nuclei over n = 4 independent experiments (150 nuclei per experiment per conditions). Statistical analysis by Kruskal-Wallis Anova test for multiple comparisons. (f) Growth curve showing cumulative population doublings in SV40LT-immortalized Trf2F/FRsCre-ERT1 MEFs expressing the empty vector (EV), in grey, or the indicated MYC-Trf2 alleles: WT in black, ΔiDDR in green, F120A in orange or F120AΔiDDR in purple. 4-OHT was added at time 0. One representative experiment is shown. Source data
Extended Data Fig. 4
Extended Data Fig. 4. The iDDR prevents Apollo-independent nucleolytic processing of leading-end telomeres independently from 53BP1.
(a) Telomeric overhang assay and quantification from one representative experiment in SV40LT-immortalized Trf2F/F 53BP1-/- RsCre-ERT1 MEFs expressing the indicated MYC-Trf2 alleles at 96 h after 4-OH tamoxifen (4-OHT)-mediated deletion of endogenous TRF2. For each allele, the normalized no Cre value was set to 1, and the + Cre value was given relative to it. (b) and (c) Telomeric overhang assay and quantification of ApolloF/F and ApolloF/F 53BP1−/− MEFs 96 h after Hit & Run Cre-mediated deletion of Apollo as described in (a) and (b), with means and SDs across three independent experiments. Statistical analysis by two-way ANOVA. Source data
Extended Data Fig. 5
Extended Data Fig. 5. The iDDR is predicted to interact with Rad50 in several metazoan.
(a) Representative Predicted Aligned Error (PAE; top) of TRF2 with Mre11 (left), Nbs1 (middle), and CtIP (right) from AlphaFold-Multimer models and predicted local distance difference test (pLDDT; bottom) for each residue in TRF2 from five ranked models generated with default parameters. (b) Representative Predicted Aligned Error (PAE) for the interaction between TRF2 and Rad50 in representative vertebrates. (c) Representative Predicted Aligned Error (PAE) for the interaction between TRF and Rad50 in representative invertebrates.
Extended Data Fig. 6
Extended Data Fig. 6. The iDDR of TRF2 and the MIN domains of Rif2 and Taz1 are an example of convergent evolution.
(a) Schematic for telomere binding proteins in H. sapiens, S. pombe, and S. cerevisiae with TRF2, Taz1, Rif2 highlighted in purple. (b) AlphaFold-Multimer Predicted Aligned Error (PAE; top; representative of five ranked models generated with default parameters) plot for S. cerevisiae Rif2 and Rad50 and predicted Local Distance Difference Test (pLDDT; bottom) plot for each residue in Rif2 from the ranked models.(c) AlphaFold-Multimer PAE (top; representative of five ranked models generated with default parameters) plot for S. pombe Taz1 and Rad50 and pLDDT (bottom) plot for across Taz1 from the ranked models. (d) Representative AlphaFold-Multimer models of TRF2-Rad50 (left), Rif2-Rad50 (middle), and Taz1-Rad50 (right). Acidic (red) and basic (blue) residues are highlighted. (e) MUSCLE alignment of the iDDR domains from representative metazoans, highlighting the presence of basic residues (blue) followed by acidic residues (red). (f) Phylogenetic tree of Opisthokonts showing the emergence of the iDDR of TRF proteins (blue) as well as the MIN of Taz1 (green) and the MIN (or BAT) of Rif2/Orc4 (red). Whether other Opisthokonts independently evolved an iDDR-like motif is unknown. Not to scale.
Extended Data Fig. 7
Extended Data Fig. 7. CtIP, Sae2, and Ctp1 are all predicted to interact with Rad50 in a similar manner.
(a) Multiple Sequence Alignment (MSA) of CtIP proteins from vertebrate and invertebrate species using NCBI MSA Viewer from an alignment using Multiple Sequence Comparison by Log-Expectation (MUSCLE). Vertical lines are colored by conservation where red indicates highly conserved and blue indicates lower conservation. Alignment positions with gaps are not colored. (b) Representative AlphaFold-Multimer models for CtIP-Rad50, Sae2-Rad50, and Ctp1-Rad50. Important CDK and ATM/Tel1 sites are indicated as well as the residue in the ATM site position on Ctp1. (c) AlphaFold-Multimer Predicted Aligned Error (PAE; top; representative of five ranked models generated with default parameters) plot for S. cerevisiae Sae2-Rad50 and predicted Local Distance Difference Test (pLDDT; bottom) plot across Sae2 from the ranked models. (d) Representative AlphaFold-Multimer models for CtIP-Rad50, Sae2-Rad50, and Ctp1-Rad50. Important CDK and ATM/Tel1 sites are indicated as well as the residue in the ATM site position on Ctp1.

References

    1. de Lange T. Shelterin-mediated telomere protection. Annu. Rev. Genet. 2018;52:223–247. doi: 10.1146/annurev-genet-032918-021921. - DOI - PubMed
    1. Symington LS. Mechanism and regulation of DNA end resection in eukaryotes. Crit. Rev. Biochem. Mol. Biol. 2016;51:195–212. doi: 10.3109/10409238.2016.1172552. - DOI - PMC - PubMed
    1. Khayat F, et al. Inhibition of MRN activity by a telomere protein motif. Nat. Commun. 2021;12:3856. doi: 10.1038/s41467-021-24047-2. - DOI - PMC - PubMed
    1. Marsella A, et al. Sae2 and Rif2 regulate MRX endonuclease activity at DNA double-strand breaks in opposite manners. Cell Rep. 2021;34:108906. doi: 10.1016/j.celrep.2021.108906. - DOI - PMC - PubMed
    1. Roisné-Hamelin F, et al. Mechanism of MRX inhibition by Rif2 at telomeres. Nat. Commun. 2021;12:2763. doi: 10.1038/s41467-021-23035-w. - DOI - PMC - PubMed

Publication types