. 2023 Sep;29(9):2295-2306.
doi: 10.1038/s41591-023-02491-5. Epub 2023 Aug 31.

Mechanisms of antigen escape from BCMA- or GPRC5D-targeted immunotherapies in multiple myeloma

Affiliations

Mechanisms of antigen escape from BCMA- or GPRC5D-targeted immunotherapies in multiple myeloma

Holly Lee et al. Nat Med. 2023 Sep.

Abstract

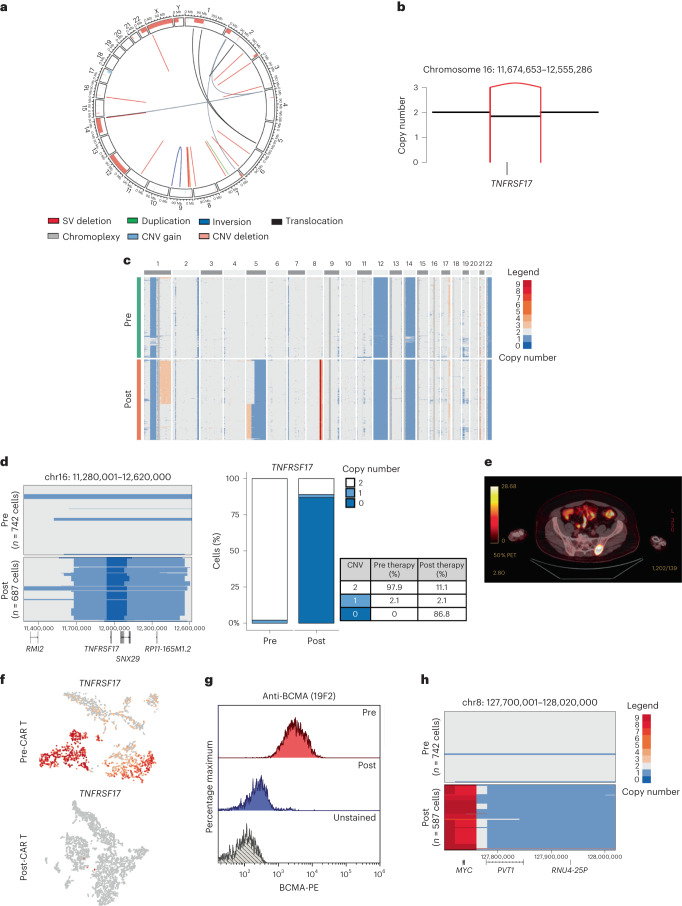
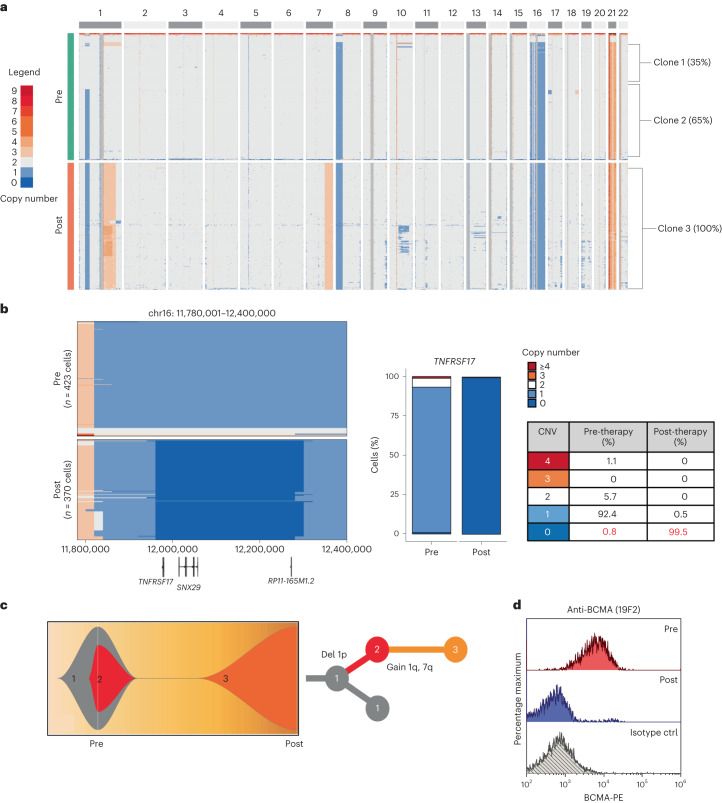
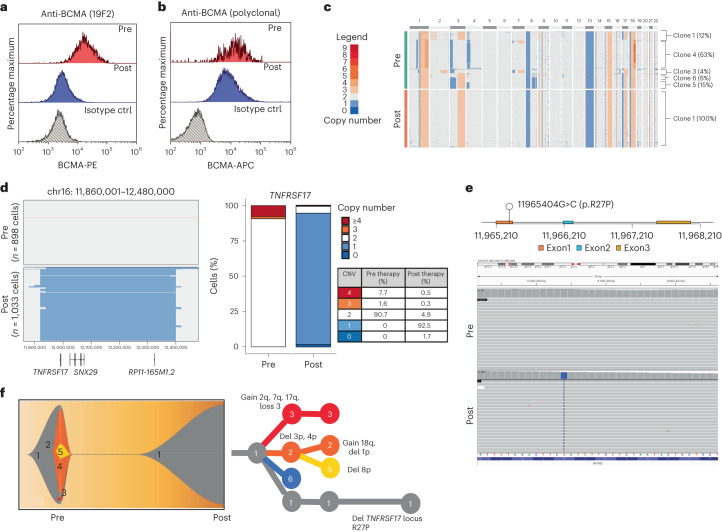
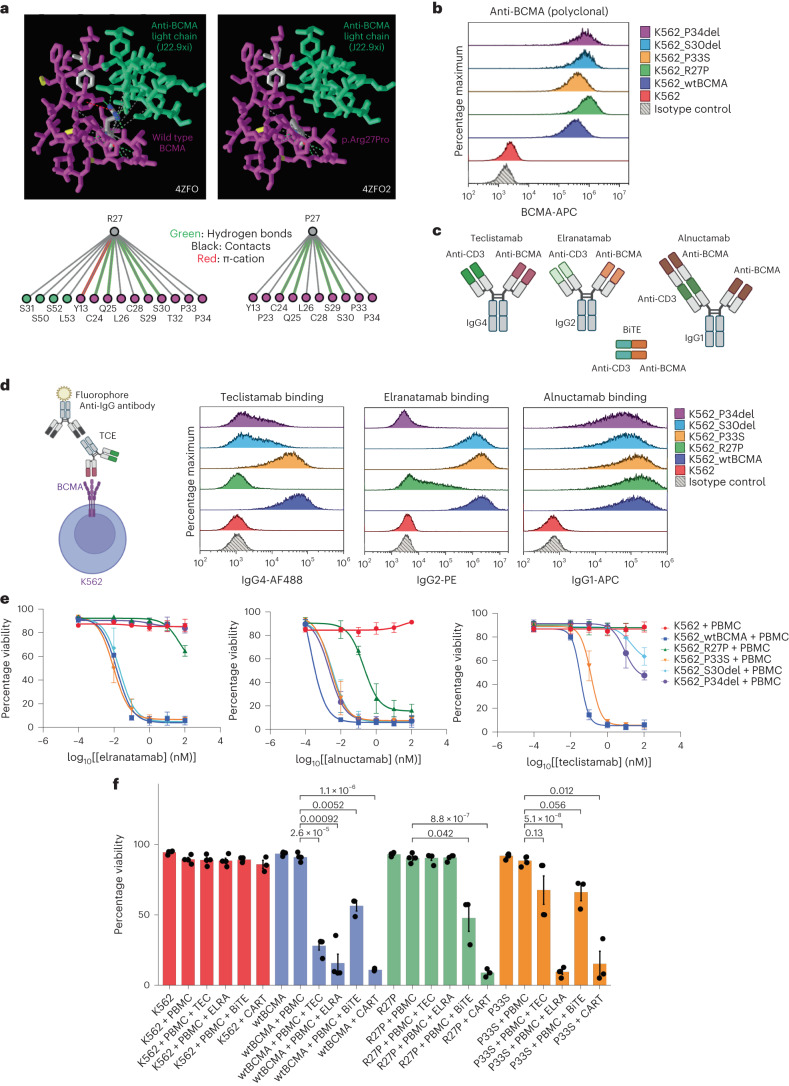
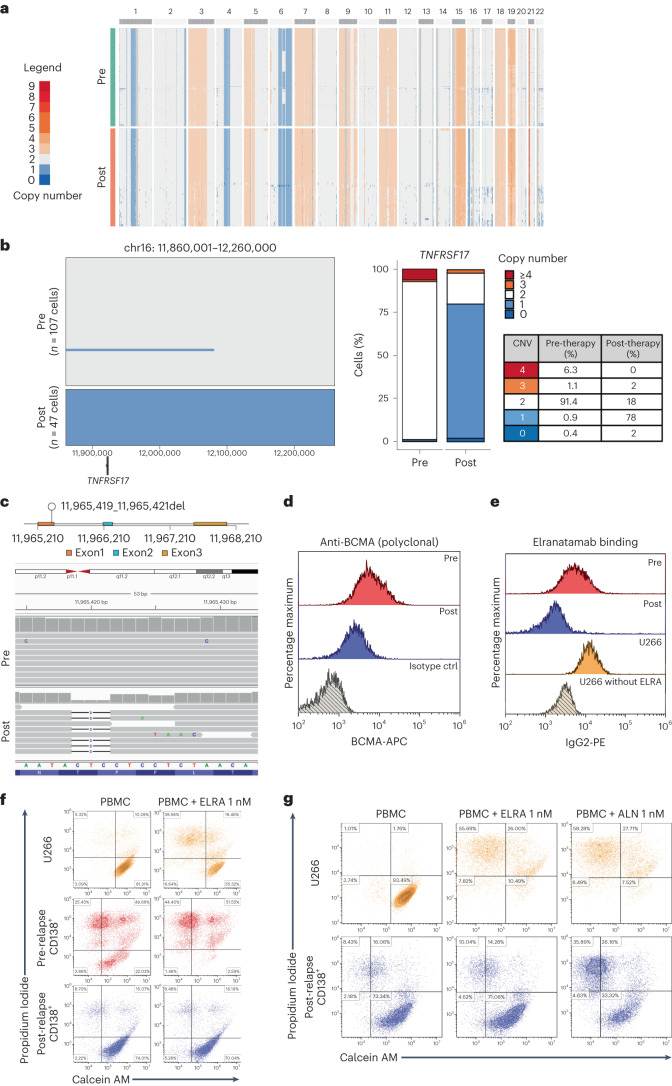
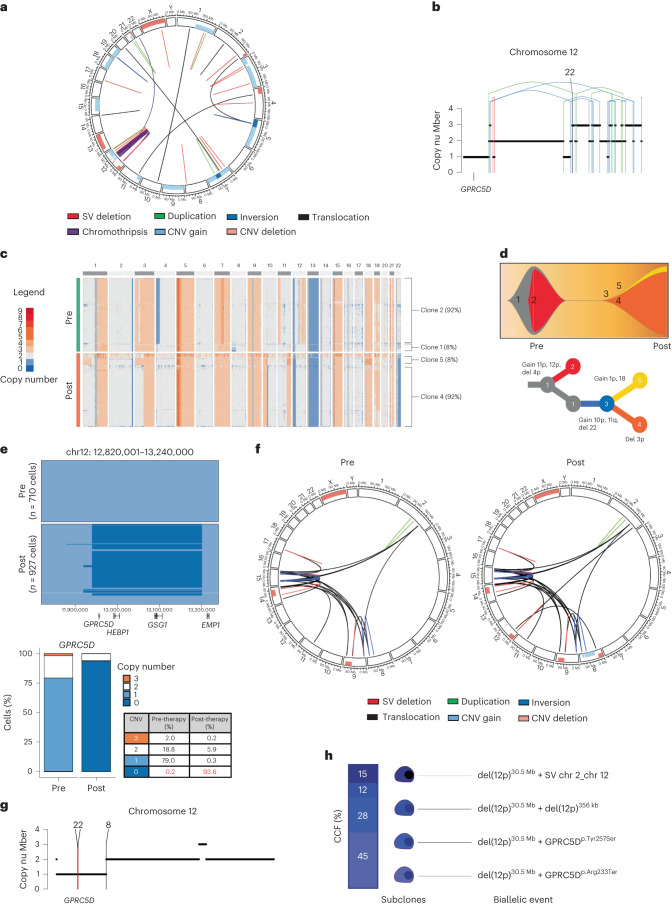
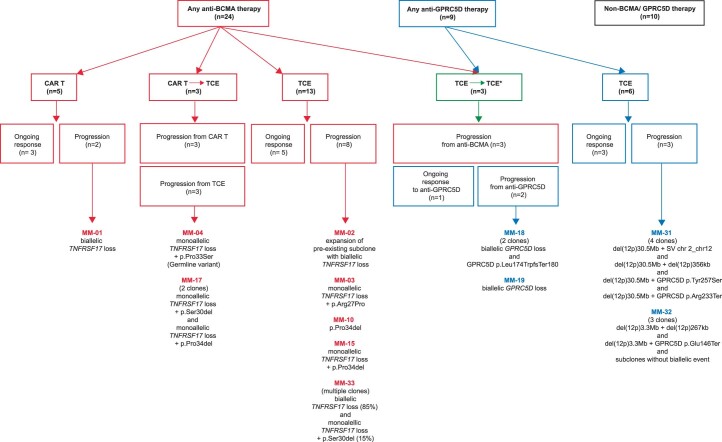
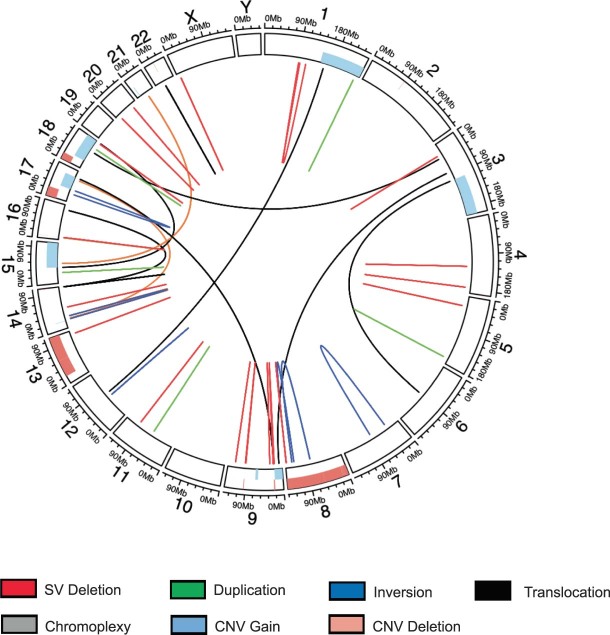
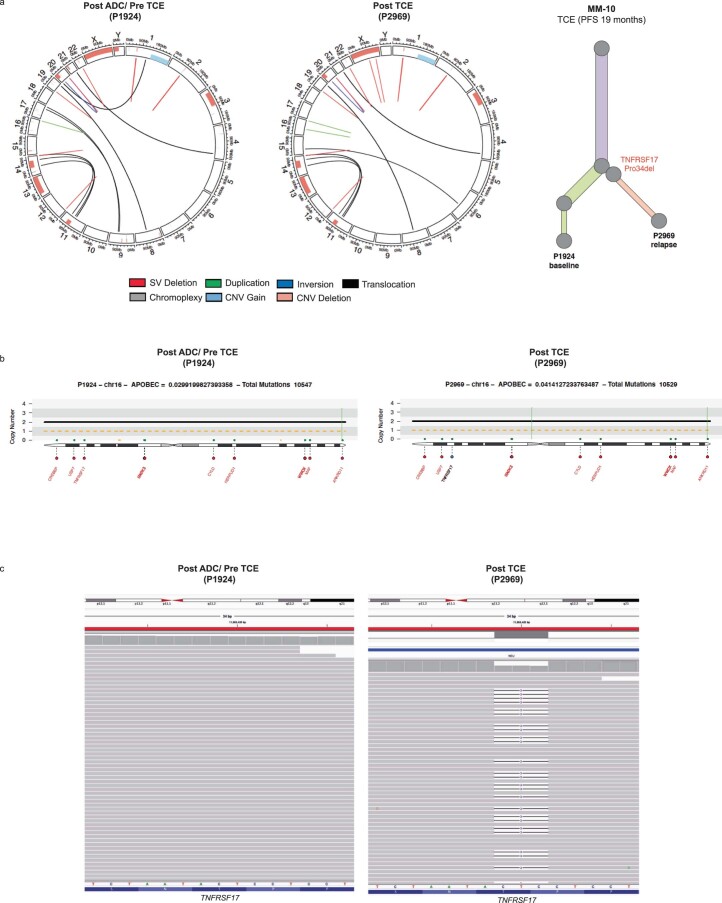
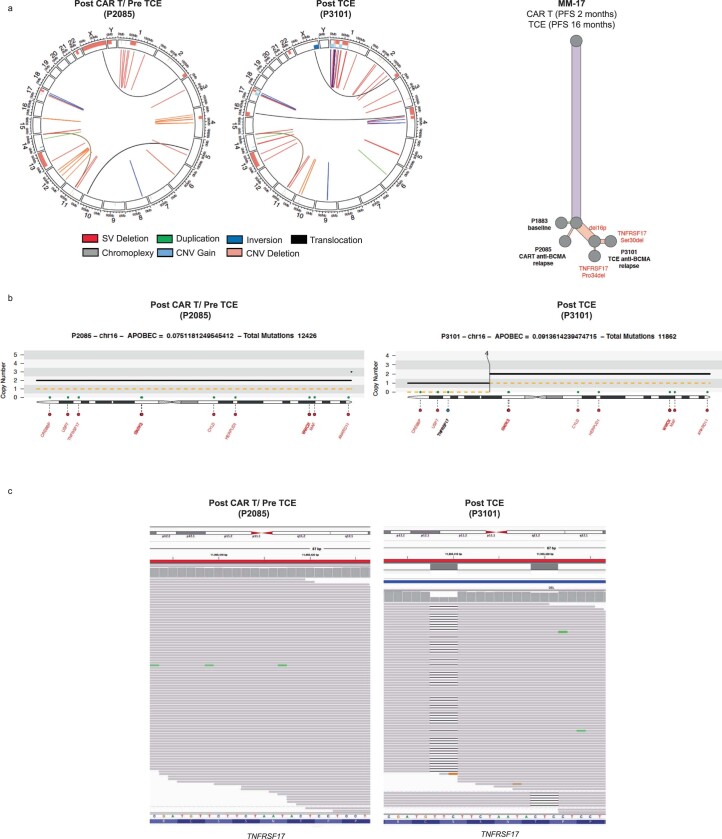
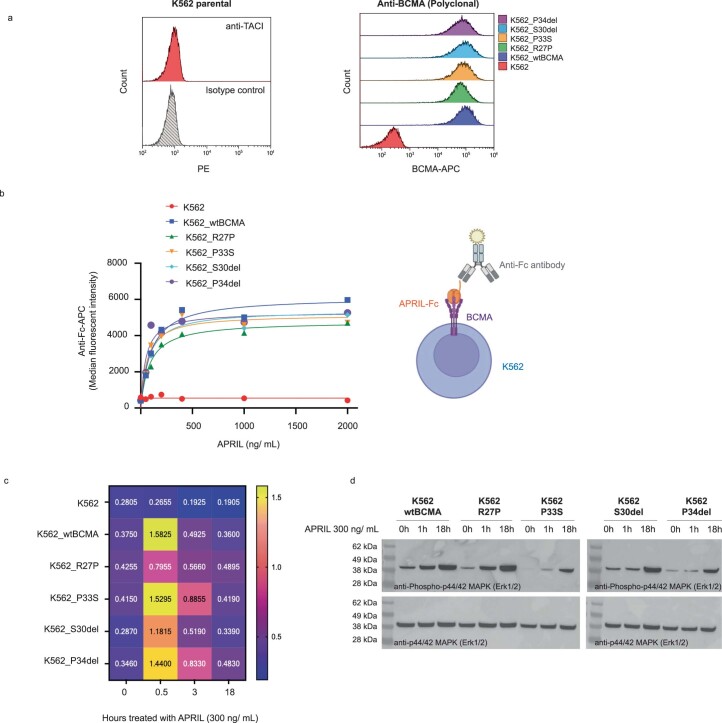
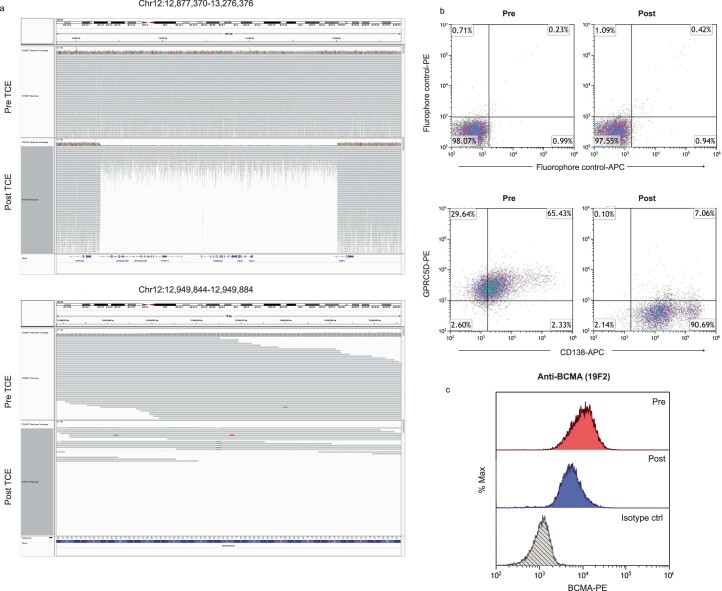
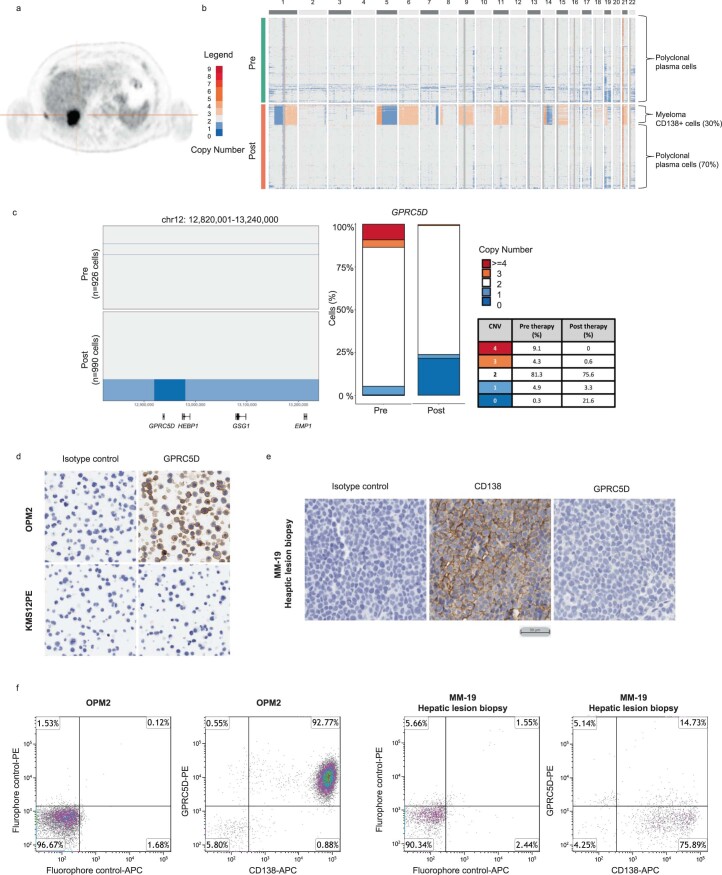
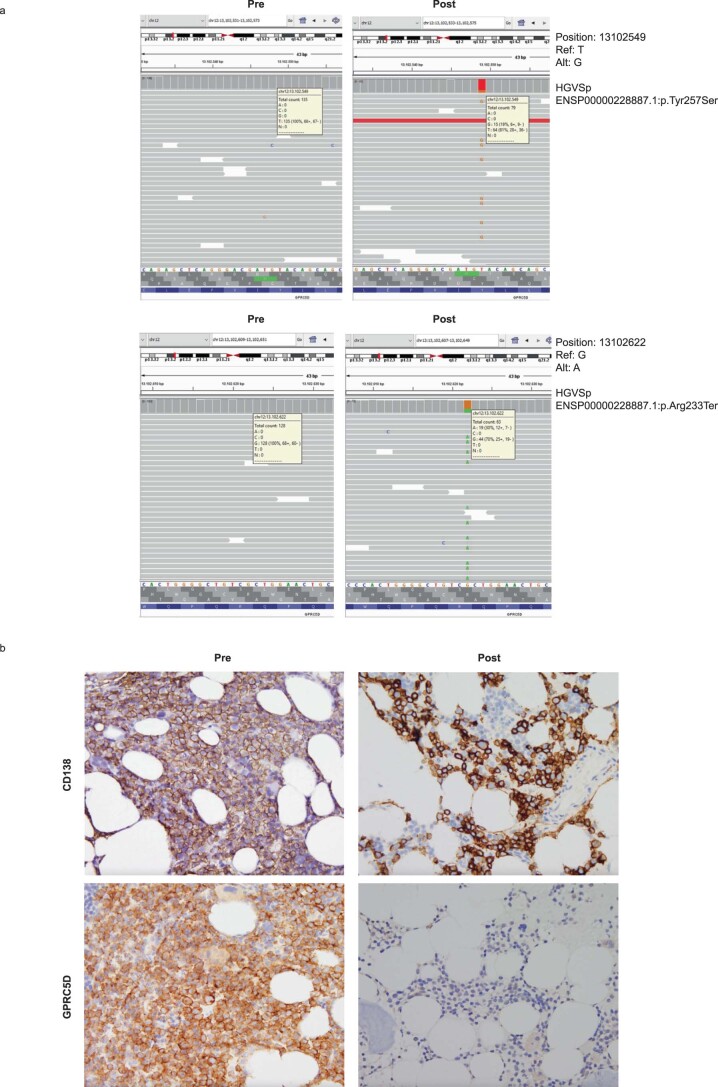
B cell maturation antigen (BCMA) target loss is considered to be a rare event that mediates multiple myeloma (MM) resistance to anti-BCMA chimeric antigen receptor T cell (CAR T) or bispecific T cell engager (TCE) therapies. Emerging data report that downregulation of G-protein-coupled receptor family C group 5 member D (GPRC5D) protein often occurs at relapse after anti-GPRC5D CAR T therapy. To examine the tumor-intrinsic factors that promote MM antigen escape, we performed combined bulk and single-cell whole-genome sequencing and copy number variation analysis of 30 patients treated with anti-BCMA and/or anti-GPRC5D CAR T/TCE therapy. In two cases, MM relapse post-TCE/CAR T therapy was driven by BCMA-negative clones harboring focal biallelic deletions at the TNFRSF17 locus at relapse or by selective expansion of pre-existing subclones with biallelic TNFRSF17 loss. In another five cases of relapse, newly detected, nontruncating, missense mutations or in-frame deletions in the extracellular domain of BCMA negated the efficacies of anti-BCMA TCE therapies, despite detectable surface BCMA protein expression. In the present study, we also report four cases of MM relapse with biallelic mutations of GPRC5D after anti-GPRC5D TCE therapy, including two cases with convergent evolution where multiple subclones lost GPRC5D through somatic events. Immunoselection of BCMA- or GPRC5D-negative or mutant clones is an important tumor-intrinsic driver of relapse post-targeted therapies. Mutational events on BCMA confer distinct sensitivities toward different anti-BCMA therapies, underscoring the importance of considering the tumor antigen landscape for optimal design and selection of targeted immunotherapies in MM.


Conflict of interest statement

N.J.B. has received research funding from Pfizer and speaker’s bureau honoraria from Amgen, BMS, Sanofi, Pfizer and Janssen; he is a consultant/advisory board member for BMS, Janssen and Pfizer. P.N. received speaker’s bureau honoraria from BMS, Janssen and Sanofi, and is a consultant/advisory board member for BMS and Janssen. C.H. and T.H. have equity ownership of MLL Munich Leukemia Laboratory. O.L. has received research funding from: the National Institutes of Health (NIH), NCI, US Food and Drug Administration, MMRF, International Myeloma Foundation, Leukemia and Lymphoma Society, the Paula and Rodger Riney Myeloma Foundation, Perelman Family Foundation, Rising Tide Foundation, Amgen, Celgene, Janssen, Takeda, Glenmark, Seattle Genetics and Karyopharm; received honoraria and is on advisory boards for Adaptive, Amgen, Binding Site, BMS, Celgene, Cellectis, Glenmark, Janssen, Juno and Pfizer; and serves on independent data monitoring committees for clinical trials led by Takeda, Merck, Janssen and Theradex. J.J.K has received research funding from Amgen, Genentech and Janssen, and has received honoraria and is on advisory boards for Janssen. The other authors declare no competing interests.

Figures

Fig. 1
Fig. 1. Focal biallelic loss of TNFRSF17 in patient MM-1 after anti-BCMA CAR T therapy.
a, Pre-therapy circos plot of patient MM-1 based on WGS. The outer track runs clockwise from chromosome 1 to Y. The inner track shows CNVs (gains in light blue and losses in salmon). The lines inside the circle represent SVs (deletions in red, duplications in green, inversions in blue and interchromosomal translocations in black). b, A CN and SV plots showing the subclonal loss of TNFRSF17 mediated by a focal deletion (red line). c, ScCNV-seq heatmap comparing the CN changes in chromosomes 1–22 in pre-therapy (pre) versus post-relapse (post) CD138+ MM cells. d, Pre-therapy versus post-relapse CD138+ CN alteration at TNFRSF17 locus based on scCNV-seq. The barplot and table compare the percentages of cells harboring the CNVs in pre- versus post-CAR T/TCE relapse samples. e, Positron emission tomography scan of patient demonstrating left sacral ala relapse after anti-BCMA CAR T therapy. f, Uniform Manifold Approximation and Projection showing the distribution of CD138+ cells collected pre- and post-relapse using scRNA-seq. The cells are marked based on the gene expression of TNFRSF17 (expression in red and no expression in gray). g, Pre- versus post-relapse CD138+ BCMA protein expression (by monoclonal anti-BCMA antibody (clone 19F2)) using flow cytometry. h, CN alterations at MYC locus in pre- versus post-relapse CD138+ MM cells based on scCNV-seq.
Fig. 2
Fig. 2. Pre-existing clone with biallelic TNFRSF17 deletion drives MM relapse after anti-BCMA TCE therapy in patient MM-2.
a, ScCNV-seq heatmap comparing the CN changes in chromosomes 1–22 in pre-therapy (pre) versus post-relapse (post) CD138+ MM cells. b, Pre-therapy and post-relapse CD138+ CN alteration at TNFRSF17 locus based on scCNV-seq. The barplot and table compare the percentages of cells harboring the CNVs in pre- versus post-CAR T/ TCE relapse samples. c, Fish plot of clonal phylogeny of the CD138+ cells at pre-therapy versus post-relapse timepoints inferred from scCNV-seq data. The associated tree illustrates the main alterations differentiating each clone. d, Pre- versus post-relapse CD138+ BCMA protein expression (by monoclonal anti-BCMA antibody, clone 19F2) using flow cytometry. ctrl, control.
Fig. 3
Fig. 3. Monoallelic TNFRSF17 deletion coupled with p.Arg27Pro mutation in the extracellular domain of BCMA mediates MM relapse after anti-BCMA TCE therapy in patient MM-3.
a, Pre-therapy versus post-relapse CD138+ MM cell BCMA protein expression by flow cytometry using monoclonal anti-BCMA antibody (clone 19F2). b, Pre-therapy versus post-relapse CD138+ BCMA protein expression level by flow cytometry using polyclonal anti-BCMA antibody. c, ScCNV-seq heatmap comparing the CN changes in chromosomes 1–22 in pre-therapy (pre) versus post-relapse (post) CD138+ MM cells. d, Pre-therapy and post-relapse CD138+ CN alteration at the TNFRSF17 locus based on scCNV-seq. The barplot and table compare the percentages of cells harboring the CNVs in pre- versus post-CAR T/TCE relapse samples. e, Lollipop plot illustrating the 11965404G>C mutation in exon 1 of the TNFRSF17 gene. Integrated Genomics Viewer (IGV) screenshot illustrating newly detected clonal point mutation in post-relapse CD138+ MM cells. f, Fish plot of clonal phylogeny of the CD138+ cells at pre-therapy versus post-relapse timepoints inferred from scCNV-seq data. The associated phylogenetic tree illustrates the main alterations differentiating each clone.
Fig. 4
Fig. 4. Mutation in the BCMA extracellular domain abrogates TCE binding and TCE-mediated target cell death.
a, Publicly deposited crystal structure (PDB, accession no. 4ZFO) by Marino et al. representing the interaction between wild-type or p.Arg27Pro BCMA and J22.9-xi light chain. It was analyzed using the Macromolecular Structures Resource Group. b, BCMA protein expression in the established K562 cell lines using polyclonal anti-BCMA antibodies by flow cytometry. c, Illustration of the structures of anti-BCMAxCD3ε TCEs screened in the present study. The figure was created with BioRender. d, TCE-binding assay. The figure was created with BioRender. K562 cell lines were incubated with teclistamab, elranatamab or alnuctamab (10 nM) followed by secondary anti-IgG flow antibody staining. e, TCE dose response curve (DRC). K562 target cell viability 48 h after co-culture with healthy donor PBMCs at an effector:target ratio of 10:1. K562 cells were pre-stained with CTV and cell viability was assessed by staining with calcein AM and PI for flow cytometry assessment. The TCE doses range from 0.01 nM to 100 nM. Data are presented as mean ± s.d. The samples are biologically independent (n = 3 for all cell lines). f, Barplot showing percentage viability of K562 48 h after co-culture with healthy donor PBCMs at an effector:target ratio of 10:1 with or without the respective TCEs (0.1 nM) or BiTE (5.4 nM) as indicated. Co-culture with anti-BCMA CAR T was performed at an effector:target ratio of 1:1. The x axis corresponds to the experimental conditions. The samples shown are biologically independent for K562 alone (n = 4), K562 + PBMCs (n = 4), K562 + PBMCs + TEC (n = 4), K562 + PBMCs + ERLA (n = 4), K562 + PBMCs + BiTE (n = 3) and K562 + PBMCs + CAR T (n = 3). The Student’s t-test was performed on each grouped sample (each K562 cell line) without adjustments for multiple comparisons using the R function pairwise.t.test() to generate P values. Absolute P values are provided in Supplementary Table 8. Data are presented as mean ± s.d. Source data
Fig. 5
Fig. 5. Monoallelic TNFRSF17 deletion coupled with deletion of Pro34 in the BCMA extracellular domain mediates MM relapse after anti-BCMA TCE therapy in patient MM-15.
a, ScCNV-seq heatmap comparing the CN changes in chromosomes 1–22 in pre-therapy (pre) versus post-relapse (post) CD138+ MM cells. b, Pre-therapy and post-relapse CD138+ CN alteration at TNFRSF17 locus based on scCNV-seq. The barplot and table compare the percentages of cells harboring the CNVs in pre- versus post-CAR T/TCE relapse samples. c, Lollipop plot illustrating the 11965419_11965421del in exon 1 of TNFRSF17 gene. The IGV screenshot illustrates newly detected clonal point mutations in post-relapse CD138+ MM cells. Deletion of 3 bp (chr16: g.11,965,419–11,965,421del) in exon 1 of TNFRSF17 was detected in the post-relapse CD138+ MM sample. This in-frame deletion removes the last two nucleotides of the Thr32 codon and the first nucleotide of the Pro33 codon. This results in retention of Thr32 but deletion of one of the two consecutive proline residues. d, Pre- versus post-relapse CD138+ BCMA protein expression (by polyclonal anti-BCMA antibody) using flow cytometry. e, Pre- or post-relapse patient primary CD138+ cells or U266 MM cell lines incubated with elranatamab (1 nM) followed by secondary flow antibody staining with anti-IgG2 flow antibody. f, Flow cytometry contour with density plot, gated on CTV-positive cells. Patient MM-15’s pre- versus post-relapse CD138+ MM cells or U266 cell line was pre-stained with CTV and co-cultured with patient autologous PBMCs at an effector:target ratio of 10:1, with or without elranatamab (1 nM). The target cell viability is shown at 24 h after co-culture. g, Flow cytometry contour with density plot, gated on CTV-positive cells. Patient’s post-relapse CD138+ MM cell and U266 cell line viability shown at 48 h after co-culture with autologous PBMCs (effector:target = 10:1) with elranatamab 1 nM or alnuctamab 1 nM.
Fig. 6
Fig. 6. GPRC5D biallelic loss mediates MM relapse after anti-GPRC5D TCE therapy.
a, Pre-therapy circos plot of patient MM-18 based on WGS. The outer track runs clockwise from chromosome 1 to Y. The inner track shows CNVs (gains in light blue and losses in salmon). The lines inside the circle represent SVs (deletions in red, duplications in green, inversions in blue and interchromosomal translocations in black). b, Illustration of chromosome 12 with CN loss of GPRC5D mediated by a chromothripsis event (translocations in black, deletions in red, duplications in green and inversions in blue) (patient MM-18). c, ScCNV-seq heatmap comparing the CN changes in chromosomes 1–22 in pre-therapy (pre) versus post-relapse (post) CD138+ MM cells (patient MM-18). d, Fish plot of clonal phylogeny of the CD138+ cells at pre-therapy versus post-relapse timepoints inferred from scCNV-seq data. The associated tree illustrates the main alterations differentiating each clone (patient MM-18). e, Pre-therapy versus post-relapse CD138+ CN alteration at the GPRC5D locus based on scCNV-seq. The barplot and table compare the percentages of cells harboring the CNVs in pre- versus post-TCE relapse samples (patient MM-18). f, MM-31 circos plot of WGS data with CNVs and SVs pre-talquetamab treatment and at relapse post-talquetamab treatment. The outer track runs clockwise from chromosome 1 to Y. The inner track shows CNVs (gains in light blue and losses in salmon). The lines inside the circle represent SVs (deletions in red, duplications in green, inversions in blue and interchromosomal translocations in black). g, Illustration of chromosome 12 CNVs and SVs in GPRC5D from WGS (patient MM-31). h, Illustration of cancer cell fractions and subclonal events in the short arm of chromosome 12, resulting in biallelic GPRC5D alteration at relapse (patient MM-31).
Extended Data Fig. 1
Extended Data Fig. 1. Summary of study patient cohort (n = 40).
Diagram illustrates number of patients treated per type of therapy and lists cases with antigen escape in each treatment group. * denotes sequential therapies with anti-BCMA and anti-GPRC5D TCE.
Extended Data Fig. 2
Extended Data Fig. 2. Case MM-01 sacral plasmacytoma and bone marrow biopsy at progressive disease.
(a) Immunohistochemistry stain of CD138 and BCMA expression on biopsy sample of left sacral ala extramedullary plasmacytoma at relapse. (b, c) t-distributed stochastic neighbor embedding (tSNE) plot of the distribution of CD3+ cells at pre- (b) and post-relapse (c) using scRNA. The cells are marked based on the gene expression of CD3ε and scFv-CAR chimeric gene transcript. Pre-sample was collected on day 28 post anti-BCMA CAR T infusion (corresponds to P1800 in Supplementary Table 1) and post-relapse sample was collected on day 202 post CAR T infusion (P1894).
Extended Data Fig. 3
Extended Data Fig. 3. Pre-therapy circos plot of patient MM-03 based on WGS.
Outer track runs clockwise from chromosome 1 to Y. Inner track shows CNVs (gains in light blue, losses in salmon). Lines inside the circle represent structural variations (SV) with deletions in red, duplications in green, inversions in blue, interchromosomal translocations in black, and chromoplexy in grey.
Extended Data Fig. 4
Extended Data Fig. 4. BCMA wild type and mutant K562 cell cytotoxicity assay, soluble BCMA, and protein stability assay.
K562 target cells were pre-stained with CellTrace Violet (CTV) prior to co-culture. Panels (a) and (b) represent representative cytotoxicity assays flow cytometry contour with density plots gated on CTV positive cells. In panel (a), target cells were co-cultured with healthy donor PBMCs at 10:1 effector to target (E:T) ratio ± Teclistamab 1 nM (TEC), Elranatamab 1 nM (ELRA), Alnuctamab 1 nM (ALN), anti-BCMAxCD3 BPS 5.4 nM (BiTE), or isotype control antibody 1 nM (isoctrl). In panel (b), target cells were co-cultured with healthy donor PBMC (E:T = 10:1) ± TCE at 0.1 nM doses or co-cultured with or anti-BCMA CAR T (E:T = 1:1). (c) Soluble BCMA measurement from the supernatant of K562 cell line cultures using sBCMA DuoSet kit. The cell lines were cultured at 1 × 106 cells/ mL ± 6.2 nM gamma secretase inhibitor (GSI) overnight. P-values were generated by t-test comparing each condition to wtBCMA_no_GSI using the R function pairwise.t.test() without adjustments for multiple comparisons. Box plot illustrates median (horizontal line through box), upper hinge (75th percentile, Q3), lower hinge (25th percentile, Q1). Upper hinge extends to Q3 + 1.5 x interquartile range (IQR). Lower hinge whisker extends to Q1-1.5 x IQR. N = 3 biologically independent samples. (d) Surface BCMA expression in K562 or U266 cell lines by polyclonal anti-BCMA antibody by flow cytometry. Cells were treated with or without 6.2 nM GSI overnight. (e) Western blot of cycloheximide chase experiment for estimation of BCMA protein stability. K562 cell lines were treated with or without 10 ug/mL of cycloheximide (CHX) for the indicated times. Cell lysates were collected for western blot for V5 tagged BCMA and GAPDH. Source data
Extended Data Fig. 5
Extended Data Fig. 5. Case MM-10 demonstrates p.Pro34del MM clone at relapse.
(a) Pre-therapy (pre ADC and pre TCE, sample number P1924) versus post-relapse (post TCE, P2969) circos plot of patient MM-10 based on WGS. Outer track runs clockwise from chromosome 1 to Y. Inner track shows CNVs (gains in light blue, losses in salmon). Lines inside the circle represent SVs (deletions in red, duplications in green, inversions in blue, interchromosomal translocations in black, and chromoplexy in grey). Clonal phylogeny inferred from WGS data. (b) Copy number and structural variations at TNFRSF17 locus. Translocations are represented in black, deletions in red, duplications in green, and inversions in blue. (c) IGV screenshot of pre-therapy versus post-relapse samples, illustrating newly detected p.Pro34del in post-relapse CD138 + MM cells.
Extended Data Fig. 6
Extended Data Fig. 6. Newly detected p.Pro34del and p.Ser30del BCMA in MM clones at relapse in case MM-17.
(a) Pre-therapy (post CAR T and pre TCE, sample number P2085) versus post-relapse (post TCE, P3101) circos plot based on WGS. Outer track runs clockwise from chromosome 1 to Y. Inner track shows CNVs (gains in light blue, losses in salmon). Lines inside the circle represent SVs (deletions in red, duplications in green, inversions in blue, interchromosomal translocations in black, and chromoplexy in grey). Clonal phylogeny inferred from WGS data. (b) Copy number and structural variations at TNFRSF17 locus. Translocations in black, deletions in red, duplications in green, inversions in blue. (c) IGV screenshot of pre- versus post-relapse CD138+ cells, illustrating newly detected p.Pro34del and p.Ser30del at relapse.
Extended Data Fig. 7
Extended Data Fig. 7. APRIL binding and NFkB signaling in BCMA wild type and mutant K562 cell lines.
(a) First histogram shows TACI expression in K562 cell line and second panel shows transgenic BCMA expression in K562 cell lines by flow cytometry. (b) Dose response curve for APRIL binding. K562 cell lines expressing wild type or mutant BCMA were incubated with Fc tagged APRIL trimer at indicated doses followed by anti-Fc APC flow antibody staining. (c) NFkB p65 ELISA was performed using nuclear extracts from K562 cell lines treated with APRIL (300 ng/ mL) for the indicated time points. (d) Western blot for phosphorylated and total ERK was performed using total cell lysates from K562 cell lines treated with APRIL (300 ng/ mL) for indicated time points. Source data
Extended Data Fig. 8
Extended Data Fig. 8. Case MM-18 WGS and flow cytometry analysis.
(a) IGV screenshot of pre- versus post-relapse CD138+ cells sorted by insert size showing deletions of 272 kilobases (chr12:12,928,352-13,200,487) at GPRC5D locus on chromosome 12 (top panel) based on WGS. Bottom panel depicting residual reads with frameshift deletion in 5 out of 11 reads (chr12: g.12,949,864delG) resulting in early stop codon and truncation of GPRC5D (p.Leu174TrpfsTer180). (b, c) Pre- versus post-relapse CD138+ cell flow cytometry analysis demonstrating (b) GPRC5D and (c) BCMA protein expression.
Extended Data Fig. 9
Extended Data Fig. 9. GPRC5D biallelic loss mediates MM relapse post anti-GPRC5D TCE in case MM-19.
(a) Positron emission tomography scan image of hepatic extramedullary relapse post anti-GPRC5D TCE. (b) scCNV heatmap comparing the copy number changes in chromosomes 1-22 in pre-therapy (pre) versus post-relapse (post) CD138 + MM cells. Bone marrow CD138+ cells were predominantly enriched with normal polyclonal plasma cells as evidenced by diploid population. (c) Pre-therapy versus post-relapse CD138+ copy number alteration at GPRC5D locus based on scCNV. Barplot and table comparing the percentages of cells harboring the CNV in pre- versus post-TCE relapse samples. (d, e) Immunohistochemistry (IHC) staining of CD138 and GPCR5D expression on (d) control cell lines OPM2 (positive control) and KMS12PE (negative control) and (e) liver biopsy sample from patient. (f) Flow cytometry assay of CD138 and GPRC5D expression on OPM2 (positive control) and liver biopsy sample from patient. Post relapse CD138+ cell are negative for GPRC5D by both IHC and flow cytometry.
Extended Data Fig. 10
Extended Data Fig. 10. Case MM-31 demonstrates GPRC5D antigen escape post anti-GPRC5D TCE.
(a) IGV screenshot of the pre- versus post-relapse CD138+ cells demonstrating that mutations in GPRC5D (structural variations, copy number variations, single nucleotide variations) were not detected prior to therapy. (b) Immunohistochemistry staining of CD138 and GPRC5D expression in the pre- versus post-relapse bone marrow biopsy samples.

Comment in

References

    1. Caraccio C, Krishna S, Phillips DJ, Schürch CM. Bispecific antibodies for multiple myeloma: a review of targets, drugs, clinical trials, and future directions. Front. Immunol. 2020;11:501. doi: 10.3389/fimmu.2020.00501. - DOI - PMC - PubMed
    1. Shah N, Chari A, Scott E, Mezzi K, Usmani SZ. B-cell maturation antigen (BCMA) in multiple myeloma: rationale for targeting and current therapeutic approaches. Leukemia. 2020;34:985–1005. doi: 10.1038/s41375-020-0734-z. - DOI - PMC - PubMed
    1. Truger MS, et al. Single- and double-hit events in genes encoding immune targets before and after T cell-engaging antibody therapy in MM. Blood Adv. 2021;5:3794–3798. doi: 10.1182/bloodadvances.2021004418. - DOI - PMC - PubMed
    1. Tai YT, Anderson KC. B cell maturation antigen (BCMA)-based immunotherapy for multiple myeloma. Expert. Opin. Biol. Ther. 2019;19:1143–1156. doi: 10.1080/14712598.2019.1641196. - DOI - PMC - PubMed
    1. The UniProt Consortium. UniProt: the Universal Protein Knowledgebase in 2023. Nucleic Acids Res. 10.1093/nar/gkac1052 (2022). - PMC - PubMed

Publication types