. 2023 Aug 31;42(1):223.
doi: 10.1186/s13046-023-02793-z.

Retinoic acid and proteotoxic stress induce AML cell death overcoming stromal cell protection

Affiliations

Retinoic acid and proteotoxic stress induce AML cell death overcoming stromal cell protection

Francesca Liccardo et al. J Exp Clin Cancer Res. .

Abstract

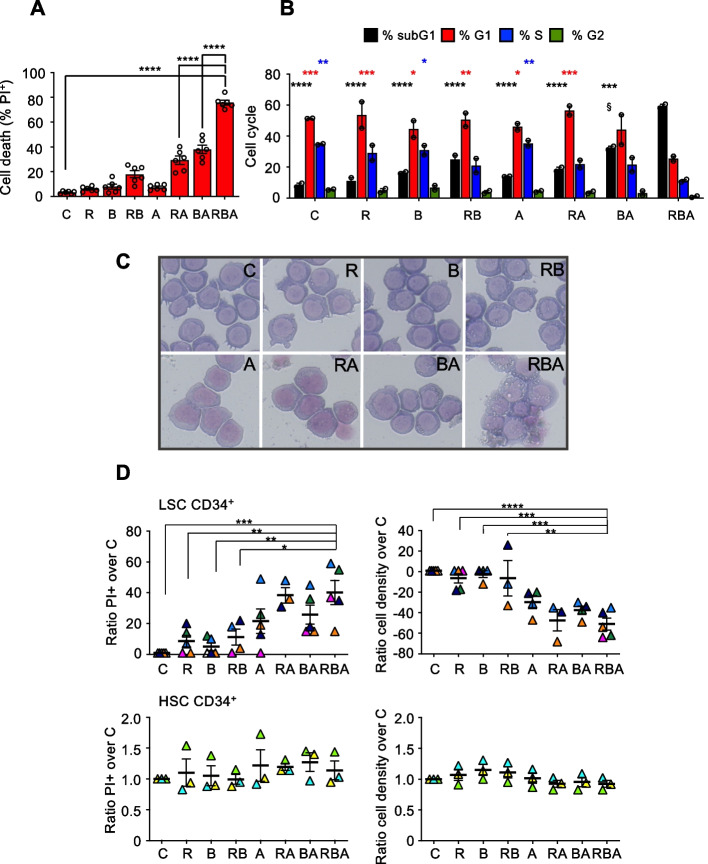
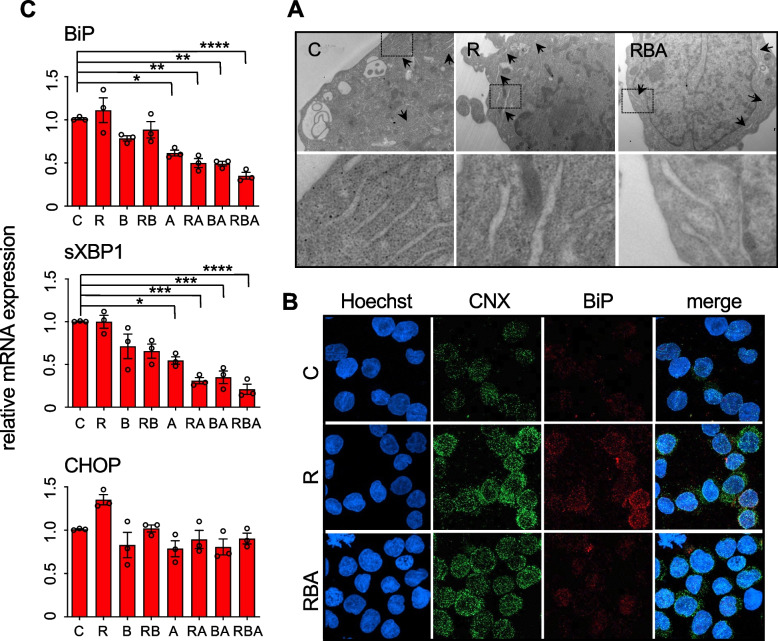
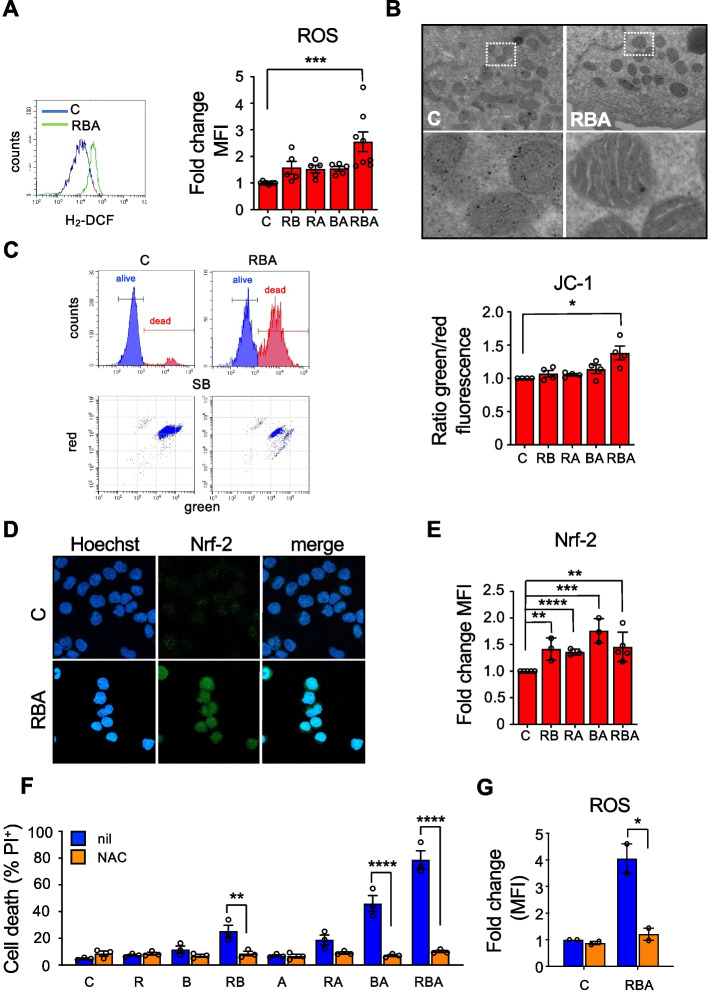
Background: Acute myeloid leukemia (AML) patients bearing the ITD mutation in the tyrosine kinase receptor FLT3 (FLT3-ITD) present a poor prognosis and a high risk of relapse. FLT3-ITD is retained in the endoplasmic reticulum (ER) and generates intrinsic proteotoxic stress. We devised a strategy based on proteotoxic stress, generated by the combination of low doses of the differentiating agent retinoic acid (R), the proteasome inhibitor bortezomib (B), and the oxidative stress inducer arsenic trioxide (A).

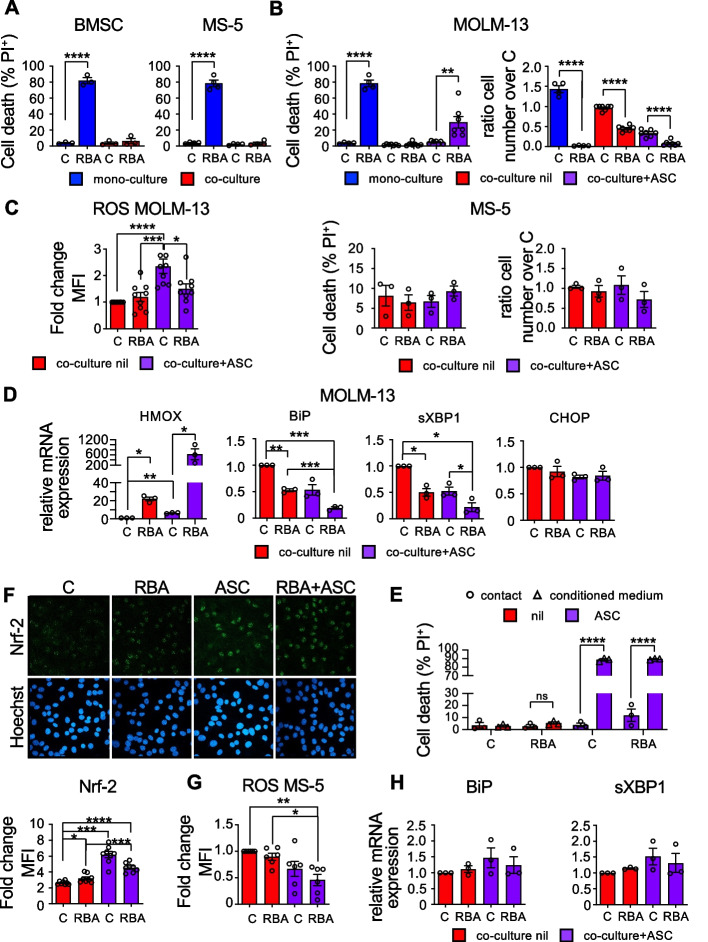
Methods: We treated FLT3-ITD+ AML cells with low doses of the aforementioned drugs, used alone or in combinations and we investigated the induction of ER and oxidative stress. We then performed the same experiments in an in vitro co-culture system of FLT3-ITD+ AML cells and bone marrow stromal cells (BMSCs) to assess the protective role of the niche on AML blasts. Eventually, we tested the combination of drugs in an orthotopic murine model of human AML.

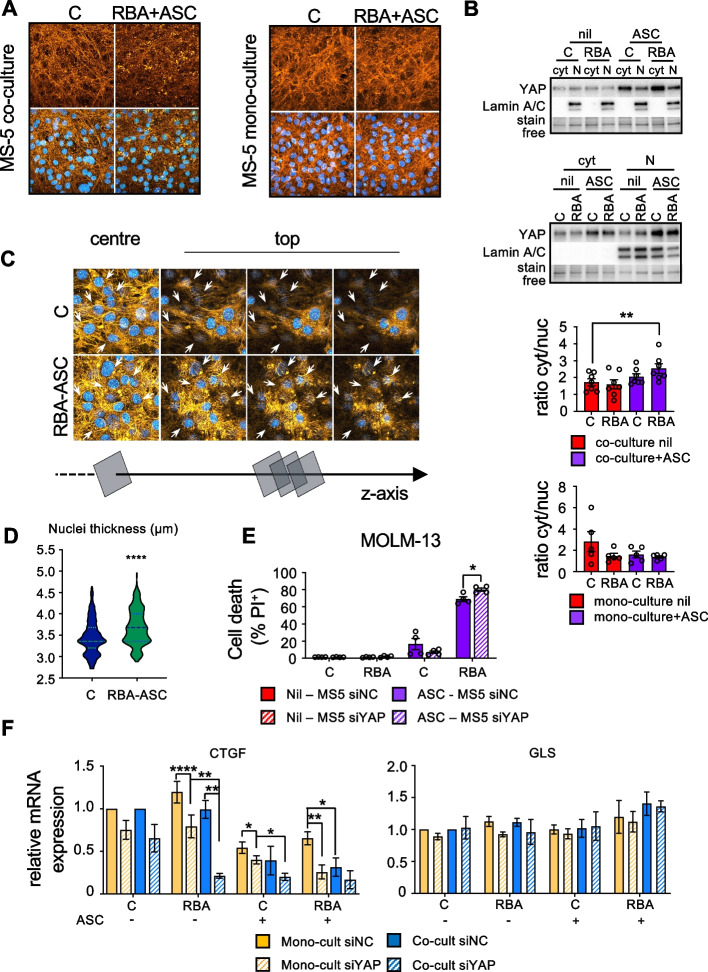
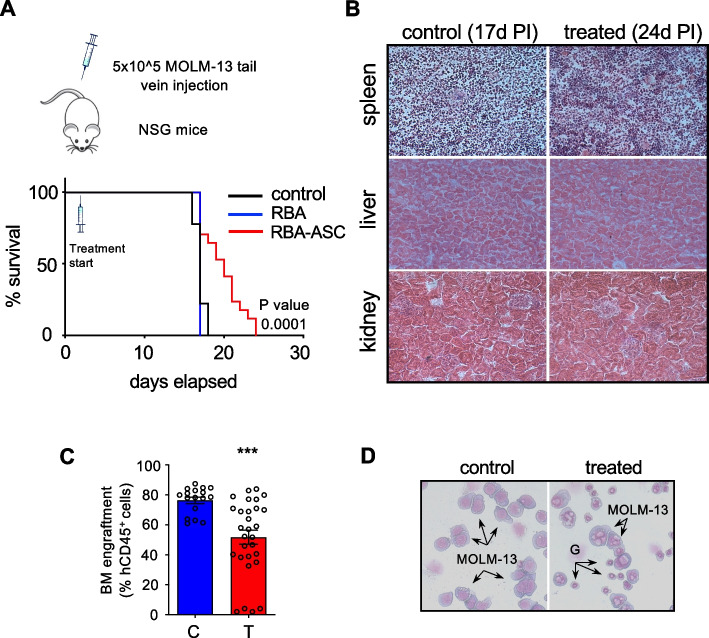
Results: The combination RBA exerts strong cytotoxic activity on FLT3-ITD+ AML cell lines and primary blasts isolated from patients, due to ER homeostasis imbalance and generation of oxidative stress. AML cells become completely resistant to the combination RBA when treated in co-culture with BMSCs. Nonetheless, we could overcome such protective effects by using high doses of ascorbic acid (Vitamin C) as an adjuvant. Importantly, the combination RBA plus ascorbic acid significantly prolongs the life span of a murine model of human FLT3-ITD+ AML without toxic effects. Furthermore, we show for the first time that the cross-talk between AML and BMSCs upon treatment involves disruption of the actin cytoskeleton and the actin cap, increased thickness of the nuclei, and relocalization of the transcriptional co-regulator YAP in the cytosol of the BMSCs.

Conclusions: Our findings strengthen our previous work indicating induction of proteotoxic stress as a possible strategy in FLT3-ITD+ AML therapy and open to the possibility of identifying new therapeutic targets in the crosstalk between AML and BMSCs, involving mechanotransduction and YAP signaling.

Keywords: AML; Actin cytoskeleton; Bone marrow stromal cells; ER stress; Oxidative stress; Proteotoxic stress; Tumor microenvironment; YAP.


Conflict of interest statement

The authors declare that they have no competing interests.

Figures

Fig. 1
Fig. 1
The FLT3-ITD+ MOLM-13 cells and primary leukemic stem cells are sensitive to the combination of RA, Btz and ATO. A MOLM-13 AML cells were treated for 72 h with 10nM RA, 2.25nM Btz, and 500nM ATO, alone or in combination. In all the figures retinoic acid is indicated as R, bortezomib as B, and ATO as A. Cell death was assessed by propidium iodide (PI) exclusion assay, analyzed by flow cytometry (one-way ANOVA). B Cell cycle analysis of MOLM-13 cells 48 h after treatments as in (A). The cells treated with BA show an increased percentage of subG1 phase relative to C cells but only those treated with RBA exhibit significant modulation of all the cell cycle phases. (the asterisks refer to two-way ANOVA analysis of each sample compared vs RBA, and colors are in accordance with the corresponding phase of the cell cycle; § indicates two-way ANOVA analysis of subG1 BA vs subG1 C: P < 0.005). C MOLM-13 cell morphology analyzed by Wright-Giemsa staining, 72 h after treatments. D FLT3-ITD+ CD34+ cells, isolated from patients at diagnosis (n = 5 upper panels) or from healthy volunteers (n = 3 lower panels), were treated ex vivo for 96 h with 10nM RA, 3nM Btz, and 500nM ATO, alone or in combination. Cell death (left) and cell density (right) were measured by flow cytometry after staining with PI (one-way ANOVA)
Fig. 2
Fig. 2
RBA combined treatment generates ER stress without consequent activation of the pro-survival UPR pathway. A TEM analysis of MOLM-13 cells, 24 h after treatment, shows swollen ER in the cells treated with R alone and with the combination RBA relative to C cells. Black arrows point to ER tubules. Dashed squares in the upper panels indicate the areas magnified in the lower panels. B Confocal microscopy images of MOLM-13 cells, 24 h after treatment, stained with anti-calnexin (CNX) and anti-BiP antibodies. C Expression levels of BiP, sXBP1, and CHOP genes, 48 h after treatment, measured by RT-qPCR (one-way ANOVA)
Fig. 3
Fig. 3
Oxidative stress is mostly responsible for the cytotoxic effect of the combination on MOLM-13 cells. A ROS levels were quantified in MOLM-13 cells by flow cytometry, upon the incorporation of the oxidation-sensitive dye CMH2-DCFDA, 48 h after RBA treatment (one-way ANOVA). B TEM analysis focused on mitochondria of MOLM-13 cells, 24 h after treatment; areas delimited in dashed squares in the upper panels are magnified in the lower panels. C MOLM-13 cells mitochondrial membrane depolarization, measured by flow cytometry as increased green/red fluorescence ratio of the JC-1 dye, 48 h after treatments. On the left are shown representative flow cytometry plots, on the right the histogram reports average values of the green/red MFI ratio. D Confocal microscopy images of MOLM-13 cells stained with an anti-NRF-2 antibody. E NRF-2 expression in MOLM-13 cells, 24h after treatment, measured by flow cytometry (unpaired Student’s T test). F MOLM-13 cell death was measured by PI exclusion assay, 72 h after treatment with RBA, in the absence or in the presence of 20mM N-acetyl-cysteine (left, two-way ANOVA). G ROS measurement, in cells treated with or without NAC, for 48 h (right, two-way ANOVA)
Fig. 4
Fig. 4
Murine bone marrow stromal cells nullify the effect of the combination RBA on MOLM-13 cells, but ascorbic acid restores it. A PI exclusion assay showing cell death of MOLM-13 leukemic cells treated with 10nM RA, 2.25nM Btz, and 500nm ATO (RBA) for 72 h, in mono-culture (blue) or co-culture (red) with primary BMSCs and MS-5 stromal cell line, (left and right panel respectively, one-way ANOVA). B Cell death (left) and cell proliferation (right) of MOLM-13 cells (upper panels) and MS-5 cells (lower panels) treated in co-culture with RBA and 4.5mM ascorbic acid (ASC), for 72 h (one-way ANOVA). MOLM-13 cells, treated in mono-culture, are shown as control (blue bars). C MOLM-13 cells were treated in co-culture with MS-5 cells as in (B), and ROS levels were measured after 72 h. D HMOX, BiP, sXBP1, and CHOP mRNA expression levels of MOLM-13 cells, treated for 24 h as in (B) (one-way ANOVA). E MOLM-13 and MS-5 cells were treated with the combination RBA and ASC as in (B) in co-culture. After 24 h, the conditioned medium (CM) was collected and used to treat MOLM-13 cells in mono-culture. The graph shows cell death of MOLM-13 cells treated for 48 h with CM (one-way ANOVA). F MS-5 cells were treated in co-culture with MOLM-13 for 72 h, then analyzed for Nrf-2 expression by confocal microscopy. The histogram reports the quantification of Nrf-2 mean fluorescence intensity (n = 8 fields ± S.E.M., one-way ANOVA). G ROS measurement in MS-5 cells from the co-culture by flow cytometry (one-way ANOVA). H Assessment of BiP and sXBP1 mRNA expression levels in MS-5 cells from the co-culture, 24 h after treatment (one-way ANOVA)
Fig. 5
Fig. 5
BMSCs undergo cytoskeletal rearrangements and re-localize YAP in the cytosol when treated with the combination RBA plus ASC in co-culture with leukemic cells. A The right panels show representative images of MS-5 cells treated in co-culture with MOLM-13 for 72 h, then stained with phalloidin to detect F-actin (orange). Cells were counterstained with Hoechst to identify nuclei (blue). The right panels show the same analysis, but MS-5 cells were treated with the combination RBA plus ASC in the absence of the MOLM-13 cells. B YAP protein levels in MS-5 cells, treated in co-culture with MOLM-13 cells (upper panel) or in mono-culture (lower panel), were evaluated by western blot analysis, upon nucleus-cytosol fractionation. Lamin A/C was used as nuclear marker and stain free protein detection technology (BioRad) for total protein normalization. The graphs report the average ratio of YAP amount in the cytosol over that in the nucleus (paired Student’s T test). C Single confocal images of a Z stack, taken in the center or in the apical portion of MS-5 cells, stained as in (A), to examine the actin cap. D The violin plot reports the measurements of MS-5 nuclear thickness, obtained by the confocal analysis shown in (C) and in Supplemental Fig. 6. E PI exclusion assay showing cell death of MOLM-13 leukemic cells co-cultured for 72 h with MS-5 cells silenced (siYAP) or not (siNC) for YAP protein (two-way ANOVA). F CTGF and GLS mRNA expression levels of MS-5 cells as mono- or co-culture with MOLM-13 cells, upon 72 h of treatment (two-way ANOVA)
Fig. 6
Fig. 6
The combination of RBA plus ASC acid significantly prolongs the life span of NSG mice engrafted with human FLT3-ITD+ MOLM-13 cells. A Kaplan-Meyer survival plot showing OS of NSG mice engrafted with MOLM-13 leukemic cell line and treated with vehicle, RBA, or RBA + ASC, starting at day 2 after cell injection. (control = 12, RBA = 5 and RBA + ASC = 17 from three independent experiments). B Histological analysis of the spleen, liver, and kidney of NSG engrafted mice, treated or not with the combination RBA plus ASC, show no signs of toxicity due to the treatment. C The treatment with RBA plus ASC reduces the percentage of leukemic cells in the BM of engrafted mice. Both control and treated mice were sacrificed when showing posterior limb paralysis. Bone marrow was flushed by femurs and purified mononucleated cells were analyzed by flow cytometry after staining with an anti-human CD45 antibody (unpaired Student’s T test). D Wright-Giemsa staining of the cells collected from mice bone marrow shows extensive vacuolation of MOLM-13 cells isolated from the BM of treated mice present to a much lesser extent in those obtained from control ones. G indicates murine granulocytes that show no vacuolation

References

    1. Genomic and Epigenomic Landscapes of Adult De Novo Acute Myeloid Leukemia. N Engl J Med. 2013;368(22):2059–2074. - PMC - PubMed
    1. Schmidt-Arras D, Böhmer S-A, Koch S, et al. Anchoring of FLT3 in the endoplasmic reticulum alters signaling quality. Blood. 2009;113(15):3568–3576. - PubMed
    1. Choudhary C, Schwäble J, Brandts C, et al. AML-associated Flt3 kinase domain mutations show signal transduction differences compared with Flt3 ITD mutations. Blood. 2005;106(1):265–273. - PubMed
    1. DiNardo CD, Perl AE. Advances in patient care through increasingly individualized therapy. Nat Rev Clin Oncol. 2019;16(2):73–74. - PMC - PubMed
    1. Fröhling S, Schlenk RF, Breitruck J, et al. Prognostic significance of activating FLT3 mutations in younger adults (16 to 60 years) with acute myeloid leukemia and normal cytogenetics: a study of the AML Study Group Ulm. Blood. 2002;100(13):4372–4380. - PubMed

LinkOut - more resources