. 2023 Nov;10(31):e2304336.
doi: 10.1002/advs.202304336. Epub 2023 Aug 31.

Photomanipulation of Minimal Synthetic Cells: Area Increase, Softening, and Interleaflet Coupling of Membrane Models Doped with Azobenzene-Lipid Photoswitches

Affiliations

Photomanipulation of Minimal Synthetic Cells: Area Increase, Softening, and Interleaflet Coupling of Membrane Models Doped with Azobenzene-Lipid Photoswitches

Mina Aleksanyan et al. Adv Sci (Weinh). 2023 Nov.

Abstract

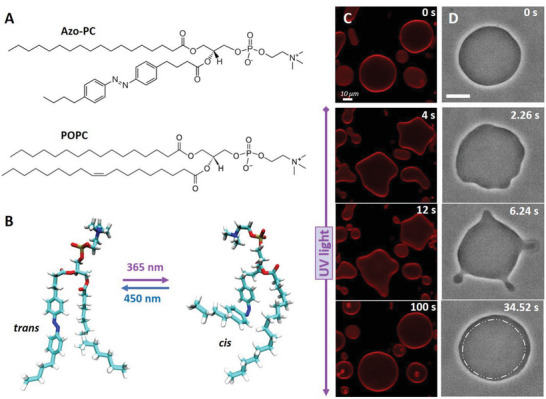
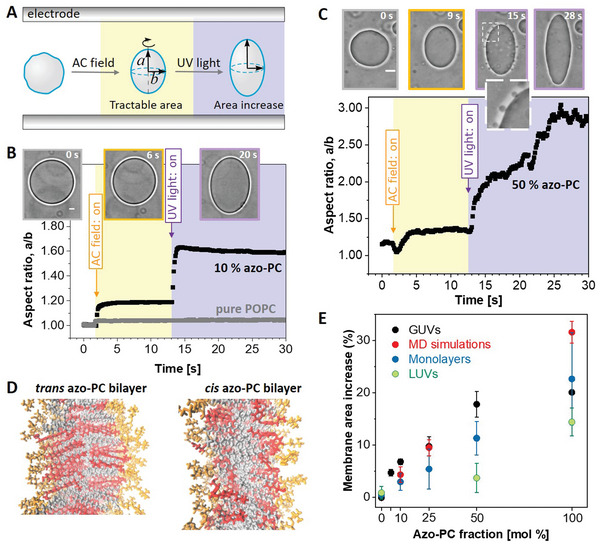
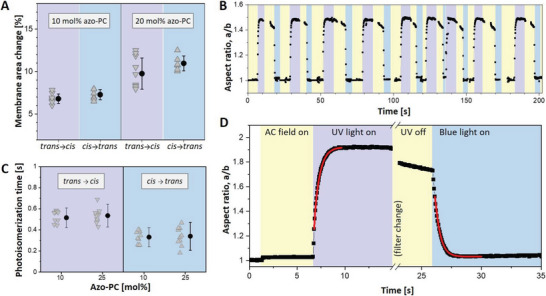
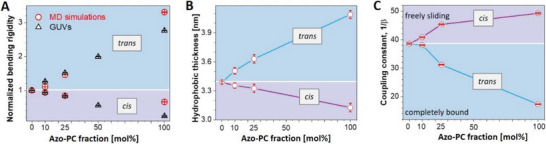
Light can effectively interrogate biological systems in a reversible and physiologically compatible manner with high spatiotemporal precision. Understanding the biophysics of photo-induced processes in bio-systems is crucial for achieving relevant clinical applications. Employing membranes doped with the photolipid azobenzene-phosphatidylcholine (azo-PC), a holistic picture of light-triggered changes in membrane kinetics, morphology, and material properties obtained from correlative studies on cell-sized vesicles, Langmuir monolayers, supported lipid bilayers, and molecular dynamics simulations is provided. Light-induced membrane area increases as high as ≈25% and a ten-fold decrease in the membrane bending rigidity is observed upon trans-to-cis azo-PC isomerization associated with membrane leaflet coupling and molecular curvature changes. Vesicle electrodeformation measurements and atomic force microscopy reveal that trans azo-PC bilayers are thicker than palmitoyl-oleoyl phosphatidylcholine (POPC) bilayers but have higher specific membrane capacitance and dielectric constant suggesting an increased ability to store electric charges across the membrane. Lastly, incubating POPC vesicles with azo-PC solutions results in the insertion of azo-PC in the membrane enabling them to become photoresponsive. All these results demonstrate that light can be used to finely manipulate the shape, mechanical and electric properties of photolipid-doped minimal cell models, and liposomal drug carriers, thus, presenting a promising therapeutic alternative for the repair of cellular disorders.

Keywords: atomic force microscopy (AFM); azo-PC; bending rigidity; giant vesicles; membrane capacitance; molecular dynamics simulations; photoswitchable lipids.


Conflict of interest statement

The authors declare no conflict of interest.

Figures

Figure 1
Figure 1
Trans‐to‐cis photoisomerization of azo‐PC triggers vesicle shape changes and area increase. A) Chemical structures of azo‐PC and the POPC. B) Representative snapshots of the molecular conformational changes upon photo isomerization of azo‐PC obtained from MD simulations. C) Confocal cross‐section images of 100 mol% azo‐PC GUVs labeled with 0.1 mol% Atto‐647N‐DOPE monitored during photoisomerization. Upon UV irradiation (365 nm), the GUVs undergo complex shape transformations of outward budding and bud re‐adsorption over time; the time stamps are shown in the upper part of the images. D) Phase contrast microscopy showing a time sequence of the trans‐to‐cis photoisomerization response of 50 mol% azo‐PC doped vesicles (azo‐PC:POPC 50:50) under UV illumination, see also Movie S2 (Supporting Information). Budding and bud re‐adsorption occur over time. The area of the vesicle increases: for comparison, the dash‐dotted contour in the last image shows the approximate GUV contour before irradiation (first snapshot). Scale bars correspond to 10 µm.
Figure 2
Figure 2
Area increase of membranes and monolayers doped with azo‐PC when exposed to UV irradiation. A) Sketch of the approach of GUV electrodeformation to assess the vesicle area change induced by UV light. The vesicles are first exposed to an AC field (5 kV m−1 and 1 MHz) to pull out thermal fluctuations and deform them into a prolate ellipsoid with semi‐axes a and b. Then, while keeping the AC field on, UV irradiation (365 nm) is initiated. B,C) Electrodeformation and irradiation of GUVs made of pure POPC (gray trace in panel B) and containing 10 and 50 mol% azo‐PC, see also Movies S4–S6 (Supporting Information) showing the response of these three vesicles. The snapshots show example images of the vesicles before applying the AC field (gray frame), after the application of the AC field (orange frame), and when exposed to UV light (purple frame). A zoomed‐up vesicle segment (dashed region) is given in C, showing the produced vesicle buds right after irradiation. The vesicle semi‐axes are used to calculate the vesicle area. Scale bars are 10 µm. D) Snapshots from MD simulations bilayers composed of 100 mol% azo‐PC in trans and cis conformation. The head groups of the lipids are in orange, the azo‐benzene moiety in red, and the oleoyl tails in gray. The area of the bilayer increases and tits thickness decreases. E) Membrane area expansion as assessed from GUV electrodeformation (black data show mean and standard deviations, SD; see Figure S3, Supporting Information, for data from individual GUV measurements), MD simulations (red), Langmuir monolayer isotherms (dark blue; see Figure S3, Supporting Information, for data from individual measurements) and LUVs measured with dynamic light scattering (DLS) (green). The LUV data is based on vesicle hydrodynamic radius leading to a systematic underestimate of the area increase as UV‐triggered morphological transitions (as those shown in panel C and Figure 1C,D) cannot be accounted for.
Figure 3
Figure 3
Photoswitching reversibility and kinetics assessed from the response of azo‐PC GUVs exposed to UV and blue light. A) Membrane area change measured on vesicles containing 10 and 25 mol% of azo‐PC. Trans‐to‐cis isomerization upon UV illumination leads to area changes similar to that observed upon cis‐to‐trans isomerization under blue light. Each triangle indicates a measurement of an individual GUV. Mean and standard deviation values are also shown on the right. ANOVA test for null hypothesis testing for 10 and 25 mol% azo‐PC GUVs gives, respectively, p = 0.136 and p = 0.065, indicating statistically insignificant difference for the trans‐to‐cis versus cis‐to‐trans area change of membranes of a fixed fraction of azo‐PC. B) Multiple photoswitching cycles of 10 mol% azo‐PC vesicle shown in terms of the degree of deformation (a/b, aspect ratio) under UV light (purple regions) and blue light (blue regions) sequentially switched on and off; the same vesicle is shown in Movie S7 (Supporting Information). Throughout the experiment, the GUV is continuously exposed to AC‐field (5 kV m−1 and 1 MHz; yellow). Purple and blue regions in the graph schematically illustrate the time intervals when UV and blue light are switched on. C) Photoisomerization kinetics of 10 and 25 mol% azo‐PC containing GUVs. Data from individual GUVs are shown with triangles (10 vesicles per composition and condition were measured). Solid circles and line bars show means and standard deviations. D) Kinetic trace of the aspect ratio response to UV and blue light irradiation of a GUV containing 25 mol% azo‐PC. The exponential fits (red curves) yield the respective time constants as plotted in panel C. A short period of time is needed to mechanically change the filter at the microscope turret, during which the recording of the vesicle is paused.
Figure 4
Figure 4
Bending rigidity, thickness, and interleaflet coupling in membranes with various fractions of azo‐PC in the cis and trans states. A) Bending rigidity obtained from fluctuation spectroscopy (open triangles) and MD simulations (open circles). The results are normalized by the bending rigidity value of pure POPC (see non‐normalized data in Figure S6, Supporting Information). Blue and purple data correspond to trans and cis azo‐PC, respectively. For each composition, 10 GUVs are analyzed. Standard deviations are illustrated with line bars, smaller than the sizes of the symbols. B) Bilayer thickness data at various fractions of azo‐PC in trans and cis conformation obtained from MD simulations. C) Interleaflet coupling in cis and trans azo‐PC containing bilayers. The coupling constant is deduced from simulation data by using the formula based on polymer brush model,[ 47 ] in which the elasticity ratio scales quadratically with a hydrophobic thickness of the bilayer (κ/K =  βd 2) and 1/β describes the coupling between the bilayer leaflets. Purple and blue trends demonstrate the coupling constants for cis and trans bilayers, respectively. Line bars are standard deviations and smaller than the size of the symbols.
Figure 5
Figure 5
Specific membrane capacitance measurements and estimates of the dielectric permittivity of 100 mol% trans azo‐PC and pure POPC membranes. A) Phase‐contrast images of a GUV exhibiting morphological prolate‐sphere‐oblate transitions under a frequency sweep at a field strength of 10 kV m−1. The scale bar is 10 µm. B) Aspect ratio versus frequency plot of the same GUV shown in (A). The critical field frequency (≈9 KHz) of the prolate‐oblate transition point with an aspect ratio a/b = 1 is indicated with an arrow. The table in the inset summarizes the specific membrane capacitance (averaged over 10 vesicles per composition), results for the mean bilayer thickness obtained from AFM (see also Figure S7, Supporting Information), and the estimated dielectric constant for pure POPC membrane and pure azo‐PC bilayer in the trans state.
Figure 6
Figure 6
Two examples (a) and (b) of the photoresponse of POPC vesicles exogenously doped with azo‐PC and irradiated with UV and blue light. The vesicles were exposed to a solution of azo‐PC at 15.56 µm bulk concentration (equivalent to the total lipid concentration in the GUV suspension). The GUVs adopt highly tubulated morphologies under exposure to UV light (365 nm). Under blue light irradiation (450 nm), most of the tubules are re‐adsorbed and the vesicles adopt their initial non‐tubulated morphology, see also Movie S8 (Supporting Information). Illumination conditions are indicated on the upper‐right side of each snapshot. The scale bars correspond to 10 µm.
Figure 7
Figure 7
Free energy of flip‐flop of azo‐PC and molecular curvature. A,B,D,E) PMF calculation plots for the flip‐flop energy of azo‐PC (A,D) and POPC (B,E) in a bilayer containing 25 mol% azo‐PC and 75 mol% POPC when the photoswitch is in the trans (A,B) or in the cis state (D,E). The maxima of the plots illustrate the energy barrier for the flip‐flop. The standard error of each calculation is shown in gray. C,F) Snapshots of 100 aligned and centered azo‐PC molecules (see text for details) in trans (C) and cis (F) state. Green, gray, and red corresponded to PC head groups, hydrocarbon tails, and azobenzene tails, respectively. The blue arrow on the bottom right indicates the direction of the membrane normal.

Similar articles

Cited by

References

    1. a) Masiero S., Lena S., Pieraccini S., Spada G. P., Angew. Chem., Int. Ed. 2008, 47, 3184; - PubMed
    2. b) Wang Z., Erhart P., Li T., Zhang Z.‐Y., Sampedro D., Hu Z., Wegner H. A., Brummel O., Libuda J., Nielsen M. B., Moth‐Poulsen K., Joule 2021, 5, 3116.
    1. Baigl D., Lab Chip 2012, 12, 3637. - PubMed
    1. Palacci J., Sacanna S., Vatchinsky A., Chaikin P. M., Pine D. J., J. Am. Chem. Soc. 2013, 135, 15978. - PubMed
    1. Mallick A., Roy S., Nanoscale 2018, 10, 12713. - PubMed
    1. Pacheco M., Jurado‐Sánchez B., Escarpa A., Angew. Chem., Int. Ed. 2019, 58, 18017. - PubMed

LinkOut - more resources