

Developing a Blood Cell-Based Diagnostic Test for Myalgic Encephalomyelitis/Chronic Fatigue Syndrome Using Peripheral Blood Mononuclear Cells
- PMID: 37653608
- PMCID: PMC10602530
- DOI: 10.1002/advs.202302146
Developing a Blood Cell-Based Diagnostic Test for Myalgic Encephalomyelitis/Chronic Fatigue Syndrome Using Peripheral Blood Mononuclear Cells
Abstract
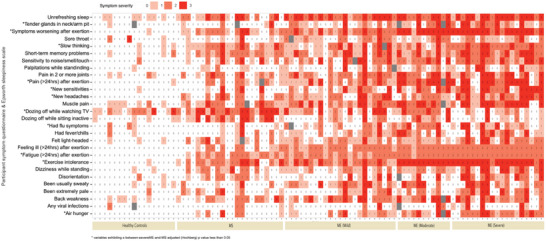
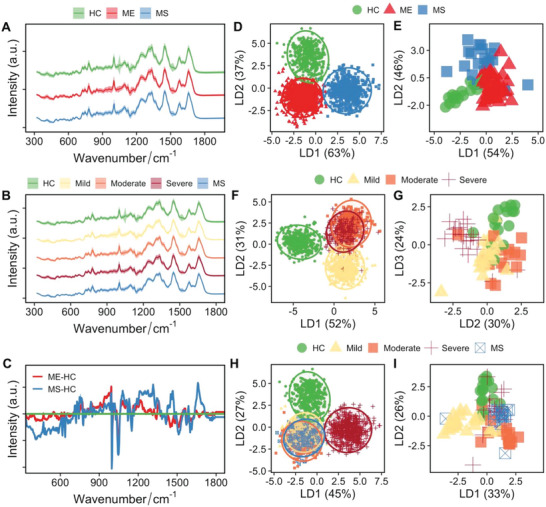
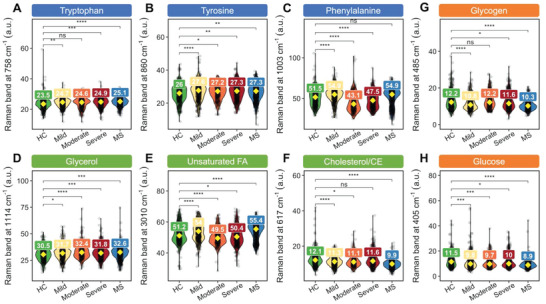
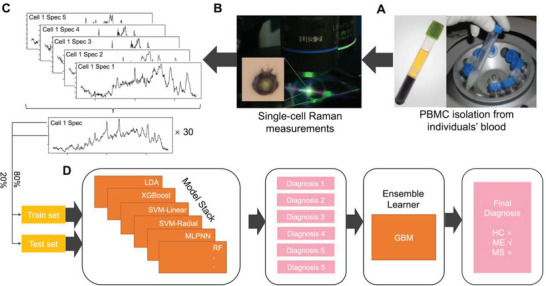
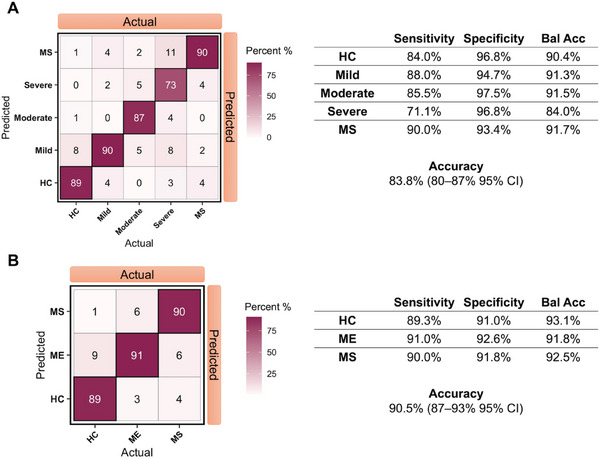
Myalgic encephalomyelitis/chronic fatigue syndrome (ME/CFS) is characterized by debilitating fatigue that profoundly impacts patients' lives. Diagnosis of ME/CFS remains challenging, with most patients relying on self-report, questionnaires, and subjective measures to receive a diagnosis, and many never receiving a clear diagnosis at all. In this study, a single-cell Raman platform and artificial intelligence are utilized to analyze blood cells from 98 human subjects, including 61 ME/CFS patients of varying disease severity and 37 healthy and disease controls. These results demonstrate that Raman profiles of blood cells can distinguish between healthy individuals, disease controls, and ME/CFS patients with high accuracy (91%), and can further differentiate between mild, moderate, and severe ME/CFS patients (84%). Additionally, specific Raman peaks that correlate with ME/CFS phenotypes and have the potential to provide insights into biological changes and support the development of new therapeutics are identified. This study presents a promising approach for aiding in the diagnosis and management of ME/CFS and can be extended to other unexplained chronic diseases such as long COVID and post-treatment Lyme disease syndrome, which share many of the same symptoms as ME/CFS.
Keywords: Raman microspectroscopy; machine learning; mitochondria; multiple sclerosis; myalgic encephalomyelitis/chronic fatigue syndrome; peripheral blood mononuclear cells; single cell.
© 2023 The Authors. Advanced Science published by Wiley-VCH GmbH.
Conflict of interest statement
The authors declare no conflict of interest.
Figures
Similar articles
-
The search for a blood-based biomarker for Myalgic Encephalomyelitis/ Chronic Fatigue Syndrome (ME/CFS): from biochemistry to electrophysiology.J Transl Med. 2025 Feb 4;23(1):149. doi: 10.1186/s12967-025-06146-6. J Transl Med. 2025. PMID: 39905423 Free PMC article. Review.
-
A SWATH-MS analysis of Myalgic Encephalomyelitis/Chronic Fatigue Syndrome peripheral blood mononuclear cell proteomes reveals mitochondrial dysfunction.J Transl Med. 2020 Sep 24;18(1):365. doi: 10.1186/s12967-020-02533-3. J Transl Med. 2020. PMID: 32972442 Free PMC article.
-
A new approach to find biomarkers in chronic fatigue syndrome/myalgic encephalomyelitis (CFS/ME) by single-cell Raman micro-spectroscopy.Analyst. 2019 Jan 28;144(3):913-920. doi: 10.1039/c8an01437j. Analyst. 2019. PMID: 30207334
-
A nanoelectronics-blood-based diagnostic biomarker for myalgic encephalomyelitis/chronic fatigue syndrome (ME/CFS).Proc Natl Acad Sci U S A. 2019 May 21;116(21):10250-10257. doi: 10.1073/pnas.1901274116. Epub 2019 Apr 29. Proc Natl Acad Sci U S A. 2019. PMID: 31036648 Free PMC article.
-
Key Pathophysiological Role of Skeletal Muscle Disturbance in Post COVID and Myalgic Encephalomyelitis/Chronic Fatigue Syndrome (ME/CFS): Accumulated Evidence.J Cachexia Sarcopenia Muscle. 2025 Feb;16(1):e13669. doi: 10.1002/jcsm.13669. J Cachexia Sarcopenia Muscle. 2025. PMID: 39727052 Free PMC article. Review.
Cited by
-
Raman micro-spectroscopy as a tool to study immunometabolism.Biochem Soc Trans. 2024 Apr 24;52(2):733-745. doi: 10.1042/BST20230794. Biochem Soc Trans. 2024. PMID: 38477393 Free PMC article. Review.
-
Untargeted Metabolomics and Quantitative Analysis of Tryptophan Metabolites in Myalgic Encephalomyelitis Patients and Healthy Volunteers: A Comparative Study Using High-Resolution Mass Spectrometry.ACS Chem Neurosci. 2024 Oct 2;15(19):3525-3534. doi: 10.1021/acschemneuro.4c00444. Epub 2024 Sep 20. ACS Chem Neurosci. 2024. PMID: 39302151 Free PMC article.
-
Exploring the joint potential of inflammation, immunity, and receptor-based biomarkers for evaluating ME/CFS progression.Front Immunol. 2023 Dec 20;14:1294758. doi: 10.3389/fimmu.2023.1294758. eCollection 2023. Front Immunol. 2023. PMID: 38187396 Free PMC article.
-
The search for a blood-based biomarker for Myalgic Encephalomyelitis/ Chronic Fatigue Syndrome (ME/CFS): from biochemistry to electrophysiology.J Transl Med. 2025 Feb 4;23(1):149. doi: 10.1186/s12967-025-06146-6. J Transl Med. 2025. PMID: 39905423 Free PMC article. Review.
-
Long COVID and post-acute sequelae of SARS-CoV-2 pathogenesis and treatment: A Keystone Symposia report.Ann N Y Acad Sci. 2024 May;1535(1):31-41. doi: 10.1111/nyas.15132. Epub 2024 Apr 9. Ann N Y Acad Sci. 2024. PMID: 38593220 Free PMC article.
References
-
- Carruthers B. M., Jain A. K., Meirleir K. L. D., Peterson D. L., Klimas N. G., Lerner A. M., Bested A. C., Flor‐Henry P., Joshi P., Powles A. C. P., Sherkey J. A., van de Sande M. I., J. Chronic Fatigue Syndr. 2003, 11, 7.
-
- Choutka J., Jansari V., Hornig M., Iwasaki A., Nat. Med. 2022, 28, 911. - PubMed
-
- Underhill R. A., Med. Hypotheses 2015, 85, 765. - PubMed
-
- Markle J. G. M., Frank D. N., Mortin‐Toth S., Robertson C. E., Feazel L. M., Rolle‐Kampczyk U., von Bergen M., McCoy K. D., Macpherson A. J., Danska J. S., Science 2013, 339, 1084. - PubMed
Publication types
MeSH terms
Grants and funding
LinkOut - more resources
Full Text Sources
Medical