. 2023 Aug 25;102(34):e34786.
doi: 10.1097/MD.0000000000034786.

Immune-related risk prognostic model for clear cell renal cell carcinoma: Implications for immunotherapy

Affiliations

Immune-related risk prognostic model for clear cell renal cell carcinoma: Implications for immunotherapy

Ronghui Chen et al. Medicine (Baltimore). .

Abstract

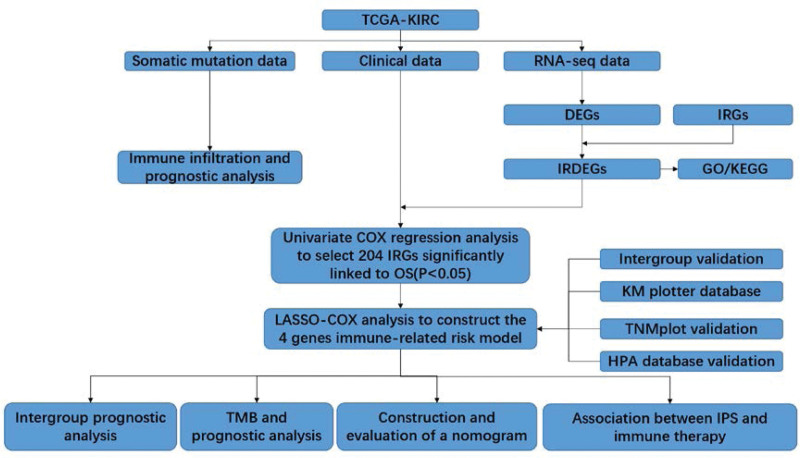
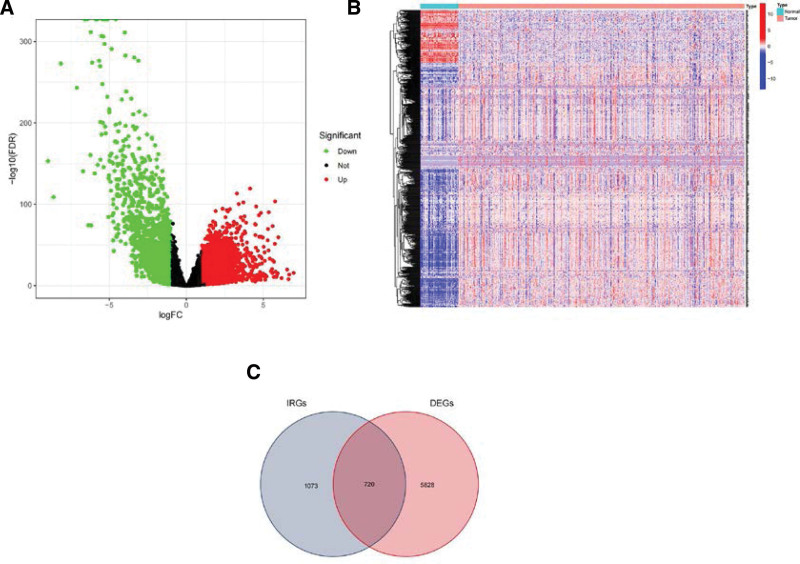
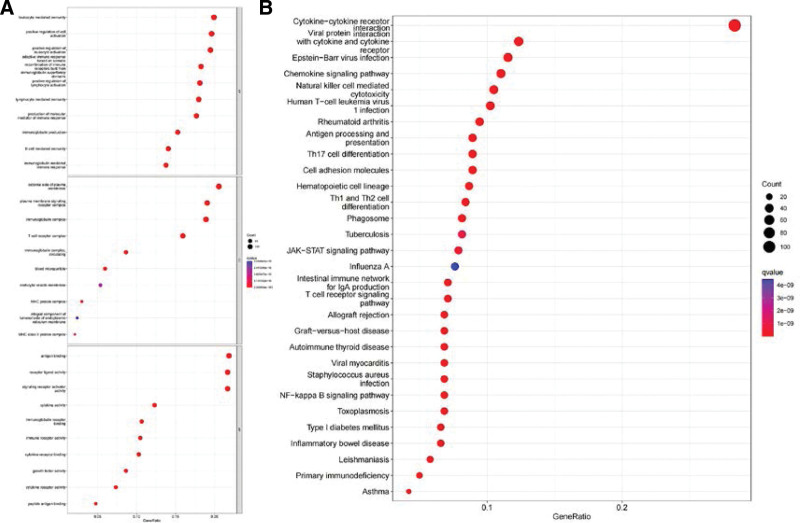
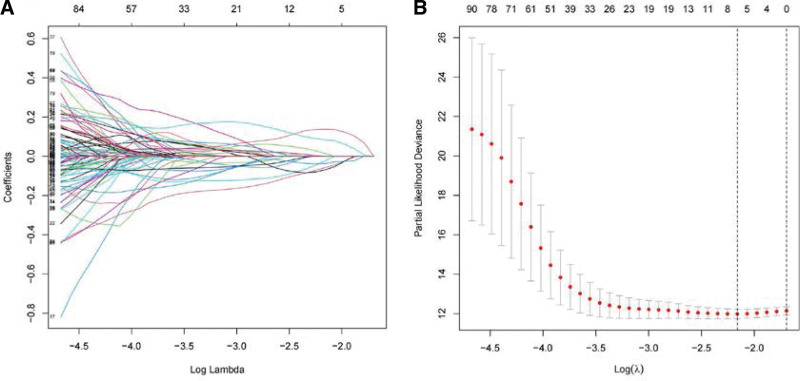
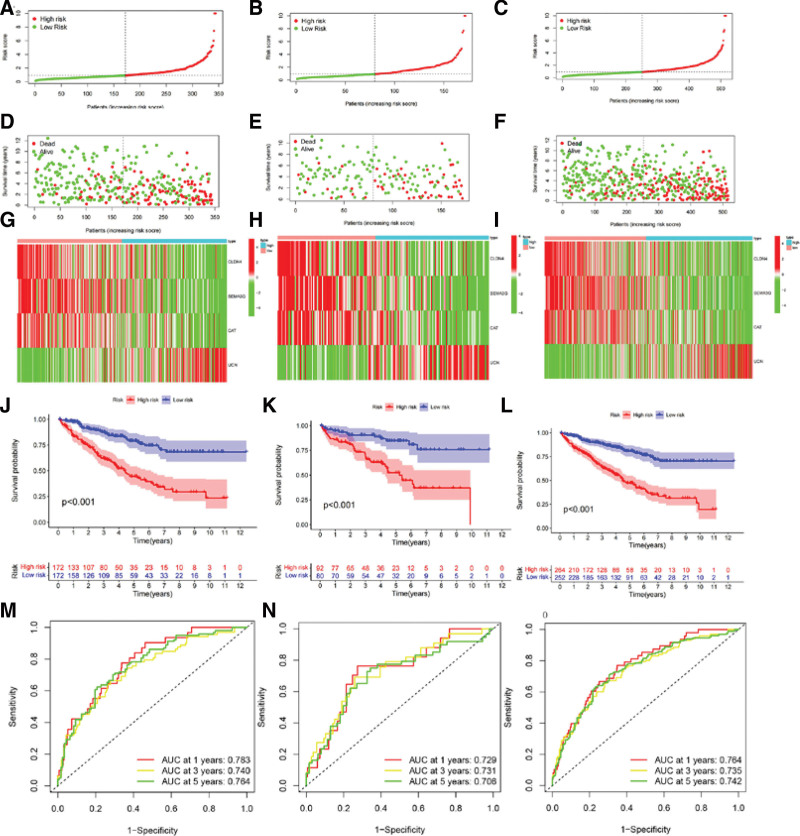
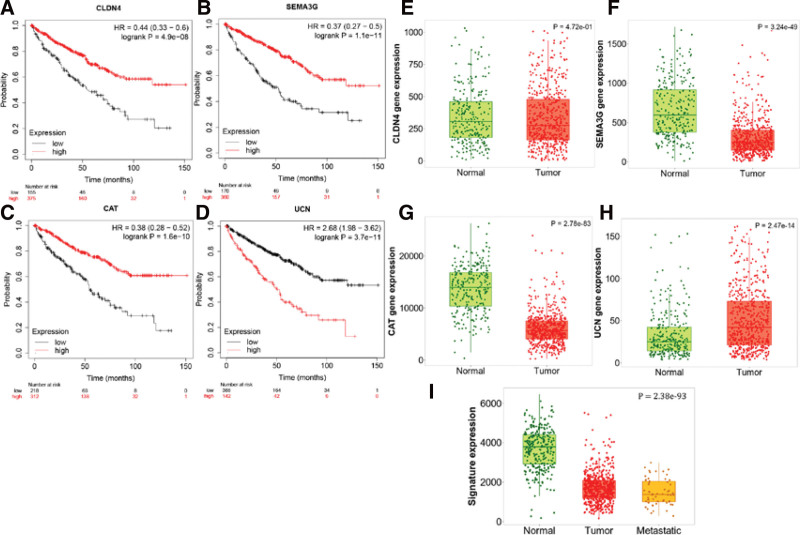
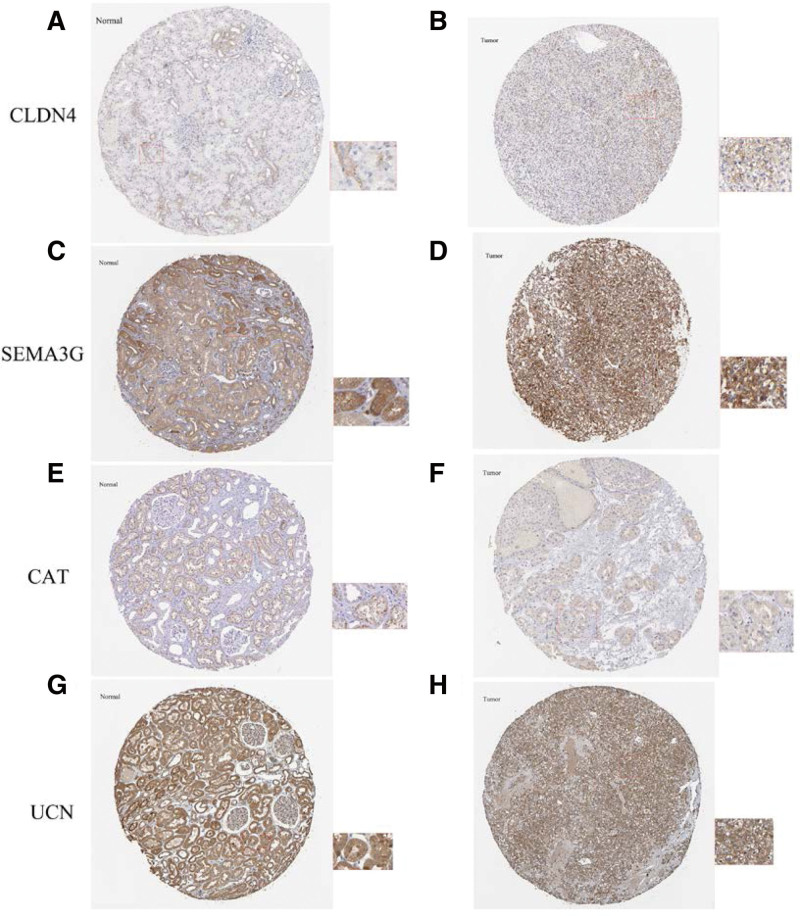
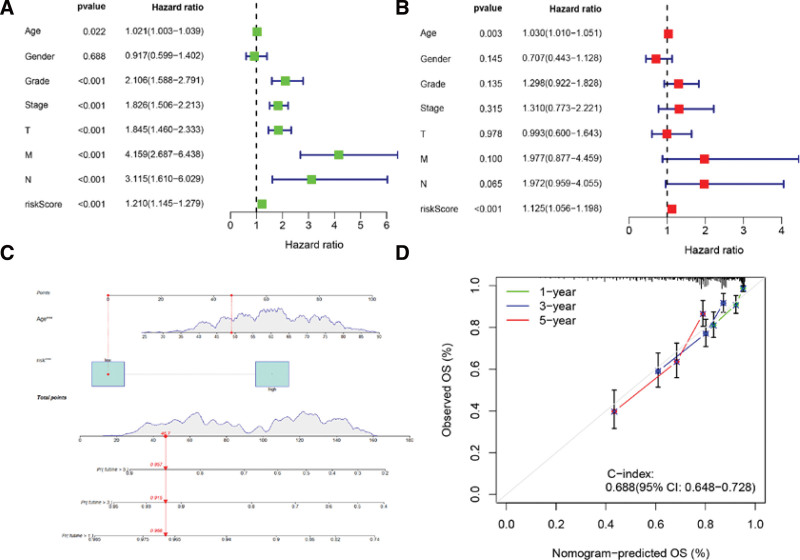
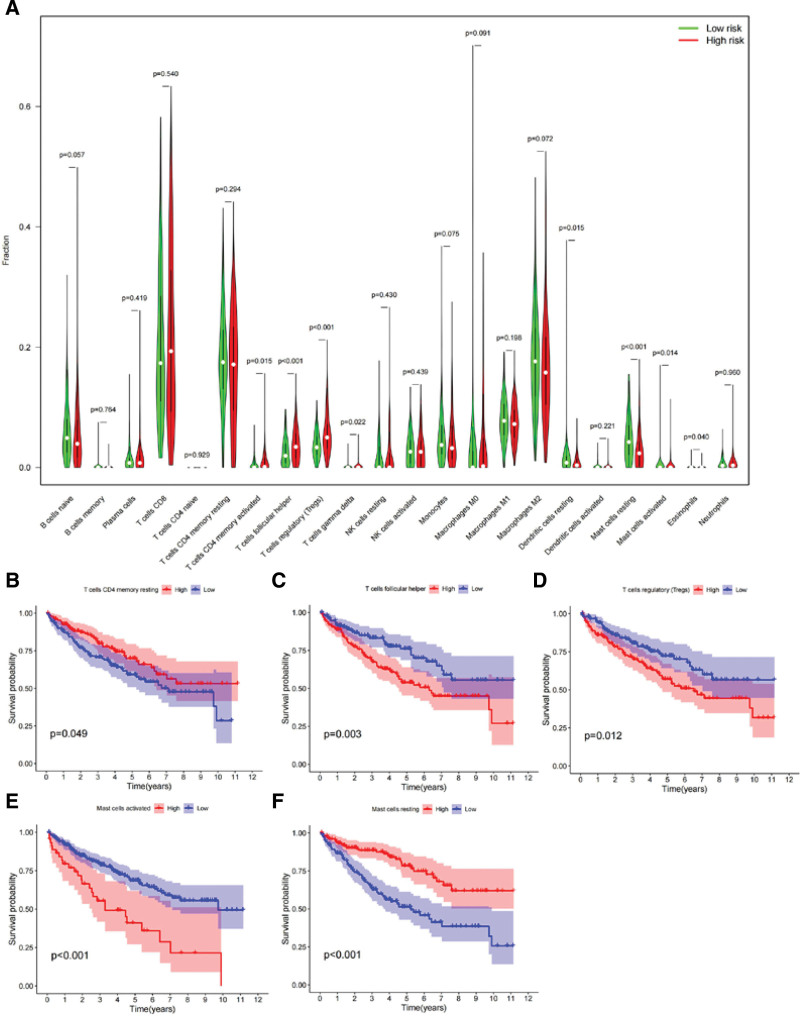
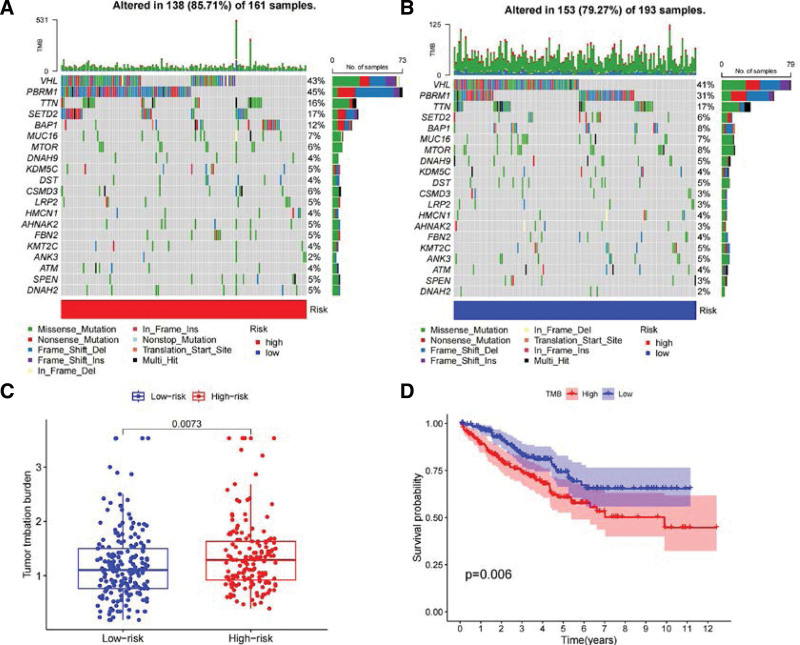
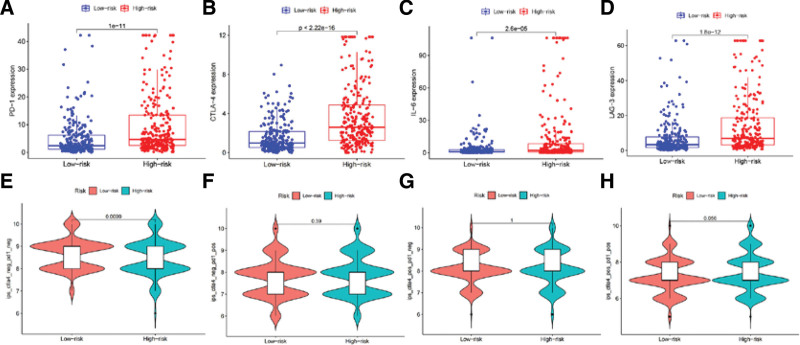
Clear cell renal cell carcinoma (ccRCC) is associated with complex immune interactions. We conducted a comprehensive analysis of immune-related differentially expressed genes in patients with ccRCC using data from The Cancer Genome Atlas and ImmPort databases. The immune-related differentially expressed genes underwent functional and pathway enrichment analysis, followed by COX regression combined with LASSO regression to construct an immune-related risk prognostic model. The model comprised 4 IRGs: CLDN4, SEMA3G, CAT, and UCN. Patients were stratified into high-risk and low-risk groups based on the median risk score, and the overall survival rate of the high-risk group was significantly lower than that of the low-risk group, confirming the reliability of the model from various perspectives. Further comparison of immune infiltration, tumor mutation load, and immunophenoscore (IPS) comparison between the 2 groups indicates that the high-risk group could potentially demonstrate a heightened sensitivity towards immunotherapy checkpoints PD-1, CTLA-4, IL-6, and LAG3 in ccRCC patients. The proposed model not only applies to ccRCC but also shows potential in developing into a prognostic model for renal cancer, thus introducing a novel approach for personalized immunotherapy in ccRCC.


Conflict of interest statement

The authors have no conflicts of interest to disclose.

Figures

Figure 1.
Figure 1.
Flowchart of the study. DEG = differentially expressed gene, GO = gene ontology, IRDEG = immune-related differentially expressed gene, IRG = immune-related gene, KEGG = Kyoto Encyclopedia of Genes and Genomes, LASSO = least absolute shrinkage and selection operator, OS = overall survival, TCGA = The Cancer Genome Atlas, TMB = tumor mutation burden.
Figure 2.
Figure 2.
Identify the relevant genes for ccRCC in the TCGA database. Volcano plot (A) and heatmaps (B) of differentially expressed genes between ccRCC and normal kidney tissue, and Venn diagram (C) of IRDEGs. ccRCC = clear cell renal cell carcinoma, IRDEG = immune-related differentially expressed gene, TCGA = The Cancer Genome Atlas.
Figure 3.
Figure 3.
Functional enrichment analysis of immune related IRDEGs in ccRCC. (A) Results of gene ontology (GO) analysis: molecular function (MF), cellular component (CC) and biological process (BP). (B) Results of Kyoto Encyclopedia of Genes and Genomes (KEGG) analysis. ccRCC = clear cell renal cell carcinoma, IRDEG = immune-related differentially expressed gene.
Figure 4.
Figure 4.
Construction of the immune-related genes risk model. (A) Cross-validation of parameter selection in the LASSO model (cvfit curve) and (B) the LASSO regression coefficient spectrum (lambda curve). LASSO = least absolute shrinkage and selection operator.
Figure 5.
Figure 5.
Build and validate a risk model for immune-related genes in the training, testing, and overall groups. (A–I) The distribution of immune-related risk scores, as well as the overall survival status, risk score distribution, and key gene associations (red for positive correlation, green for negative correlation) in the training, testing, and overall groups. (J–L) Kaplan–Meier survival curves represent the survival status and time of the training group, validation group, and overall group. (M–O) Receiver operating characteristic curve (ROC) curves validate the predictive accuracy of the immune-related risk model for predicting 1, 3, and 5-year overall survival (OS) in the training, testing, and overall groups. AUC = area under the curve.
Figure 6.
Figure 6.
Validation of IRDEGs as potential prognostic biomarkers was performed using an external dataset. (A–D) The overall survival (OS) analysis of CLDN4, SEMA3G, CAT, and UCN in the ccRCC dataset (Kaplan–Meier Plotter). (E–I) Differential expression results of CLDN4, SEMA3G, CAT, UCN in the gene chip dataset of normal kidney-renal cancer (TNMplot). CAT = catalase, ccRCC = clear cell renal cell carcinoma, CLDN4 = claudin 4, IRDEG = immune-related differentially expressed gene, SEMA3G = semaphorin 3G, UCN = urocortin.
Figure 7.
Figure 7.
The expression of IRDEGs verified based on HPA database. (A–H) Immunohistochemistry (IHC) showed the expression levels of CLDN4, SEMA3G, CAT, UCN in normal kidney tissue and ccRCC. CAT = catalase, ccRCC = clear cell renal cell carcinoma, CLDN4 = claudin 4, IRDEG = immune-related differentially expressed gene, SEMA3G = semaphorin 3G, UCN = urocortin.
Figure 8.
Figure 8.
Assessment of the independent prognostic value of the risk model. Univariate (A) and multivariate (B) Cox regression analyses of risk score and clinical characteristics. (C) The nomogram combining risk score and age to predict OS at 1, 3, and 5 years for ccRCC patients. (D) Calibration curves. ***P < .001; **P < .001; *P < .05. ccRCC = clear cell renal cell carcinoma, OS = overall survival.
Figure 9.
Figure 9.
Immune infiltration and prognosis analysis in ccRCC patients. (A) Violin plots comparing 22 immune cell types between high-risk and low-risk groups of ccRCC patients. (B–F) Kaplan–Meier survival curves of immune cell infiltration levels and overall survival in ccRCC patients. ccRCC = clear cell renal cell carcinoma.
Figure 10.
Figure 10.
Analysis of somatic mutations in high- and low-risk groups. (A) Genes with the top 20 mutation frequencies in the high-risk group. (B) Genes with the top 20 mutation frequencies in the low-risk group. (C) Differences in tumor mutation burden (TMB) between high- and low-risk groups. (D) Kaplan–Meier curve of TMB in high- and low-risk groups and overall survival.
Figure 11.
Figure 11.
Sensitivity analysis of high- and low-risk groups of ccRCC patients to immune inhibitors. (A–D) Expression levels of PD-1, CTLA-4, IL-6, and LAG-3 immune checkpoints in high- and low-risk groups. (E–H) The relationship between the Immunophenoscore (IPS) of high-risk and low-risk groups of ccRCC patients and PD-1 and CTLA-4 immune checkpoint inhibitors. ccRCC = clear cell renal cell carcinoma, CTLA-4 = cytotoxic T lymphocyte-associated antigen-4, PD-1 = programmed cell death protein 1.

Similar articles

Cited by

References

    1. Sung H, Ferlay J, Siegel RL, et al. . Global Cancer Statistics 2020: GLOBOCAN estimates of incidence and mortality worldwide for 36 Cancers in 185 Countries. CA Cancer J Clin. 2021;71:209–49. - PubMed
    1. Jonasch E, Gao J, Rathmell WK. Renal cell carcinoma. BMJ. 2014;349:g4797. - PMC - PubMed
    1. Motzer RJ, Bacik J, Mazumdar M. Prognostic factors for survival of patients with stage IV renal cell carcinoma: memorial sloan-kettering cancer center experience. Clin Cancer Res. 2004;10:6302S–3S. - PubMed
    1. Wettersten HI, Abu Aboud O, Lara PN, et al. . Metabolic reprogramming in clear cell renal cell carcinoma. Nat Rev Nephrol. 2017;13:410–9. - PubMed
    1. Auvray M, Auclin E, Barthélémy P, et al. . Second-line targeted therapies after nivolumab-ipilimumab failure in metastatic renal cell carcinoma. Eur J Cancer. 2019;108:33–40. - PubMed