. 2023 May 19;12(10):2030.
doi: 10.3390/plants12102030.

Humulus lupulus L. Strobilus In Situ Photosynthesis and Respiration Temperature Responses

Affiliations

Humulus lupulus L. Strobilus In Situ Photosynthesis and Respiration Temperature Responses

William L Bauerle et al. Plants (Basel). .

Abstract

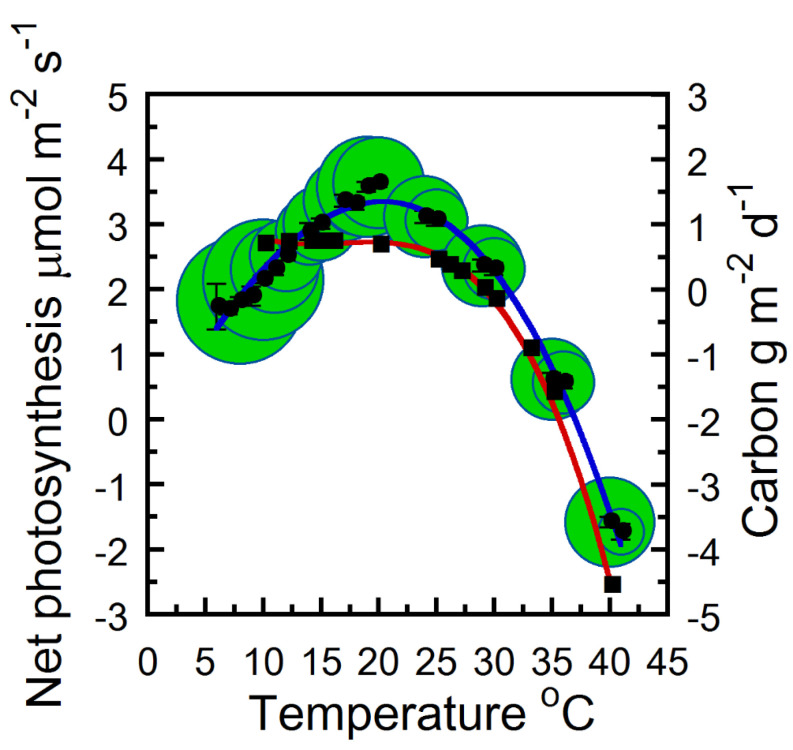
The primary metabolism and respiration of the hop strobilus has not been quantified in response to daily temperature fluctuations. The objective of this study was to assess strobilus gas exchange, specifically the response to temperature fluctuations. Hop strobilus were measured under controlled environment conditions to assess the organ's contribution to carbon assimilation and respiration during the maturation phase. Strobilus-specific daily carbon budgets were estimated in response to temperature fluctuation. The optimal temperature for net carbon gain occurred at 15.7 °C. Estimated strobilus carbon uptake decreased approximately 41% per 5 °C increase in temperature above 20 °C. Daily temperatures within 10-27 °C resulted in a net positive strobilus daily carbon balance, whereas temperature increases beyond 27 °C increasingly exhaust strobilus carbon reserves. The Q10 temperature coefficient (the rate respiration increases every 10 °C rise in temperature) approximately doubled per 10 °C rise in temperature from 7-40 °C (1.94-2) with slightly reduced values at lower temperatures. In conclusion, we show that photosynthetically active bracts maintain a positive strobilus carbon balance at moderate temperatures and as mean daily temperatures progressively exceed 27 °C, strobilus net carbon reserves are precipitously exhausted due to ever-increasing respiration rates.

Keywords: Q10; bracts; carbon autonomy; flowering crops; hop cone; organ respiration.


Conflict of interest statement

The authors declare no conflict of interest.

Figures

Figure 1
Figure 1
The dark respiration of hop strobili as a function of temperature. Cuvette O2 and CO2 were atmospheric ambient (~21% and 415 μmol mol−1). Samples were pooled across four measurement intervals (n = 24; black circles are means ± SE). Strobili temperature measurements were binned per 1 °C as indicated by green bubble diameter (n = 2–33). The Solid blue line is a linear regression fitted to the entire data set (0.274 × x + 1.09; r2 = 0.96).
Figure 2
Figure 2
The net photosynthesis and carbon gain and loss responses of hop strobili as a function of temperature. Cuvette O2 and CO2 were atmospheric ambient (~21% and 415 μmol mol−1). Photosynthetically active radiation was controlled at 400 μmol m−2 s−1. Samples were pooled across four measurement intervals (n = 24 means ± SE). Strobili temperature measurements were binned per 1 °C as indicated by bubble diameter (n = 2–43). Solid circles are the mean instantaneous net photosynthesis (μmol m−2 s−1) and solid squares are the daily carbon estimates (g m−2 d−1). Solid blue line is a second order polynomial regression fitted to the entire observed data set (−8.71 × 10⁻⁵ × x3 + −5.32 × 10⁻³ × x2 + 0.326 × x + −0.34; r2 = 0.99). Solid red line is a second order polynomial regression fitted to the daily carbon estimates (−4.26 × 10⁻⁴ × x3 + 2.14 × 10⁻² × x2 + −0.349 × x + 2.56; r2 = 0.99).
Figure 3
Figure 3
Net hop strobili daily carbon and respiration estimates versus mean daily temperature per m2 at Yakima, WA (day of year 205–237, 2022) at ambient (415 μmol mol−1) CO2. Blue line and squares are daily carbon gain/loss and red line and circles are daily respiration (g m−2 d−1). The Solid blue and red lines are a linear regression fitted to the entire carbon gain/loss (0.232 × x + 5.96; r2 = 0.87) and respiration data set (0.122 × x + 1.39; r2 = 0.98).
Figure 4
Figure 4
Hop strobili daily carbon gain/loss and respiration estimates per m2 at Yakima, WA (day of year 205–237, 2022) at ambient CO2 (415 μmol mol−1). (a) blue line and squares are daily carbon gain/loss and red line and circles are daily respiration (g m−2 d−1). (b) red line and circles are the mean daily temperature (°C).

References

    1. Zattler F., Jehl J. On the influence of atmospheric conditions on yield and quality of the hops in the Hallertau in the period 1926–1961. Hopfen. Rundsch. 1962;13:61–64. (In German)
    1. Mozny M., Tolasz R., Nekovar J., Sparks T., Trnka M., Zalud Z. The impact of climate change on the yield and quality of Saaz hops in the Czech Republic. Agr. Forest. Meteorol. 2009;149:913–919. doi: 10.1016/j.agrformet.2009.02.006. - DOI
    1. Peat W.E., Thomas G.G. The photosynthetic activity of the developing hop cone. Ann Appl Biol. 1974;76:319–324. doi: 10.1111/j.1744-7348.1974.tb01372.x. - DOI - PubMed
    1. Bauerle W.L. Humulus lupulus L. strobilus photosynthetic capacity and carbon assimilation. Plants. 2023;12:1816. doi: 10.3390/plants12091816. - DOI - PMC - PubMed
    1. Kirschbaum M.U.F. Modelling forest growth and carbon storage in response to increasing CO2 and temperature. Tellus. 1999;51B:871–888. doi: 10.3402/tellusb.v51i5.16500. - DOI

LinkOut - more resources